Download to read offline

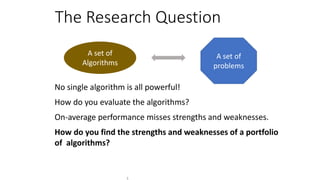
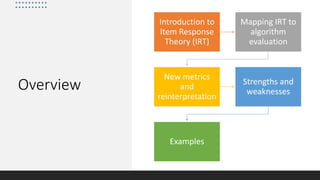
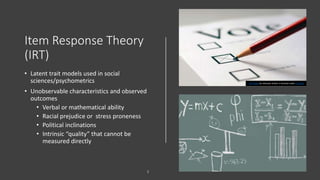
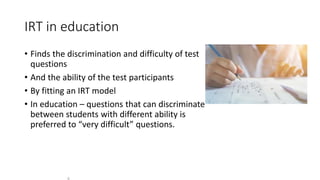

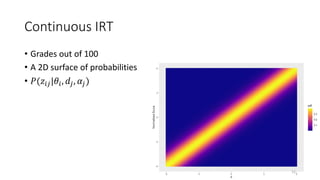
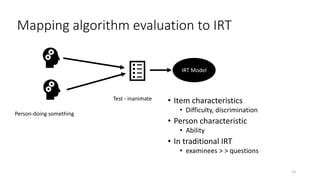
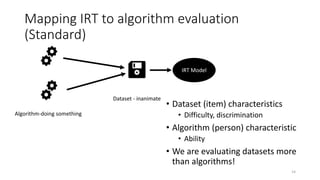
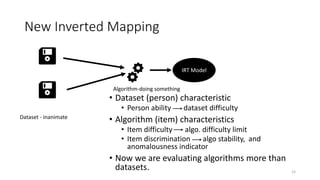
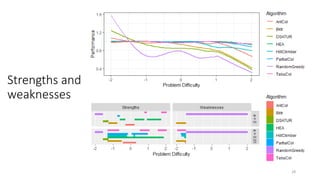
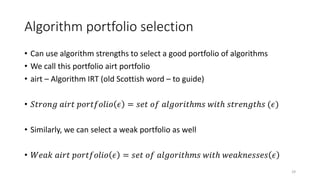
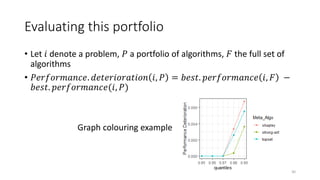
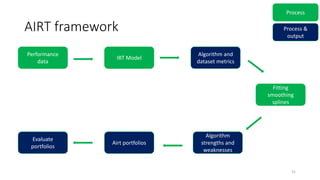
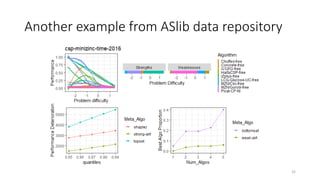
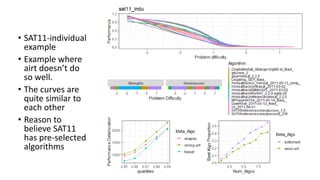
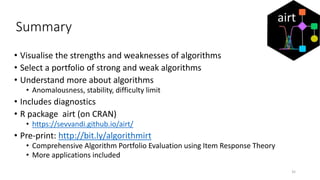


The document discusses the evaluation of algorithm portfolios using Item Response Theory (IRT), highlighting its application in assessing algorithm strengths and weaknesses within various problem domains. IRT is adapted from psychometrics to analyze classifier performance, focusing on the hidden abilities of datasets and the effectiveness of algorithms. The research introduces new metrics and methods for evaluating algorithm portfolios, leading to the development of the AIRT framework for selecting strong and weak algorithm combinations.