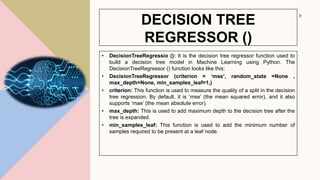
This document provides an overview of classification predictive modeling and decision trees. It discusses classification, including binary, multi-class, and multi-label classification. It then describes decision trees, including key terminology like root nodes, interior nodes, and leaf nodes. It explains how decision trees are built and parameters like max_depth and min_samples_leaf. Finally, it compares regression and classification trees and discusses advantages and disadvantages of decision trees.


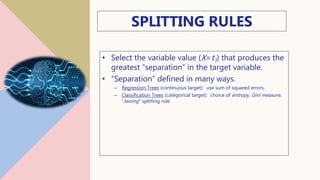
![REGRESSION TREES
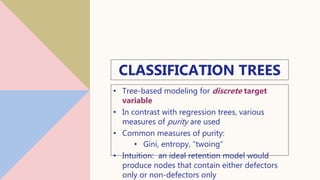
• Tree-based modeling for continuous target
variable
• most intuitively appropriate method for loss
ratio analysis
• Find split that produces greatest separation in
∑[y – E(y)]2
• i.e.: find nodes with minimal within variance
• and therefore greatest between variance
• like credibility theory
12](https://image.slidesharecdn.com/classification-221202092348-b3837787/85/Classification-pptx-12-320.jpg)