Asi está the economy july 2016 Circulo de Empresarios
dcp171776_420406
1. 30 October 2015
Office for National Statistics | 1
United Kingdom Balance of Payments:
The Pink Book, 2015
Coverage: UK
Date: 30 October 2015
Geographical Area: UK
Theme: Economy
Main points
• The deficit on the current account balance widened in 2014 to £92.9 billion. This deficit equated
to 5.1% of gross domestic product (GDP) in current market prices. In both terms, this was the
largest annual deficit since records began in 1948.
• In 2014, the deficit on trade in goods widened by £8.4 billion to £123.7 billion. The widening was
due to a decrease in exports, partially offset by a smaller decrease in imports.
• The surplus in the trade in services balance widened by £8.1 billion, from £81.0 billion in 2013 to
£89.1 billion in 2014.
• The deficit on the primary income balance widened from £16.8 billion in 2013 to £33.1 billion in
2014. The widening was mainly due to the surplus on direct investment falling from £18.8 billion
in 2013 to £2.0 billion in 2014.
• The deficit on the secondary income balance narrowed by £1.6 billion, from £26.8 billion in 2013
to £25.2 billion in 2014.
• In 2014, the UK recorded a net inflow of £89.4 billion, an increase from a net inflow of £69.1
billion in 2013.
• The UK IIP showed a net liability position of £454.1 billion at the end of 2014, with reported
assets totalling £10,171.7 billion and reported liabilities totalling £10,625.9 billion.
Chapter 1: Economic commentary
This section of the Pink Book provides an examination of recent trends, main movements and
international comparisons for a range of information contained in subsequent Pink Book chapters.
All international data have been sourced from the Organisation for Economic Co-operation and
Development (OECD) on 6 October 2015.
Introduction
The balance of payments measures the economic transactions of the UK with the rest of the
world. These transactions can be broken down into 3 main accounts: the current account, the
capital account and the financial account. The current account comprises the trade in goods and
2. 30 October 2015
Office for National Statistics | 2
services account, the primary income account and secondary income account. The balance on
these accounts is known as the current account balance. The current account balance shows the
difference between the sum of exports and income receivable and the sum of imports and income
payable.
To elaborate on the conceptual framework, a current account balance is in surplus if overall credits
exceed debits and in deficit if overall debits exceed credits. Closely related to the balance of
payments is the international investment position series of statistics. The international investment
position measures the levels of financial investment with the rest of the world, inward and outward.
Developments in these measures are of substantial importance in assessing the degree of external
balance that the UK experiences. For instance, external macroeconomic shocks can be transmitted
rapidly to the UK economy through investment choices of both UK and foreign investors, as well as
through changes in asset prices and fluctuations in the exchange rate. These shocks could have a
wider effect on the whole economy than would be implied through trade and investment links alone.
This first chapter will give an analytical overview of the UK’s current account and its constituent
parts. It will primarily focus on the trade account and primary income account to assess both their
changing roles in the deterioration of the current account balance. There will also be a further
decomposition of the international investment position (mainly trends in direct investment) and
its subsequent rate of returns, to assess their contribution in the decline in the primary income
(earnings on investment) in recent years.
Current account overview
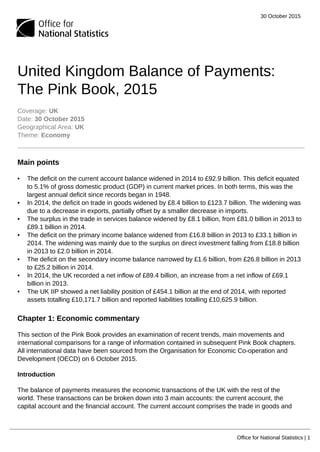
To assess recent developments in the UK’s external position, Figure 1.1 breaks down the current
account balance into its constituent parts – the trade balance, the primary income balance (income
earned by UK residents from investment abroad, less income earned by non-residents on their UK
investments) and the secondary income balance that captures transfers between the UK and other
countries (for example, payments and receipts to or from EU institutions and other international
bodies). It shows that the UK has been recording a current account deficit every year since 1994.
From 1998 to 2008, the deficit widened, peaking at 3.6% of nominal Gross Domestic Product (GDP)
in 2008. In subsequent years, the deficit narrowed slightly but – widened thereafter. Latest figures
show the current account deficit widened to 5.1% of nominal GDP in 2014, representing the largest
deficit (in annual terms) since our records began in 1948. This deterioration in performance can be
partly attributed to the recent weakness in the primary income balance: suggesting that UK earnings
on assets overseas had fallen relative to the earnings of foreign investors in the UK.
3. 30 October 2015
Office for National Statistics | 3
Figure 1.1: UK current account balance as percentage of nominal GDP, 1994 to 2014
Source: Office for National Statistics
Notes:
1. Click on image to view an enlarged version.
Download chart
XLS format
(27 Kb)
Although previous deteriorations in the current account balance have been driven by a fall in the
balance on trade, the recent deterioration is a consequence of a sharply lower primary income
balance (income earned by UK residents from investments overseas, less income earned by non-
residents on their UK investments). The primary income balance also reached a record annual
deficit in 2014 of 1.8% of nominal GDP; a figure that can be primarily attributed to a fall in UK
residents’ earnings from investment abroad and broadly stable foreign resident earnings on their
investments in the UK.
For a detailed assessment of the deterioration in the balance, Figure 1.2 compares contributions to
the fall in the current account balance since 2011 (Panel C) to previous occurrences in the 1970s
(Panel A) and 1980s (Panel B). The first 2 panels show that previous declines – of 6.0% and 4.7%
of GDP respectively – were mainly driven by the balance of trade (shown in the dark pink bars). In
4. 30 October 2015
Office for National Statistics | 4
contrast, the latest decline in the current account of 4.7% of GDP since 2011 has been driven by a
decline of the primary income balance (shown in the light pink bars). A further examination of the
drivers of the deterioration in the primary income will be analysed in a subsequent section of this
chapter.
Figure 1.2: Contributions to the deterioration in the UK current account relative to selected
calendar years, percentage of nominal GDP
Source: Office for National Statistics
Notes:
1. Q1 refers to Quarter 1 (Jan to Mar), Q2 refers to Quarter 2 (Apr to June), Q3 refers to Quarter 3 (July to Sept) and
Q4 refers to Quarter 4 (Oct to Dec).
2. Click on image to view an enlarged version.
Download chart
XLS format
(30.5 Kb)
From an international perspective, there have been striking divergences in the relative performance
of current accounts among the major developed economies. Figure 1.3 compares the current
account balance as a proportion of GDP in the G7 economies (US, Japan, UK, Germany, France,
Italy and Canada) for the 2 most recent calendar years with that in 2007. This highlights how the
external position of major economies has evolved following the economic downturn in 2008 and
2009.
5. 30 October 2015
Office for National Statistics | 5
Figure 1.3 shows that 4 of the 7 economies (including the UK) have experienced deteriorating
current account balances relative to 2007; however, the UK recorded the largest current account
deficit as a percentage of GDP (5.1%) among these economies in 2014. Along with Japan, this also
represented a worsening position relative to 2013. In contrast, Germany experienced the largest
current account surplus as a percentage of GDP in 2014, which was also a small improvement on
the surpluses recorded in 2007 and 2013. Similarly, the US experienced an improvement on its
current account balance as a percentage of GDP from a deficit of 5.0% in 2007 to a deficit of 2.3%
of GDP in 2014.
Figure 1.3: Current account balances of the G7 economies, 2007, 2013 and 2014
Credits less debits
Source: Office for National Statistics, Organisation for Economic Co-operation and Development,
Japan Cabinet Office
Notes:
1. Data for Japan in 2007 is sourced from the Japanese Cabinet Office.
Download chart
XLS format
(26 Kb)
Trade
6. 30 October 2015
Office for National Statistics | 6
As explored in the introductory section above, the trade balance has accounted for a smaller
proportion to the recent deterioration in the current account balance, when compared to previous
occurrences. The widening of the current account deficit has been a consequence of the decline in
the primary income account. This, coupled with a persistent trade deficit, has put further downward
pressure on the current account balance, highlighting the importance of trade in the developments of
the current account balance.
Figure 1.4 compares the trade balance as a proportion of GDP in the G7 economies (US, Japan,
UK, Germany, France, Italy and Canada) for the calendar year 2014 with that in 2007. It shows 4
of the 7 economies (the UK included) experienced an improvement in their trade balance relative
to 2007. The UK, France and the US experienced trade deficits in both periods, while Germany
recorded a trade surplus in both periods.
Figure 1.4: G7 trade balances as a percentage of nominal GDP, 2007 and 2014
Credits less debits
Source: Office for National Statistics, Organisation for Economic Co-operation and Development
Download chart
XLS format
(25.5 Kb)
As illustrated in Figure 1.4, Japan, France and Canada experienced deteriorating trade balances
(when imports are greater than exports) in 2014 compared with 2007. This was particularly notable
for Japan and Canada who switched from a surplus in 2007 to a deficit in 2014. The US and UK
7. 30 October 2015
Office for National Statistics | 7
have, however, seen a narrowing in their trade balances when compared with 2007, while Germany
saw a slight increase in its surplus since 2007. However, Italy recorded a small deficit in 2007 but
switched to a comparatively large surplus in 2014. One contributing factor to explain the different
experiences across countries could be differences in relative exchange rate movements. Economic
theory suggests that, all else equal, depreciation in the exchange rate results in the fall of imports
and an increase in exports. This is because the purchasing power of the domestic currency falls,
requiring more currency to buy foreign goods. A currency appreciation has the opposite effect. The
recent strength of the pound in recent periods may have reduced the competitiveness of the UK’s
exports and the overall trade balance.
Figure 1.5 compares the trend in the Sterling trade weighted exchange rate index with that of
total exports and imports, relative to 2005. It shows between 2007 and 2009, the sterling effective
exchange rate depreciated by 22%. This was the largest depreciation of sterling in recent history,
more than reversing the appreciation of the late 1990s. However, this depreciation over this period
appears to have had at most a relatively modest impact on the UK’s trading position. Subsequent
to 2009, the pound has been appreciating, although over the last year it has appreciated at a faster
rate. This may be an indication of why UK’s exports were less competitive in the same period
resulting in the widening of the trade deficit to £34.5 billion in 2014.
Figure 1.5: UK Sterling effective exchange rate and total UK imports and exports 2005=100,
1994 to 2014
Credits less debits
Source: Office for National Statistics
8. 30 October 2015
Office for National Statistics | 8
Notes:
1. Click on image to view an enlarged version.
Download chart
XLS format
(27.5 Kb)
A detailed analysis of the trade balance shows a record surplus on services trade, offset to some
extent by a persistent deficit on goods. As illustrated in Figure 1.6, the recent strength of trade
surplus in services is partly due to lower imports, but also because of a resilient export performance.
The export of services as a percentage of GDP has increased by almost 71% since 1994, while
imports rose by just 33% over the same period. However, much of the weakness of aggregate UK
exports is attributable to the recent decline in the exports of goods, explained by the decline in
goods exports to the EU.
Figure 1.6: UK imports and exports as a percentage of nominal GDP, 1994 to 2014
Source: Office for National Statistics
Notes:
1. Click on image to view an enlarged version.
Download chart
XLS format
(28.5 Kb)
9. 30 October 2015
Office for National Statistics | 9
In levels terms, the values of UK exports of goods to the EU and non-EU countries are now broadly
similar: in 2014 these were £147.6 billion and £145.8 billion respectively. However, in recent years
UK goods exports to non-EU countries have grown at a much faster rate than UK goods exports
to the EU. Since 2007, goods exports to non-EU countries rose by 54%, while goods exports to
EU countries rose by only 15%. In part, this reflects the relative strength of these markets during
the downturn. Exports of goods to EU countries were more affected by the economic downturn,
highlighting the relative economic performances of the UK’s trading partners since then, with much
weaker demand growth in the EU and stronger demand growth in non-EU markets. This might
suggest that the extent of overseas demand for UK products may have been limited by prevailing
global economic conditions. However, whether the UK’s trade performance has been proportionate
to economic conditions in its major export partners is difficult to establish.
To analyse this closely, Figure 1.7 shows the growth of the UK’s goods and services export markets
compared with the actual growth of UK goods and services exports. The former involves weighting
the import growth in a selection of economies according to the amount that the UK exports to each
country.
Figure 1.7: UK annual percentage change in export markets and export growth, 2003 to 2014
Source: Office for National Statistics, IMF
Download chart
XLS format
(26 Kb)
10. 30 October 2015
Office for National Statistics | 10
Figure 1.7 indicates that the extent of overseas demand for UK goods may have been limited by
prevailing economic conditions. It shows that UK export growth broadly tracks the weighted import
growth of other countries. You would expect this, as a higher demand from abroad should translate
to export growth from the UK, all else being equal. UK export growth saw a marked decline during
the downturn of 2008 to 2009, recovering in 2010. The recent decline in export growth could in part
be attributed to weaker economic performance in the EU more than offsetting relatively stronger
growth in non-EU countries.
Figure 1.8: UK trade in goods and services balance with selected EU countries, 2003 to 2014
Source: Office for National Statistics
Notes:
1. Click on image to view an enlarged version.
Download chart
XLS format
(27.5 Kb)
Figure 1.8 and 1.9 examines the disparities in the UK’s trade balance with the EU and some non-
EU countries in more detail. UK trade in goods and services with the EU involves some bilateral
surpluses (Ireland and Netherlands) and some deficits, as seen in Figure 1.8. The most substantial
bilateral deficit within the EU is with Germany, which increased by 13% to £27.3 billion in 2014. The
UK trade balance with respect to Germany has been in deficit for the past decade with the largest
deficit recorded in 2014. In contrast, the UK trade balance with Ireland has been in surplus from
11. 30 October 2015
Office for National Statistics | 11
2003, while UK trade with the Netherlands has experienced both deficits and surpluses during this
period. The UK trade deficit with EU countries as a whole is currently valued at £61.7 billion.
Figure 1.9: UK trade in goods and services balance with selected non-EU countries, 2003 to
2014
Source: Office for National Statistics
Download chart
XLS format
(27.5 Kb)
Among the non-EU countries, the UK has seen rising surpluses in trade with the US in recent years,
reaching a peak of £41.0 billion in 2013 (Figure 1.9). However, the UK also had the largest trading
deficit with China in the last decade; this has grown markedly since 2005 and is currently recorded
at £19.6 billion.
Primary income
Figure 1.2 in the introductory section illustrated that in recent years, the deterioration in the current
account balance has become less attributable to the trade balances and more attributable to the
decline in the primary income balance. This suggests that UK earnings on assets overseas fell in
value relative to the earnings of foreign investors in the UK. Figure 1.10 shows the main drivers of
the primary income balance. This is a net concept, so it factors in the income flows to and from the
UK on our assets and liabilities with the rest of the world. It shows that the recent deterioration in the
primary income balance can be attributed to the decline in the direct investment income balance and
net income earned on debt securities.
For more detailed information on the decline of net direct investment income, please see our
analysis of foreign direct investment which is also published today.
12. 30 October 2015
Office for National Statistics | 12
Figure 1.10: Contribution to the UK primary income balance, 1997 to 2014
Source: Office for National Statistics
Notes:
1. Click on image to view an enlarged version.
Download chart
XLS format
(27 Kb)
The fall in the balance on primary income reflects a combination of different effects, including a
relative fall in the rates of return on UK assets held overseas. As set out in previous analysis,
the balance on primary income depends on the relative quantities of assets held by UK investors
overseas and overseas investors in the UK, and the relative rates of return that they earn on their
respective portfolios. All else being equal, larger holdings of assets by UK investors overseas will
tend to increase the balance on primary income. While increased holdings of UK assets by overseas
investors will lead to a decrease in the balance on primary income. Similarly, a relative fall in the rate
of return earned by UK investors will tend to decrease the balance on income. While a fall in the rate
of return for overseas investors would lead to an increase in the primary income balance.
As the primary income balance reflects the difference between 2 earnings flows from investments,
it can readily be decomposed into its 4 component parts: the stock of assets that the UK holds
overseas, and the rate of return it receives on those assets, as well as the stock of assets that
overseas agents hold in the UK, and the rate of return that they receive on those assets. As a matter
of accounting, the total earnings flows divided by the average value of opening and closing assets
held by the UK overseas, equates to the implied rate of return on these assets. Trends in all 3 are
examined in the next section.
13. 30 October 2015
Office for National Statistics | 13
Further examination of the UK’s stock position
With UK residents investing in overseas assets at a slower rate compared to their foreign
counterparts, there has also been a worsening of the UK’s International Investment Position (IIP).
The UK’s IIP comprises of UK assets (UK residents’ holdings of overseas assets) and UK liabilities
(foreign owned assets in the UK); with the Net International Investment Position (NIIP) simply the
difference between them. The IIP is made up of 5 distinguishable functional categories, which are:
• direct investment
• portfolio investment
• equity and investment fund shares
• debt securities
• financial derivatives
• other investment
• reserve assets
Figure 1.11 outlines the contribution to the UK’s NIIP during the past 2 decades. Since 1994, the
NIIP has consistently represented a negative position, with the exception of a brief positive outturn
in 2008. However, in recent years, the UK’s external position has deteriorated further, with latest
estimates showing a negative NIIP of around 25% of nominal GDP in 2014. This broadly represents
the accumulated deficits that the UK has run with the rest of the world and gives an indication of the
degree of external balance that the UK experiences. Historically, the UK has offset mostly negative
net portfolio and other investment with much larger positive net direct investment positions. A larger
deficit on portfolio investment and increased overseas holdings of Foreign Direct Investment (FDI)
assets in the UK combined with lower UK holdings of FDI abroad, account for the majority of the
recent fall in the NIIP.
14. 30 October 2015
Office for National Statistics | 14
Figure 1.11: Contribution to the UK net international investment position, 1994 to 2014
Source: Office for National Statistics
Notes:
1. Click on image to view an enlarged version.
Download chart
XLS format
(28 Kb)
Figure 1.12 focuses on the UK’s FDI position in detail, showing UK asset and liability stocks and the
net figure as a percentage of nominal GDP. Prior to 2012, the UK’s net FDI position was markedly
above zero as UK investors held more overseas assets (UK assets) than their foreign counterparts’
holdings of UK assets (UK liabilities). The gap between these 2 positions has converged in
subsequent years, with the stocks of UK liabilities surpassing that of UK assets in 2014, recording
the first ever negative FDI net position since our records begun. The UK’s net direct investment
reduced from a surplus of 28.1% in 2008 to a deficit of 8.1% in 2014 of nominal GDP respectively.
15. 30 October 2015
Office for National Statistics | 15
Figure 1.12: UK long-run FDI assets, liabilities and net positions, 1994 to 2014
Source: Office for National Statistics
Notes:
1. Click on image to view an enlarged version.
Download chart
XLS format
(27 Kb)
An examination of the rate of returns
While the total value of UK investors’ holdings of overseas assets has fallen relative to the value of
holdings in the UK by overseas investors, the fall in the rate of return on UK assets overseas may
have also played an important role in the widening of the deficit on the investment income balance.
Outlined in the above section, a fall in the rate of return earned by UK investors (or overseas
investors) will tend to reduce (or increase) the balance on investment income. For a detailed look
at the developments in these measures, Figure 1.13 shows the rates of return received by UK and
overseas investors for 3 different forms of asset functional categories: direct investment, portfolio
investment and other investments. It shows that during most of the years, the UK generated a higher
rate of return on its direct investments than overseas investors, while the differences for portfolio and
other investments were relatively slight.
16. 30 October 2015
Office for National Statistics | 16
Figure 1.13: UK and overseas rates of return: direct, portfolio and other investments, 1997 to
2014
Source: Office for National Statistics
Notes:
1. Click on image to view an enlarged version.
Download chart
XLS format
(28 Kb)
However, in the period coinciding with the further marked deterioration in the primary income
balance (2012 to 2014), the rates of return on direct investments have converged and overseas
investors now generate a higher rate of return on portfolio investments than their UK counterparts.
This could reflect a range of factors such as the relative strength of the UK economy or relative
weakness of overseas economies in which UK assets are based.
17. 30 October 2015
Office for National Statistics | 17
Figure 1.14: Assets (£ trillion), rates of return (%) and earnings (£ billion) for UK assets
overseas and overseas assets in the UK, 1994 to 2014
Source: Office for National Statistics
Notes:
1. Click on image to view an enlarged version.
Download chart
XLS format
(29 Kb)
Figure 1.14 summarises the main factors that appear to be driving the recent decline in the primary
income balance. Firstly, the gap between the stock of assets that the UK holds abroad and the stock
of assets held by overseas investors in the UK has widened markedly in recent years. This is likely
to be the result of a combination of currency effects and relative movements in FDI flows which have
had a greater impact on the stock of UK assets held abroad. Secondly, the rate of return that the UK
receives on its assets abroad has fallen slightly, while the rate of return earned by agents overseas
on assets in the UK has risen slightly. This likely reflects the strong performance of the UK economy,
in particular relative to the euro area, where a large fraction of the UK’s overseas assets are based.
Both of these factors have driven a growing wedge between UK earnings overseas and overseas
earnings in the UK, as shown in Panel C.
Chapter 2: Trade in goods
Trade in goods shows the extent of import and export activity between the UK and the rest of the
world. By definition, trade in goods covers:
• transactions in general merchandise
• goods for processing
• repairs on goods
• goods procured in ports by carriers
• non-monetary gold
18. 30 October 2015
Office for National Statistics | 18
General merchandise (with some exceptions) refers to moveable goods where real or imputed
changes of ownership happen.
Intra-community MTIC Fraud
When interpreting the trade figures, users should be aware that both exports and imports are
affected by VAT missing trader intra-community (MTIC) fraud. This led to an increase in both imports
and exports in 2006, and a subsequent fall in 2007, which was associated with the introduction of
the UK’s reverse charge derogation. This was an anti-fraud measure relating to mobile phones and
microchips, which placed the responsibility with purchasers rather than suppliers to account for the
VAT associated with these goods. (For more information on MTIC fraud, see the Methodological
notes relating to chapter 2).
Figure 2.1: UK trade in goods, 2004 to 2014
Source: Office for National Statistics
Download chart
XLS format
(31.5 Kb)
In 2014, the deficit on trade in goods widened by £8.4 billion to £123.7 billion. This was the
largest annual deficit on record. The widening was due to a decrease in exports, partially offset by
19. 30 October 2015
Office for National Statistics | 19
a decrease in imports. Exports decreased by 3.5% to £295.4 billion from £306.2 billion in 2013.
Imports decreased by 0.6% to £419.1 billion from the record high of £421.5 billion in 2013.
Figure 2.2: UK export and import volume indices, 2004 to 2014
Source: Office for National Statistics
Download chart
XLS format
(31.5 Kb)
Between 2013 and 2014, the export volume index rose by 1.2%. The rise mainly reflected a 2.9%
growth in exports of finished manufactures, of which, almost all of the growth was attributed to
exports of cars.
The import volume index showed continued recovery in 2014, increasing by 4.0% from 2013 and
reaching its highest level on record. The growth in import volume primarily reflects an increase in
finished manufactured goods and, again, cars.
20. 30 October 2015
Office for National Statistics | 20
Figure 2.3: UK export and import price indices, 2004 to 2014
Source: Office for National Statistics
Download chart
XLS format
(31 Kb)
Export prices fell by 3.4% between 2013 and 2014, reaching the lowest level since 2010. The fall
in export prices mainly reflects a 9.2% fall in oil export prices. The fall in the oil export price index
contributed almost a third of the overall decrease.
Import prices fell by 0.2% between 2013 and 2014. The overall fall is mainly attributed to oil import
prices, which fell 6.1% from 2013. The fall in oil prices was partially offset by an increase in semi-
manufactured goods; specifically material manufactures.
21. 30 October 2015
Office for National Statistics | 21
Figure 2.4: UK trade in oil, 2004 to 2014
Source: Office for National Statistics
Download chart
XLS format
(31 Kb)
Between 2013 and 2014, the deficit of trade in oil widened to £10.4 billion. Exports of oil fell by £6.5
billion to £32.7 billion. The decrease in the export of oil accounted for almost three-fifths of the total
annual fall in exports. Imports of oil fell by £6.1 billion to £43.0 billion over the same period.
Since 2005, the balance of oil has been in deficit, reaching a record £14.3 billion in 2012. In 2014,
both exports and imports reached their lowest levels since 2010. These falls reflect a drop in the
price of oil globally.
Between 2013 and 2014, the export volume index of oil fell by 3.0%. The import volume index of oil
rose by 2.2% over the same period, contradicting the fall in value of oil imports but supporting the
decrease in the import price of oil.
Trade by commodity
22. 30 October 2015
Office for National Statistics | 22
In 2014, manufactured goods accounted for around three quarters of all goods exported and
imported. Finished manufactures alone accounted for around 50% of both total exports and imports;
this mainly reflects strength in the machinery and transport equipment industry.
Between 2013 and 2014, exports of finished manufactures rose by £1.0 billion to a record high of
£147.5 billion. Over the same period, imports of finished manufactures rose by £10.1 billion to a
record of £210.8 billion. Again, this rise is mainly due to the machinery and transport equipment
industry.
Chapter 3: Trade in services
Trade in services covers the provision of services by UK residents to non-residents and vice versa.
It also covers transactions in goods which are not freighted out of the country in which transactions
take place, for example purchases for local use by foreign forces in the UK, or by UK forces abroad
and purchases by tourists. Transactions in goods which are freighted into or out of the UK are
included under trade in goods.
Figure 3.1: UK trade in services, 2004 to 2014
Source: Office for National Statistics
23. 30 October 2015
Office for National Statistics | 23
Download chart
XLS format
(31.5 Kb)
The surplus in the trade in services balance widened by £8.1 billion, from £81.0 billion in 2013, to
£89.1 billion in 2014. This was mainly due to:
• transport services recording an increase of £3.4 billion, from a surplus of £3.9 billion in 2013, to a
surplus of £7.3 billion in 2014
• other business services recording an increase of £1.6 billion, from a surplus of £20.0 billion in
2013, to a surplus of £21.6 billion in 2014
• telecommunication, computer and information services recording an increase of £1.4 billion, from
a surplus of £5.5 billion in 2013, to a surplus of £6.9 billion in 2014
• maintenance and repair services recording an increase of £1.2 billion, from a surplus of £0.9
billion in 2013, to a surplus of £2.1 billion in 2014
These were partially offset by:
• personal, cultural and recreational services recording an increase in the deficit of £0.8 billion,
from a deficit of £0.2 billion in 2013 to £1.0 billion in 2014
• manufacturing on physical inputs owned by others services recording a fall of £0.5 billion, from a
surplus of £1.8 billion in 2013, to £1.3 billion in 2014
• construction services recording a switch from a surplus of £0.3 billion in 2013, to a deficit of £0.2
billion in 2014
In 2014, exports were £4.9 billion higher than in 2013, at £219.8 billion, with increases mainly
in transport services, travel services, telecommunication, computer and information service and
maintenance and repair services of £3.1 billion, £1.6 billion, £1.3 billion and £1.1 billion respectively.
Slightly offsetting these were decreases in personal, cultural and recreational services, financial
services and manufacturing on physical inputs owned by others services of £0.9 billion, £0.9 billion
and £0.6 billion respectively.
In 2014, imports were £3.2 billion lower than in 2013, at £130.6 billion, with decreases mainly in the
financial services and other business services of £1.6 billion and £1.2 billion respectively. Slightly
offsetting these was an increase in travel services of £1.0 billion.
24. 30 October 2015
Office for National Statistics | 24
Figure 3.2: UK trade in transport services, 2004 to 2014
Source: Office for National Statistics
Download chart
XLS format
(31.5 Kb)
The surplus on the transport services balance widened by £3.4 billion, from £3.9 billion in 2013, to
£7.3 billion in 2014. This was mainly due to:
• passenger air transport services recording a decrease in the deficit of £2.1 billion, from a deficit
of £3.4 billion in 2013, to £1.3 billion in 2014
• other air transport services recording an increase in the surplus of £0.7 billion, from a surplus of
£3.8 billion in 2013, to £4.6 billion in 2014
• postal and courier services recording a switch from a deficit of £0.2 billion in 2013, to a surplus of
£0.5 billion in 2014
Slightly offset by:
• sea transport ships owned or chartered-in by UK residents services recording a decrease of £0.4
billion, from a surplus of £4.2 billion in 2013, to £3.8 billion in 2014
• passenger sea transport services recording a decrease of £0.3 billion, from a surplus of £1.4
billion in 2013 to £1.1 billion in 2014
25. 30 October 2015
Office for National Statistics | 25
In 2014, exports were £3.1 billion higher than in 2013, at £26.7 billion, with increases mainly in
air transport passenger revenue services and sea transport dry cargo freight on cross trades
services of £2.5 billion and £0.7 billion respectively. Smaller increases were recorded in air transport
disbursements in the UK and other revenue, of £0.5 billion and £0.4 billion respectively.
In 2014, imports were £0.3 billion lower than in 2013, at £19.4 billion, with decreases mainly
in postal and courier services and sea transport dry cargo time charter payments services of
£0.6 billion and £0.2 billion respectively. Partially offsetting these were increases in air transport
passenger expenditure services and air transport disbursements abroad services of £0.3 billion and
£0.2 billion respectively.
Figure 3.3: UK trade in travel services, 2004 to 2014
Source: Office for National Statistics
Download chart
XLS format
(31.5 Kb)
The deficit on travel services balance narrowed by £0.6 billion, from a deficit of £10.7 billion in 2013,
to £10.1 billion in 2014. This was mainly due to:
• personal education related travel services recording an increase of £0.5 billion, from a surplus of
£6.2 billion in 2013, to £6.7 billion in 2014
26. 30 October 2015
Office for National Statistics | 26
• other business travel recording an increase of £0.3 billion, from a surplus of £0.5 billion in 2013,
to £0.8 billion in 2014
Partially offset by:
• other personal travel services recording an increase of £0.2 billion, from a deficit of £17.6 billion
in 2013, to £17.8 billion in 2014
In 2014, exports were £1.6 billion higher than in 2013, at £28.3 billion, with increases mainly in other
personal travel services and personal education related travel services of £1.0 billion and £0.5 billion
respectively. Smaller increases were recorded in all other categories.
In 2014, imports were £1.0 billion higher than in 2013, at £38.4 billion, with increases mainly in other
personal travel services of £1.2 billion. Partially offsetting this was a decrease in other business
travel services of £0.2 billion.
Figure 3.4: UK trade in other business services, 2004 to 2014
Source: Office for National Statistics
Download chart
XLS format
(31.5 Kb)
27. 30 October 2015
Office for National Statistics | 27
Other business services covers a broad range of services including trade related services such as
operational leasing, and consultancy services such as advertising, engineering and legal services.
The surplus in other business services balance widened by £1.6 billion, from a surplus of £20.0
billion in 2013, to £21.6 billion in 2014. This was mainly due to:
• research and development services recording an increase of £1.2 billion, from a surplus of £1.4
billion in 2013, to £2.7 billion in 2014
• advertising and market research services recording an increase of £1.1 billion, from a surplus of
£1.4 billion in 2013, to £2.6 billion in 2014
Partially offset by:
• architectural, engineering and other technical services recording a decrease of £1.1 billion, from
a surplus of £8.0 billion in 2013, to £6.9 billion in 2014
In 2014, exports were £0.4 billion higher than in 2013, at £57.1 billion, with an increase in research
and development services of £0.4 billion, from a surplus of £5.3 billion in 2013, to £5.7 billion in
2014. The increase in professional and management consulting services of £3.6 billion, to £24.0
billion in 2014 was offset by a decrease in technical, trade-related and other business services of
£3.6 billion, to £27.4 billion in 2014.
In 2014, imports were £1.2 billion lower than in 2013, at £35.5 billion, with a decrease of £2.5
billion and £0.8 billion in technical, trade related and other business services and research and
development services respectively. These were partially offset by an increase of £2.1 billion in
professional and management consulting services.
28. 30 October 2015
Office for National Statistics | 28
Figure 3.5: UK trade in telecommunication, computer and information services, 2004 to 2014
Source: Office for National Statistics
Download chart
XLS format
(31 Kb)
The surplus in telecommunication, computer and information services balance widened by £1.4
billion, from a surplus of £5.5 billion in 2013, to £6.9 billion in 2014, this was mainly due to:
• computer services recording an increase of £1.3 billion, from a surplus of £1.8 billion in 2013, to
£3.1 billion in 2014
• telecommunications services recording an increase of £0.8 billion, from a surplus of £1.7 billion in
2013, to £2.5 billion in 2014
These were offset by information services recording a decrease of £0.6 billion, from a surplus of
£1.9 billion in 2013, to £1.3 billion in 2014.
In 2014, exports were £1.3 billion higher than in 2013, at £16.3 billion, with increases in
telecommunication services and computer services of £0.9 billion and £0.4 billion respectively.
29. 30 October 2015
Office for National Statistics | 29
In 2014, imports were £0.1 billion lower than in 2013, at £9.4 billion, with a decrease in computer
services of £0.9 billion, partially offset by increases in information services and telecommunication
services of £0.6 billion and £0.2 billion respectively.
Figure 3.6: UK trade in maintenance and repair services, 2004 to 2014
Source: Office for National Statistics
Download chart
XLS format
(31.5 Kb)
The surplus on the maintenance and repair services balance widened by £1.2 billion, from a surplus
of £0.9 billion in 2013, to £2.1 billion in 2014. Maintenance and repair exports were £1.1 billion
higher than in 2013, at £2.4 billion. Imports decreased by £0.1 billion, from £0.5 billion in 2013 to
£0.4 billion in 2014.
Chapter 4: Primary income
The primary income account is made up of compensation of employees, investment income and
other primary income.
30. 30 October 2015
Office for National Statistics | 30
Figure 4.1: UK primary income, 2004 to 2014
Source: Office for National Statistics
Download chart
XLS format
(26.5 Kb)
The deficit on the primary income balance widened from £16.8 billion in 2013, to £33.1 billion in
2014. The widening was mainly due to the surplus on direct investment falling from £18.8 billion in
2013, to £2.0 billion in 2014.
Credits decreased by £7.6 billion, from total earnings of £152.1 billion in 2013, to £144.5 billion
in 2014. This was due to earnings on debt securities abroad falling by £3.6 billion, from £25.8
billion in 2013, to £22.2 billion in 2014. Also, earnings on direct investment and other investment
abroad both fell by £2.6 billion, from £75.3 billion and £25.6 billion in 2013 to £72.6 billion and £23.1
billion in 2014 respectively. Partially offsetting these was an increase in the earnings on equity and
investment funds shares abroad of £1.4 billion, from £21.1 billion in 2013 to £22.5 billion in 2014.
On a sector basis the fall was due to the earnings of UK monetary financial institutions falling by
£4.7 billion, from £37.3 billion in 2013 to £32.6 billion in 2014, and earnings of UK other sectors
falling by £2.7 billion, from £110.2 billion in 2013 to £107.5 billion in 2014.
31. 30 October 2015
Office for National Statistics | 31
Debits increased by £8.7 billion, from £168.9 billion in 2013 to £177.6 billion in 2014. This was
mainly due to foreign earnings on direct investment in the UK rising by £14.2 billion, from £56.5
billion in 2013 to £70.6 billion in 2014. Partially offsetting this were decreases in earnings on other
investment and earnings on equity and investment funds shares in the UK of £3.7 billion and £3.1
billion respectively in 2014.
On a sector basis the rise was due to foreign earnings on investment in the UK in other sectors
increasing by £14.9 billion, from £108.2 billion in 2013, to £123.1 billion in 2014. Partially offsetting
this were decreases in the earnings of foreign owned UK monetary financial institutions and
central government, from £40.3 billion and £16.0 billion in 2013, to £35.0 billion and £15.0 in 2014
respectively.
Compensation of employees
Compensation of employees presents remuneration in return for the labour input into the production
process contributed by an individual. In the international accounts, compensation of employees
is recorded when the employer (the producing unit) and the employee are resident in different
economies.
In 2014, the deficit on compensation of employees widened to £443 million, from £326 million in
2013. This was due to credits decreasing, while debits increased.
Investment income
Investment income covers earnings (for example, profits, dividends and interest payments and
receipts) coming from foreign investment in financial assets and liabilities. Credits are the earnings
of UK residents from their investments abroad and other foreign assets. Debits are the earnings of
foreign residents from their investments in the UK and other UK liabilities. The flow of investment
in the financial account is recorded separately from earnings, although reinvested earnings of
companies with foreign affiliates are a component of both. The total value of UK assets and liabilities
held at any time is also recorded separately under the International Investment Position.
Direct investment
32. 30 October 2015
Office for National Statistics | 32
Figure 4.2: UK direct investment income, 2004 to 2014
Source: Office for National Statistics
Download chart
XLS format
(31.5 Kb)
In 2014, the net earnings surplus on direct investment income decreased by £16.8 billion, from
£18.8 billion in 2013 to £2.0 billion in 2014. This was mainly due to net earnings surplus on equity
falling by £14.0 billion, from £19.4 billion in 2013 to £5.4 billion in 2014. In addition, there was a
widening in the deficit on other capital of £2.8 billion, from £0.6 billion in 2013 to £3.4 billion in 2014.
Earnings on direct investment abroad decreased by £2.6 billion, from £75.3 billion in 2013 to £72.6
billion in 2014. This was due to total earnings on equity decreasing by £3.6 billion, from £68.3 billion
in 2013 to £64.6 billion in 2014. The total earnings on equity of £64.6 billion was made up from total
dividends and distributed branch profits of £74.4 billion, and negative reinvested earnings of £9.7
billion. Negative reinvested earnings indicate a withdrawal of equity by a direct investor. This can be
due to the direct investment enterprise incurring a loss on its operations, or the declared dividends
are larger than net income in the period. Offsetting this was an increase of £1.0 billion in earnings on
other capital, from £7.0 billion in 2013 to £8.0 billion in 2014.
On a sector basis, the decrease was due to decreases in profits for most sectors, especially:
33. 30 October 2015
Office for National Statistics | 33
• foreign earnings of UK insurance companies decreased by £1.7 billion, from £4.2 billion in 2013
to £2.5 billion in 2014
• foreign earnings of UK other financial intermediaries by £1.0 billion, from £12.2 billion in 2013 to
£11.2 billion in 2014
Foreign earnings on direct investment in the UK increased by £14.2 billion, from £56.5 billion in
2013 to £70.6 billion in 2014. This was mainly due to total dividends and distributed branch profits
increasing by £10.3 billion, from £37.8 billion in 2013 to £48.0 billion in 2014. In addition, there was
an increase of £3.8 billion in earnings on other capital, from £7.6 billion in 2013 to £11.4 billion in
2014.
On a sector basis, the increase was due to higher profits with:
• foreign-owned UK private non-financial corporations increased by £16.7 billion, from £36.0 billion
in 2013 to £52.7 billion in 2014
• foreign-owned UK insurance companies increased by £1.4 billion, from £1.8 billion in 2013 to
£3.2 billion in 2014
Partially offsetting these were decreases in profits from:
• foreign-owned UK monetary financial institutions by £2.2 billion, from £8.1 billion in 2013 to £5.9
billion in 2014
• foreign-owned UK other financial intermediaries by £1.7 billion, from £10.4 billion in 2013 to £8.7
billion in 2014
Portfolio investment
34. 30 October 2015
Office for National Statistics | 34
Figure 4.3: UK portfolio investment income, 2004 to 2014
Source: Office for National Statistics
Download chart
XLS format
(31.5 Kb)
In 2014, the net earnings deficit on portfolio investment income recorded a small increase of £0.3
billion. This was due to the net earnings deficit on debt securities widening by £4.8 billion, from
£10.6 billion in 2013 to £15.4 billion in 2014. Offsetting this was a narrowing in the net earnings
deficit on equity and investment fund shares of £4.5 billion, from £12.0 billion in 2013 to £7.6 billion
in 2014.
UK earnings on portfolio investment abroad decreased by £2.2 billion, from £46.9 billion in 2013
to £44.7 billion in 2014. This was due to the UK earnings on foreign debt securities falling by £3.6
billion from £25.8 billion in 2013 to £22.2 billion in 2014. While the UK earnings on foreign equity and
investment fund shares rose by £1.4 billion, from £21.1 billion in 2013 to £22.5 billion in 2014.
Foreign earnings on portfolio investment in the UK decreased by £2.0 billion, from £69.6 billion in
2013 to £67.7 billion in 2014. The fall in the earnings was mainly due to foreign earnings on equity
and investment fund shares decreasing by £3.1 billion, from £33.1 billion in 2013 to £30.0 billion in
2014. Partially offsetting this was a rise in foreign earnings on UK debt securities of £1.1 billion, from
£36.5 billion in 2013 to £37.6 billion in 2014.
35. 30 October 2015
Office for National Statistics | 35
Other investment
Movements in the other investment balance are mainly due to interest rate changes, which impact
on interest paid and received on loans and deposits. As the UK has an excess of other investment
liabilities over assets, there is generally a deficit on other investment income, with rising interest
rates leading to a rising deficit and falling interest rates to a falling deficit.
Figure 4.4: UK other investment income, 2004 to 2014
Source: Office for National Statistics
Download chart
XLS format
(31.5 Kb)
The deficit on the other investment income balance narrowed from £12.8 billion in 2013, to £11.7
billion in 2014, as payments decreased more than receipts.
Receipts decreased by £2.6 billion, from £25.6 billion in 2013, to £23.1 billion in 2014. This was
mainly due to total earnings on deposits abroad decreasing by £2.4 billion, from £24.8 billion in 2013
to £22.4 billion in 2014.
Payments decreased by £3.7 billion, from £38.5 billion in 2013, to £34.8 billion in 2014. This was
due to total earnings on deposits decreasing by £2.9 billion, from £21.6 billion in 2013 to £18.8 billion
36. 30 October 2015
Office for National Statistics | 36
in 2014. Additionally, total earnings on loans decreased by £1.2 billion, from £14.7 billion in 2013 to
£13.5 billion in 2014.
On a sector basis, the narrowing of the deficit on the other investment income balance was mainly
due to the deficit on monetary financial institutions narrowing by £1.0 billion, from £4.1 billion in 2013
to £3.1 billion in 2014.
Other primary income
Other primary income covers earnings from rent and taxes, and subsidies on production and on
the import of goods. Under the Balance of Payments Manual fifth edition, taxes and subsidies on
production and on the import of goods were classified to secondary income (previously titled current
transfers). The recording of rent was previously classified to other investment income.
The deficit on other primary income widened in 2014 to £0.7 billion, from £0.5 billion in 2013.
Credits decreased by £0.1 billion, from receipts of £2.5 billion in 2013 to £2.3 billion in 2014.
This was due to other sectors subsidies on products and production: Agricultural guarantee
fund, decreasing from £2.5 billion in 2013 to £2.3 billion in 2014.
Debits were £3.0 billion in 2014, virtually unchanged from 2013.
Chapter 5: Secondary income
The secondary income account represents the provision (or receipt) of an economic value by one
party without directly receiving (or providing) a counterpart item of economic value. In plain terms
this is a transaction representing “something for nothing”. Transfers can be in the form of money or
of goods or services provided without the expectation of payment.
37. 30 October 2015
Office for National Statistics | 37
Figure 5.1: UK secondary income, 2004 to 2014
Source: Office for National Statistics
Download chart
XLS format
(26 Kb)
The deficit on the secondary income balance narrowed by £1.6 billion, from £26.8 billion in 2013 to
£25.2 billion in 2014. Credits increased by £0.2 billion, from £19.0 billion in 2013 to £19.2 billion in
2014. While debits decreased by £1.4 billion, from £45.8 billion in 2013 to £44.4 billion in 2014.
General government transfers
General government transfers include taxes and social contributions received from non-resident
workers and businesses; secondary income with international organisations (for example, EU
Institutions); bilateral aid; social security payments abroad; military grants; and miscellaneous
transfers.
38. 30 October 2015
Office for National Statistics | 38
Figure 5.2: UK transfers by general government, 2004 to 2014
Source: Office for National Statistics
Download chart
XLS format
(26 Kb)
The deficit on the general government transfers balance narrowed by £1.8 billion, from £22.7
billion in 2013, to £20.9 billion in 2014. This was mainly due to other secondary income recording a
decrease of £1.9 billion, from a deficit of £20.8 billion, to £18.9 billion in 2014.
In 2014, credits were £0.7 billion higher than in 2013, at £5.0 billion, with the increase mainly in
general government EU institutions: abatement of £0.7 billion.
In 2014, debits were £1.1 billion lower than in 2013, at £25.9 billion, with decreases mainly in
general government EU institutions GNI: own resource including VAT and general government
bilateral aid for technical cooperation of £1.4 billion and £0.8 billion respectively. Partially offsetting
this was an increase in general government EU institutions GNI: adjustments including VAT of £1.1
billion.
Other sector transfers
39. 30 October 2015
Office for National Statistics | 39
Non-government transfers include those EU transfers where the UK Government simply acts
as the agent for the final beneficiary (for example, social receipts). Other sectors’ transfers also
include taxes on income and wealth, paid by UK workers and outward direct investors, to foreign
governments; insurance premiums and claims; and other transfers (workers’ remittances, and other
private transfers such as gifts).
Figure 5.3: UK transfers by other sectors, 2004 to 2014
Source: Office for National Statistics
Download chart
XLS format
(26 Kb)
The deficit on the other sectors transfers balance widened by £0.2 billion, from £4.1 billion in 2013 to
£4.3 billion in 2014. This was mainly due to the deficit on other secondary income increasing by £0.2
billion, from £3.8 billion in 2013 to £4.0 billion in 2014.
In 2014, credits were £0.5 billion lower than in 2013, at £14.1 billion, with the decrease mainly in
non-life insurance claims of £0.3 billion.
In 2014, debits were £0.3 billion lower than in 2013, at £18.5 billion, with the main decrease in net
non-life insurance premiums of £0.3 billion.
40. 30 October 2015
Office for National Statistics | 40
Chapter 6: Capital account
The capital account includes capital transfers and the net acquisition or disposal of non-produced,
non-financial assets.
Figure 6.1: UK capital account, 2004 to 2014
Source: Office for National Statistics
Download chart
XLS format
(30.5 Kb)
The deficit on the capital account balance widened from £0.5 billion in 2013 to £0.8 billion in 2014.
The widening was due to the balance on non-produced, non-financial assets switching from a
surplus of £0.2 billion in 2013 to a deficit of £0.5 billion in 2014. Additionally, there was a slight
widening in the deficit on general government transfers of £0.1 billion in 2014. Partially offsetting
these was a widening in the other sectors transfers surplus of £0.5 billion from £0.9 billion in 2013 to
£1.4 billion in 2014.
41. 30 October 2015
Office for National Statistics | 41
Chapter 7: Financial account
The financial account covers transactions that result in a change of ownership of financial assets
and liabilities between UK residents and non-residents, for example, the acquisitions and disposals
of foreign shares by UK residents.
Figure 7.1: UK financial account, 2004 to 2014
Source: Office for National Statistics
Download chart
XLS format
(31.5 Kb)
In 2014, the UK recorded a net inflow of £89.4 billion, an increase from a net inflow of £69.1 billion
in 2013. The increase was due to a net increase in liabilities to non-residents of £158.8 billion, while
UK assets abroad only recorded a net increase of £69.4 billion. In 2013, the net inflow of £69.1
billion was due to net decrease of UK assets abroad of £214.5 billion, while UK liabilities to non-
residents recorded a net decrease of £145.4 billion.
Sectoral breakdown of the financial account
UK investment abroad
42. 30 October 2015
Office for National Statistics | 42
UK monetary financial institutions switched to be net investors in foreign assets during 2014 of £86.5
billion from net disinvestment in 2013 of £338.7 billion. Additionally, in 2014, central government
continued to be a net investor of £7.1 billion, primarily to acquire reserve assets. Partially offsetting
these were other sectors, who were net sellers of foreign assets of £24.6 billion in 2014, a switch
from net investors of £120.0 billion in 2013.
Investment in the UK
Non-residents invested £159.3 billion in UK other sectors in 2014, an increase from £113.1 billion in
2013. Additionally, non-residents invested £14.3 billion in 2014 in UK central government assets, a
decrease from £34.8 billion in 2013. Offsetting these, non-residents disposed of £15.2 billion assets
in UK monetary financial institutions, a decrease from disposing of £293.6 billion assets in 2013.
Direct investment
Figure 7.2: UK financial account: direct investment, 2004 to 2014
Source: Office for National Statistics
Download chart
XLS format
(31.5 Kb)
43. 30 October 2015
Office for National Statistics | 43
Direct investment recorded a net inflow of £81.6 billion in 2014, as non-residents continued to invest
in the UK, while UK residents disposed of more foreign assets than they bought.
UK direct investment abroad
In 2014, UK residents disposed of more foreign direct investment assets than they acquired,
recording a net disposal of assets of £53.4 billion, an increase from the net disposal of assets of
£19.0 billion in 2013.
The net disposal of assets was due to the net disposal of equity capital of £69.4 billion and negative
reinvestment of earnings of £9.7 billion, this is the first recording of negative reinvested earnings
since records began in 1987. Negative reinvested earnings indicate a withdrawal of equity by a
direct investor. This can be due to the direct investment enterprise incurring a loss on its operations
or the declared dividends are larger than net income in the period.
These were partially offset by net investment in debt instruments of £25.7 billion, the first net
investment in debt instruments since 2008.
Direct investment in the UK
Direct foreign investment in the UK increased from £23.4 billion in 2013, to £28.2 billion in 2014.
This can be broken down as follows:
• equity capital of £16.0 billion
• reinvested earnings of £11.2 billion
• debt instruments of £0.9 billion
Portfolio investment
44. 30 October 2015
Office for National Statistics | 44
Figure 7.3: UK financial account: portfolio investment, 2004 to 2014
Source: Office for National Statistics
Download chart
XLS format
(31.5 Kb)
Portfolio investment recorded net transactions that showed an increase in UK liabilities of £82.0
billion in 2014, while in 2013 UK liabilities increased £50.7 billion.
UK portfolio investment abroad
In 2014, UK residents were net investors in foreign debt securities of £34.9 billion, but recorded
net disinvestment in foreign equities and investment fund shares of £17.3 billion. These led to total
portfolio investment of £17.6 billion in 2014, a switch from net disinvestment of £5.7 billion in 2013.
The net disinvestment in 2013 was due to UK residents recording net disinvestment in equities and
investment fund shares of £22.8 billion, partially offset by net investment in foreign debt securities of
£17.1 billion.
Portfolio investment in the UK
In 2014, UK portfolio investment liabilities to non-residents increased by £99.6 billion, while in 2013
liabilities increased by £45.0 billion. Non-residents recorded net investment of £87.9 billion in debt
45. 30 October 2015
Office for National Statistics | 45
securities and £11.7 billion in UK equities and investment fund shares in 2014. This compares with
net investment of £14.8 billion in UK debt securities and £30.2 billion in UK equities and investment
fund shares in 2013.
Other investment
Figure 7.4: UK financial account: other investment, 2004 to 2014
Source: Office for National Statistics
Download chart
XLS format
(31.5 Kb)
The other investment functional category recorded a net increase in UK assets in 2014 of £81.0
billion, an increase from a net increase of £5.1 billion in 2013.
UK other investment abroad
In 2014, other investment abroad recorded net investment of £112.0 billion, a switch from net
disinvestment in 2013 of £208.7 billion. This was due to UK residents making net deposits of £70.8
billion, following net withdrawals of £193.6 billion in 2013. Additionally, there was net borrowing of
short-term loans of £42.3 billion by non-residents in 2014, following net repayments of £15.0 billion
in 2013.
46. 30 October 2015
Office for National Statistics | 46
Other investment in the UK
In 2014, non-residents switched to net investment of £31.0 billion following net disinvestment of
£213.8 billion in 2013. This was due to UK residents net borrowing of £34.5 billion of short-term
loans, a decrease from net borrowing of £61.4 billion in 2013. Partially offsetting this, non-residents
made net withdrawal of deposits of £8.0 billion in 2014, a decrease from net withdrawal of deposits
of £278.2 billion in 2013.
Chapter 8: International investment position
The International Investment Position (IIP) brings together the available estimates of the levels of:
• identified UK external assets (foreign assets owned by UK residents)
• identified UK external liabilities (UK assets owned by foreign residents)
These estimates are produced at the end of each calendar year. The IIP is the balance sheet of the
stock of these external assets and liabilities.
Figure 8.1: UK international investment position, 2004 to 2014
Source: Office for National Statistics
47. 30 October 2015
Office for National Statistics | 47
Download chart
XLS format
(31.5 Kb)
The UK IIP showed a net liability position of £454.1 billion at the end of 2014, an increase from a net
liability position of £244.0 billion at the end of 2013. The increase in the net liability position was due
to liabilities increasing more than assets.
UK assets
Figure 8.2: UK assets, 2004 to 2014
Source: Office for National Statistics
Download chart
XLS format
(26.5 Kb)
From the end of 2013, total UK assets overseas increased by £487.4 billion to record a level of
£10,171.7 billion at the end of 2014. Part of the increase was due to UK residents net investment in
foreign assets (£69.4 billion) over 2014 with the remainder due to changes in financial derivatives,
currency movements, valuation changes and other changes (chapter 7, Financial Account, contains
more information on financial transactions).
UK liabilities
48. 30 October 2015
Office for National Statistics | 48
Figure 8.3: UK liabilities, 2004 to 2014
Source: Office for National Statistics
Download chart
XLS format
(31.5 Kb)
Total UK liabilities increased by £697.5 billion from the end of 2013 to reach a level of £10,625.9
billion at the end of 2014. Part of the increase was due to non-residents net investment in the
UK (£158.8 billion) over 2014, with the remainder being a combination of changes in financial
derivatives, currency movements (although to a lesser extent than UK assets abroad, which are
mostly denominated in foreign currency), valuation changes and other changes (chapter 7, Financial
Account, contains more information on financial transactions).
Sectoral breakdown of the financial account
UK assets
With the exception of UK public corporations, each UK sector recorded an increase in their foreign
assets at the end of 2014. UK monetary financial institutions recorded foreign assets of £5,093.0
billion at the end of 2014, an increase from £4,733.8 billion at the end of 2013. Other UK sectors
recorded foreign assets of £4,989.6 billion at the end of 2014, compared with £4,868.0 billion at the
end of 2013.
49. 30 October 2015
Office for National Statistics | 49
UK liabilities
Similarly, with the exception of UK public corporations, each UK sector recorded increased liabilities
at the end of 2014 when compared with the end of 2013. Other UK sectors recorded an increase
in their liabilities from £4,596.9 billion at the end of 2013, to £5,023.7 billion at the end of 2014. UK
monetary financial institutions liabilities to non-residents increased from £4,865.3 billion at the end of
2013 to £5,130.8 at the end of 2014.
Direct investment
Figure 8.4: UK direct investment, 2004 to 2014
Source: Office for National Statistics
Download chart
XLS format
(31 Kb)
Net direct investment
At the end of 2014, direct investment showed a net liability position of £148.0 billion, the first net
liability position on direct investment since records began in 1987, compared with a net asset
position of £54.6 billion at the end of 2013.
50. 30 October 2015
Office for National Statistics | 50
UK direct investment assets
Direct investment assets decreased by £40.5 billion from the end of 2013 to £1,227.0 billion at the
end of 2014. The decrease was mainly due to net disinvestment by UK residents (net selling of
£53.4 billion in 2014), partially offset by increases in valuations and currency movements. By type of
asset, the majority of the decrease was in holdings of equity and to a lesser extent a small decrease
in holdings of debt instruments.
UK direct investment liabilities
Direct investment liabilities increased by £162.1 billion from the end of 2013 to £1,375.0 billion at the
end of 2014. The increase was partially due to net investment by non-residents (net buying of £28.2
billion in 2014), but mostly due to valuation changes. By type of liability, the majority of the increase
was in holdings of equity with only a small increase in holdings of debt instruments.
Portfolio investment
Figure 8.5: UK portfolio investment flows, 2004 to 2014
Source: Office for National Statistics
Download chart
XLS format
(31 Kb)
51. 30 October 2015
Office for National Statistics | 51
Net portfolio investment
At the end of 2014, portfolio investment recorded a net liability position of £109.2 billion, an increase
from the net liability position of £36.1 billion at the end of 2013. This reflected an increase in the
net liability position on debt securities and a decrease in the net asset position on equities and
investment fund shares. Both asset and liabilities recorded increases but liabilities recorded a
greater increase.
UK portfolio investment assets
UK portfolio investment assets increased by £66.4 billion from the end of 2013, to £2,510.1 billion at
the end of 2014. The increase was mainly due to a £59.8 billion increase in the level of foreign debt
securities to £1,390.2 billion at the end of 2014, as UK residents continued to invest in foreign debt
securities (net investment of £34.9 billion). Despite UK residents decreasing their holdings of foreign
equities (net disinvestment of £17.3 billion), increases in stock markets led to a £6.6 billion increase
in the holdings of equity and investment fund shares, to £1,119.9 billion at the end of 2014.
UK portfolio investment liabilities
Total portfolio investment liabilities increased by £139.6 billion to £2619.2 billion at the end of
2014, as non-residents continued to acquire UK assets. Non-residents held £1,615.4 billion in debt
securities at the end of 2014, an increase of £112.9 billion from the end of 2013. This increase was
mostly due to non-residents continuing to acquire UK issued debt securities, (net investment of
£87.9 billion). Non-residents holding of UK equities and investment fund shares increased by £26.6
billion from the end of 2013 to £1,003.8 billion at the end of 2014. The increase was partly due to
non-residents continuing to invest in UK equities (net investment of £11.7 billion).
Other investment
52. 30 October 2015
Office for National Statistics | 52
Figure 8.6: UK other investment, 2004 to 2014
Source: Office for National Statistics
Download chart
XLS format
(31 Kb)
Net other investment
At the end of 2014, other investment recorded a net liability position of £286.8 billion, a decrease
from a net liability position of £371.6 billion at the end of 2013. The decrease was due to overseas
UK assets increasing while UK liabilities decreased slightly.
UK other investment assets
UK other investment assets increased by £50.9 billion from the end of 2013 to a level of £3,538.4
billion at the end of 2014. The increase was due to UK residents increasing deposits abroad and an
increase in short-term loans to non-residents. These were partially offset by a decrease in the level
of long-term loans to non-residents.
UK other investment liabilities
53. 30 October 2015
Office for National Statistics | 53
UK other investment liabilities decreased by £33.9 billion to £3,825.2 billion at the end of 2014. The
decrease was due to non-residents net withdrawal of deposit and a decrease in the level of long-
term loans to UK residents. These were partially offset by an increase in the level of short-term loans
to UK residents.
Chapter 9: Geographical breakdown of the current account
The tables in this chapter show a geographical breakdown of the current account. The data cover 67
individual countries as well as international organisations. These estimates are generally less firmly
based than the world totals, and data for earlier years are less reliable than recent figures. In some
cases estimates are unavailable for the first few years.
Changes to the pattern of trading associated with missing trader intra-community (MTIC) fraud can
make it difficult to analyse trade by country, as changes in the impact of activity associated with
this fraud (which includes carousel fraud) affect both imports and exports. Originally, most carousel
chains only involved European Union (EU) member states. From 2004 in particular, some carousel
chains included non-EU countries, for example Switzerland. However, the MTIC trade adjustments
are added to the EU import estimates as it is this part of the chain that is not generally recorded. For
more information on carousel fraud, see the methodological notes relating to chapter 2.
Figure 9.1: UK current account by region, 2004 to 2014
Source: Office for National Statistics
54. 30 October 2015
Office for National Statistics | 54
Notes:
1. Users should be aware that for presentational purposes the figure displays liabilities as a negative value, unlike the
reference tables which display liabilities as a positive value.
2. Click on image to view an enlarged version.
Download chart
XLS format
(31.5 Kb)
In 2014 the current account deficit widened by £15.0 billion, from £77.9 billion in 2013 to £92.9
billion. This was due to the surplus with the Americas narrowing in 2014 to £28.4 billion from £39.2
billion in 2013. Additionally, the deficit with Europe widened from £101.6 billion in 2013 to £109.5
billion in 2014.
Figure 9.2: UK current account credits by region, 2004 to 2014
Source: Office for National Statistics
Notes:
1. Click on image to view an enlarged version.
Download chart
XLS format
(28.5 Kb)
55. 30 October 2015
Office for National Statistics | 55
Credits decreased by £13.3 billion, from £692.1 billion in 2013 to £678.8 billion in 2014. This was
mainly due to credits decreasing from the Americas and Africa by £8.4 billion and £3.2 billion
respectively.
Figure 9.3: UK current account debits by region, 2004 to 2014
Source: Office for National Statistics
Notes:
1. Click on image to view an enlarged version.
Download chart
XLS format
(28.5 Kb)
Debits increased by £1.7 billion, from £770.0 billion in 2013 to £771.7 billion in 2014. This was due
to debits to Europe increasing by £8.4 billion, partially offset by debits to Africa and Australasia and
Oceania decreasing by £5.1 billion and £1.9 billion respectively.
56. 30 October 2015
Office for National Statistics | 56
Figure 9.4: UK current account trade in goods by region, 2004 to 2014
Source: Office for National Statistics
Notes:
1. Users should be aware that for presentational purposes the figure displays liabilities as a negative value, unlike the
reference tables which display liabilities as a positive value.
2. Click on image to view an enlarged version.
Download chart
XLS format
(32 Kb)
The deficit on the trade in goods balance widened by £8.4 billion, from £115.2 billion in 2013 to
£123.7 billion in 2014. This was due to the deficit with Europe increasing by £10.9 billion, from £86.4
billion in 2013, to £97.3 billion in 2014. Additionally, the surplus with the Americas decreased by £7.4
billion, from £11.3 billion in 2013, to £3.9 billion in 2014. Partially offsetting these were decreases in
the deficits with Asia and Africa of £6.8 billion and £3.0 billion, from £33.7 billion and £8.2 billion in
2013 to £26.9 billion and £5.1 billion in 2014 respectively.
Exports decreased by £10.8 billion, from £306.2 billion in 2013 to £295.4 billion in 2014. This was
mainly due to exports decreasing to the Americas, Europe and Africa by £5.4 billion, £4.1 billion and
£1.6 billion respectively. Partially offsetting these was an increase of £1.1 billion in the exports to
Asia.
57. 30 October 2015
Office for National Statistics | 57
Imports decreased by £2.4 billion, from £421.5 billion in 2013 to £419.1 billion in 2014. This was
due to imports decreasing to Asia and Africa by £5.8 billion and £4.7 billion respectively. Partially
offsetting these was an increase of £6.8 billion and £2.0 billion in the imports to Europe and the
Americas respectively.
Figure 9.5: UK current account trade in services by region, 2004 to 2014
Source: Office for National Statistics
Notes:
1. Users should be aware that for presentational purposes the figure displays liabilities as a negative value, unlike the
reference tables which display liabilities as a positive value.
2. Click on image to view an enlarged version.
Download chart
XLS format
(32 Kb)
The surplus on the trade in services balance widened by £8.1 billion, from £81.0 billion in 2013 to
£89.1 billion in 2014. This was mainly due to the surplus with Europe increasing by £12.5 billion,
from £22.6 billion in 2013 to £35.1 billion in 2014. Partially offsetting this was a decrease in the
surplus with Americas of £3.4 billion, from £36.5 billion in 2013 to £33.1 billion in 2014.
58. 30 October 2015
Office for National Statistics | 58
Exports increased by £4.9 billion, from £214.8 billion in 2013 to £219.8 billion in 2014. This was
mainly due to exports increasing to Europe by £11.3 billion. Partially offsetting this were decreases
of £3.7 billion and £1.7 billion with exports to the Americas and Australasia and Oceania.
Imports decreased by £3.2 billion, from £133.8 billion in 2013 to £130.6 billion in 2014. This was due
to imports decreasing by £1.2 billion from both Europe and Asia.
Figure 9.6: UK current account primary income by region, 2004 to 2014
Source: Office for National Statistics
Notes:
1. Users should be aware that for presentational purposes the figure displays liabilities as a negative value, unlike the
reference tables which display liabilities as a positive value.
2. Click on image to view an enlarged version.
Download chart
XLS format
(32 Kb)
The deficit on the primary income balance widened by £16.3 billion, from £16.8 billion in 2013 to
£33.1 billion in 2014. This was due to the deficit with Europe increasing by £11.4 billion, from £24.3
billion to £35.7 billion and the surplus with Asia narrowing by £4.5 billion, from £9.6 billion in 2013 to
£5.0 billion in 2014.
59. 30 October 2015
Office for National Statistics | 59
Credits decreased by £7.6 billion, from £152.1 billion in 2013 to £144.5 billion in 2014. This was
mainly due to credits decreasing from Europe by £7.3 billion, from £69.1 billion in 2013 to £61.9
billion in 2014.
Debits increased by £8.7 billion, from £168.9 billion in 2013 to £177.6 billion in 2014. This was due
to debits to Asia and Europe increasing by £5.1 billion and £4.2 billion respectively. Slightly offsetting
these, debits to Australasia and Oceania decreased by £1.0 billion, from £2.2 billion in 2013 to £1.3
billion in 2014.
Figure 9.7: UK current account secondary income by region, 2004 to 2014
Source: Office for National Statistics
Notes:
1. Users should be aware that for presentational purposes the figure displays liabilities as a negative value, unlike the
reference tables which display liabilities as a positive value.
2. Click on image to view an enlarged version.
Download chart
XLS format
(32 Kb)
60. 30 October 2015
Office for National Statistics | 60
The deficit on the secondary income balance narrowed by £1.6 billion, from £26.8 billion in 2013 to
£25.2 billion in 2014. This was due to the deficit with Europe decreasing by £1.9 billion, from £13.6
billion to £11.6 billion in 2014.
Credits increased by £0.2 billion, from £19.0 billion in 2013 to £19.2 billion in 2014. This was due to
credits increasing from Europe by £0.5 billion, from £8.5 billion in 2013 to £9.0 billion in 2014. This
was offset by credits from the Americas decreasing by £0.3 billion, from £6.5 billion in 2013 to £6.2
billion in 2014.
Debits decreased by £1.4 billion, from £45.8 billion in 2013 to £44.4 billion in 2014. This was due to
debits to Europe decreasing by £1.4 billion, from £22.1 billion in 2013 to £20.7 billion in 2014.
Figure 9.8: UK current account with the EU28, 2004 to 2014
Source: Office for National Statistics
Notes:
1. Users should be aware that for presentational purposes the figure displays liabilities as a negative value, unlike the
reference tables which display liabilities as a positive value.
2. Click on image to view an enlarged version.
Download chart
XLS format
(29 Kb)
The current account deficit with the EU28 widened by £17.9 billion, from £89.1 billion in 2013 to
£107.0 billion in 2014. This was due to the deficits with France, Germany and Belgium widening in
2014, and the surplus with Luxembourg switching to a deficit in 2014.
61. 30 October 2015
Office for National Statistics | 61
Credits decreased by £8.1 billion, from £297.1 billion in 2013 to £289.0 billion in 2014. This was due
to a decrease in credits from:
• France by £4.1 billion
• the Netherlands by £3.5 billion
• Germany by £2.1 billion
• Luxembourg by £1.4 billion
Partially offsetting these were an increase in credits from:
• Italy by £2.0 billion
Debits increased by £9.7 billion, from £386.3 billion in 2013 to £396.0 billion in 2014. This was due
to debits increasing to:
• Spain by £4.0 billion
• Germany by £3.4 billion
• Luxembourg by £2.8 billion
• Italy by £1.7 billion
Partially offsetting these, debits decreased to:
• the Netherlands by £4.1 billion
• Denmark by £1.0 billion
Figure 9.9: UK trade in goods account with the EU28, 2004 to 2014
Source: Office for National Statistics
62. 30 October 2015
Office for National Statistics | 62
Notes:
1. Users should be aware that for presentational purposes the figure displays liabilities as a negative value, unlike the
reference tables which display liabilities as a positive value.
2. Click on image to view an enlarged version.
Download chart
XLS format
(29.5 Kb)
The trade in goods deficit with the EU28 widened by £11.7 billion, from £67.1 billion in 2013 to £78.9
billion in 2014. This was due to widening deficits with most countries, most notably with Spain (by
£3.1 billion), France (by £2.8 billion), Belgium (by £2.7 billion) and Germany (by £2.6 billion). These
compare with a slight narrowing to the deficit with Denmark of £1.3 billion in 2014.
Exports decreased by £6.5 billion, from £154.1 billion in 2013 to £147.6 billion in 2014. This was
mainly due to exports decreasing to:
• the Netherlands by £2.9 billion
• France by £2.2 billion
• Belgium by £1.5 billion
Imports increased by £5.2 billion, from £221.2 billion in 2013 to £226.5 billion in 2014. This was due
to imports increasing from:
• Spain by £3.4 billion
• Germany by £3.2 billion
• Italy by £1.5 billion
• Belgium by £1.2 billion
Partially offsetting these were decreases in imports from:
• the Netherlands by £3.5 billion
• Denmark by £1.3 billion
63. 30 October 2015
Office for National Statistics | 63
Figure 9.10: UK trade in services account with the EU28, 2004 to 2014
Source: Office for National Statistics
Notes:
1. Users should be aware that for presentational purposes the figure displays liabilities as a negative value, unlike the
reference tables which display liabilities as a positive value.
2. Click on image to view an enlarged version.
Download chart
XLS format
(29.5 Kb)
The trade in services surplus with the EU28 widened by £5.5 billion, from £11.6 billion in 2013 to
£17.1 billion in 2014. This was mainly due to the surpluses with the Netherlands, Ireland and Italy
increasing by £3.0 billion, £0.8 billion and £0.8 billion in 2014 respectively.
Exports increased by £4.5 billion, from £76.8 billion in 2013 to £81.3 billion in 2014. This was mainly
due to exports increasing to:
• Italy by £1.3 billion
• the Netherlands by £0.8 billion
• Ireland by £0.8 billion
• Spain by £0.7 billion
Imports decreased by £1.1 billion, from £65.2 billion in 2013 to £64.2 billion in 2014. This was mainly
due to imports from the Netherlands decreasing by £2.1 billion, from £6.5 billion in 2013 to £4.3
billion in 2014. Partially offsetting this was an increase of £0.6 billion in the imports from Italy.
64. 30 October 2015
Office for National Statistics | 64
Figure 9.11: UK primary income account with the EU28, 2004 to 2014
Source: Office for National Statistics
Notes:
1. Users should be aware that for presentational purposes the figure displays liabilities as a negative value, unlike the
reference tables which display liabilities as a positive value.
2. Click on image to view an enlarged version.
Download chart
XLS format
(29.5 Kb)
The deficit on the primary income balance with the EU28 widened by £13.6 billion, from £20.6 billion
in 2013 to £34.2 billion in 2014. This was mainly due to the deficit increasing with Luxembourg
(by £3.9 billion), Ireland (by £3.0 billion), France (by £2.7 billion) and Germany (by £2.3 billion).
Additionally, the Netherlands switched from a surplus of £0.7 billion in 2013 to a deficit of £2.2 billion
in 2014.
Credits decreased by £6.6 billion, from £58.6 billion in 2013 to £51.9 billion in 2014. This was due to
credits decreasing from:
• Germany by £2.0 billion
• France by £2.0 billion
• the Netherlands by £1.4 billion
• Luxembourg by £1.3 billion
Debits increased by £7.0 billion, from £79.2 billion in 2013 to £86.2 billion in 2014. This was due to
debits increasing to:
65. 30 October 2015
Office for National Statistics | 65
• Luxembourg by £2.6 billion
• Ireland by £2.1 billion
• the Netherlands by £1.6 billion
• France by £0.7 billion
Figure 9.12: UK secondary income account with the EU28, 2004 to 2014
Source: Office for National Statistics
Notes:
1. Users should be aware that for presentational purposes the figure displays liabilities as a negative value, unlike the
reference tables which display liabilities as a positive value.
2. Click on image to view an enlarged version.
Download chart
XLS format
(29.5 Kb)
The deficit on the secondary income balance with the EU28 narrowed by £2.0 billion, from £13.0
billion in 2013 to £11.0 billion in 2014. This was due to the deficit with EU institutions decreasing by
£2.1 billion, from £12.0 billion in 2013 to £9.8 billion in 2014.
Credits increased by £0.5 billion, from £7.6 billion in 2013 to £8.2 billion in 2014. This was due to
credits from EU institutions increasing by £0.7 billion, from £3.9 billion in 2013 to £4.6 billion in 2014.
Partially offsetting this were small decreases in credits from most countries.
Debits decreased by £1.5 billion, from £20.7 billion in 2013 to £19.2 billion in 2014. This was due to
debits to EU institutions decreasing by £1.4 billion, from £15.9 billion in 2013 to £14.5 billion in 2014.
66. 30 October 2015
Office for National Statistics | 66
Chapter 10: Geographical breakdown of the UK international investment
position
The latest available geographical breakdown of the UK’s international investment position (IIP) is
for the end of 2013. The geographical breakdown of IIP lags behind that of the current account,
as much of the data comes from annual surveys which are not available until 12 months after the
reference year.
Direct investment geographical breakdown levels are derived from annual surveys to outward and
inward direct investors in the UK. Portfolio investment contains equity and investment fund shares
and debt securities which can be short-term (money market instruments) and long-term (in the form
of bonds and notes).
Other investment data are sourced as follows:
• geographical breakdowns of UK banks’ deposits abroad and loans made abroad are derived
from banking data supplied by the Bank of England – this information is also used to apportion
securities dealers’ deposits abroad
• country breakdowns of UK private sector (excluding banks and securities dealers) deposits with
banks abroad are derived from the banking statistics of countries in the Bank for International
Settlements (BIS) reporting area
• geographical breakdowns of foreign deposits with UK banks are derived from banking data, with
foreign loans made to securities dealers apportioned in the same way
• country breakdowns of UK private sector (excluding banks and securities dealers) loans from
abroad are derived from the banking statistics of countries in the BIS reporting area
67. 30 October 2015
Office for National Statistics | 67
Figure 10.1: UK international investment position, assets, liabilities and balance, 2004 to 2013
Source: Office for National Statistics
Notes:
1. Users should be aware that for presentational purposes the figure displays liabilities as a negative value, unlike the
reference tables which display liabilities as a positive value.
2. Click on image to view an enlarged version.
Download chart
XLS format
(31 Kb)
At the end of 2013, the UK’s IIP showed a net liability position of £244.0 billion, with reported assets
totalling £9,684.3 billion and reported liabilities totalling £9,928.3 billion.
68. 30 October 2015
Office for National Statistics | 68
Figure 10.2: UK international investment position assets, 2004 to 2013
Source: Office for National Statistics
Notes:
1. Click on image to view an enlarged version.
Download chart
XLS format
(29 Kb)
Of the total foreign assets held by UK residents at the end of 2013, there was:
• £4,640.6 billion invested in Europe, which represented 48% of the UK’s total investment holdings
abroad
• £3,277.7 billion invested in the Americas, which represented 34% of the UK’s total investment
holdings abroad – most of the investment in the Americas were held in the USA, which at
£2,637.6 billion was a decrease of £215.2 billion on the previous year
• £1,240.9 billion invested in Asia which represented 13% of the UK’s total investment holdings
abroad – Japan, the UK’s main investment partner in this region, at £562.6 billion, represented
6% of total UK assets
• £355.8 billion invested in Australasia and Oceania, Africa and International Organisations, which
collectively represented 4% of the UK’s total investment holdings abroad
69. 30 October 2015
Office for National Statistics | 69
Figure 10.3: UK international investment position liabilities, 2004 to 2013
Source: Office for National Statistics
Notes:
1. Click on image to view an enlarged version.
Download chart
XLS format
(29.5 Kb)
At the end of 2013, of the total UK liabilities to the rest of the world, there was:
• £4,975.5 billion invested by Europe, with the EU28 accounting for £4,061.9 billion of Europe’s
total investment
• £3,637.4 billion invested by the Americas, which represented 37% of the total UK liabilities –
while the USA alone accounted for £3,173.4 billion, that is 32% of the total liabilities of the UK
• £973.0 billion invested by Asia, which represented 10% of the total UK liabilities
• £342.5 billion invested by Australasia and Oceania, Africa and International Organisations which
collectively represented 3% of the total UK liabilities
70. 30 October 2015
Office for National Statistics | 70
Figure 10.4: UK international investment position, direct investment position, 2004 to 2013
Source: Office for National Statistics
Notes:
1. Users should be aware that for presentational purposes the figure displays liabilities as a negative value, unlike the
reference tables which display liabilities as a positive value.
2. Click on image to view an enlarged version.
Download chart
XLS format
(31.5 Kb)
UK direct investment abroad at £1,267.5 billion contributed 13% to the stock of UK assets abroad at
the end of 2013. Of total direct investment assets held by UK residents, there was:
• £654.7 billion invested in Europe, which represented 52% of the UK’s total direct investment
holdings abroad
• £370.5 billion invested in the Americas, which represented 29% of the UK’s total direct
investment holdings abroad, with most of the investment in the Americas being held in the USA
at £270.5 billion
• £142.3 billion invested in Asia, which represented 11% of the UK’s total direct investment
holdings abroad
71. 30 October 2015
Office for National Statistics | 71
• £57.0 billion invested in Australasia and Oceania, which represented 4% of the UK’s total direct
investment holdings abroad
• £43.0 billion invested in Africa, which represented 3% of the UK’s total direct investment holdings
abroad
Direct investment in the UK equalled 12% of the total level of UK liabilities to the rest of the world in
2013 at £1,212.9 billion. Of total direct investment in the UK, there was:
• £711.3 billion invested by Europe, with the EU28 accounting for £584.0 billion of Europe’s total
direct investment
• £386.0 billion invested by the Americas, which represented 32% of total UK liabilities – while the
USA alone accounted for £309.1 billion, that is 25% of total direct investment into the UK
• £91.4 billion invested by Asia, which represented 8% of total UK direct investment liabilities
• £14.4 billion invested by Australasia and Oceania and £9.8 billion invested from Africa, which
represented 1% each of total UK direct investment liabilities
Figure 10.5: UK international investment position, portfolio investment position, 2004 to 2013
Source: Office for National Statistics
Notes:
1. Users should be aware that for presentational purposes the figure displays liabilities as a negative value, unlike the
reference tables which display liabilities as a positive value.
2. Click on image to view an enlarged version.
72. 30 October 2015
Office for National Statistics | 72
Download chart
XLS format
(31.5 Kb)
UK portfolio investment assets abroad at the end of 2013 stood at £2,443.6 billion, which
represented 25% of total UK assets abroad. Of total portfolio investment assets held by UK
residents, there was:
• £1,154.0 billion invested in Europe, which represented 47% of the UK’s total portfolio investment
holdings abroad
• £761.6 billion invested in the Americas, which represented 31% of the UK’s total portfolio
investment holdings abroad, with most of the investment in the Americas being held in the USA
at £588.3 billion
• £328.0 billion invested in Asia, which represented 13% of the UK’s total portfolio investment
holdings abroad
• £55.8 billion invested in Australasia and Oceania, which represented 2% of the UK’s total
portfolio investment holdings abroad
• £20.1 billion invested in International Organisations and £16.0 billion invested in Africa, which
represented 1% each of the UK’s total portfolio investment holdings abroad
Portfolio investment liabilities are derived from the Co-ordinated Portfolio Investment Survey (CPIS)
returns of other countries reporting assets held in the UK, and were £2,479.7 billion at the end of
2013. Of the UK’s total portfolio investment liabilities, there was:
• £1,095.8 billion invested by Europe and £1,082.2 billion invested by the Americas, which
represented 44% each of total UK portfolio investment liabilities
• £193.4 billion invested by Asia, which represented 8% each of total UK portfolio investment
liabilities
• £47.9 billion invested by International Organisations, which represented 2% each of total UK
portfolio investment liabilities
• £31.2 billion invested by Africa and £29.2 billion invested from Australasia and Oceania, which
represented 1% each of total UK portfolio investment liabilities
73. 30 October 2015
Office for National Statistics | 73
Figure 10.6: UK international investment position, other investment position, 2004 to 2013
Source: Office for National Statistics
Notes:
1. Users should be aware that for presentational purposes the figure displays liabilities as a negative value, unlike the
reference tables which display liabilities as a positive value.
2. Click on image to view an enlarged version.
Download chart
XLS format
(31.5 Kb)
The UK’s other investment assets abroad totalled £3,487.5 billion at the end of 2013, which was
36% of total UK assets. Of total other investment assets held by UK residents, there was:
• £1,646.0 billion invested in Europe, which represented 47% of the UK’s total other investment
holdings abroad
• £1,146.2 billion invested in the Americas, which represented 33% of the UK’s total other
investment holdings abroad, with most of the investment in the Americas being held in the USA
at £884.6 billion
• £600.7 billion invested in Asia, which represented 17% of the UK’s total other investment
holdings abroad
74. 30 October 2015
Office for National Statistics | 74
• £55.7 billion invested in Australasia and Oceania, which represented 2% of the UK’s total other
investment holdings abroad
• £32.9 billion invested in Africa, which represented 1% of the UK’s total other investment holdings
abroad
UK other investment liabilities totalled £3,859.0 billion at the end of 2013, which was 39% of total UK
liabilities. Of the UK’s total other investment liabilities, there was:
• £2,050.0 billion invested by Europe, which represented 53% of total UK other investment
liabilities
• £1,137.1 billion invested by Americas, which represented 29% of total UK other investment
liabilities – while the USA alone accounted for £905.0 billion, that is 23% of total other investment
into the UK
• £538.2 billion invested by Asia, which represented 14% of total UK other investment liabilities
• £68.6 billion invested by Africa, which represented 2% of total UK other investment liabilities
• £57.5 billion invested by Australasia and Oceania, which represented 1% of total UK other
investment liabilities
List of contributors
Authors, editor and production team:
Abbe Williams
Andrew Banks
Andrew Agyiri Amankwah
Claire Chetnik
Craig Taylor
Ewelina Thomas
Henry Brown
Jeena O’Neill
Katherine Kent
Melanie Edwards
Niall Coles
Parsa Mohammadpour
Penil Chhiba
Phil Lewin
Rhiain Hewinson
Richard McCrae
Juliet Brooker
75. 30 October 2015
Office for National Statistics | 75
Simon Eddolls
Victoria Wightman
Contacts
For information about specific areas of this publication please contact the following:
Chapters 2, 3, 5 and 6: Katherine Kent +44 (0)1633 455829 (katherine.kent@ons.gsi.gov.uk)
Chapters 1, 4, 7, 8, 9 and 10: Craig Taylor +44 (0)1633 456333 (craig.taylor@ons.gsi.gov.uk)
Other Customer Enquiries: ONS Customer Contact Centre +44 (0)845 601 3034
(info@statistics.gsi.gov.uk)
Media Enquiries: +44 (0)845 604 1858 (press.office@ons.gsi.gov.uk)
Background notes
1. What’s new
Data in the Pink Book 2015 are consistent with the Balance of Payments Quarter 2 (April to
June) 2015 statistical bulletin, published on 30 September 2015.
An article, Impact of changes to the Balance of Payments and International Investment Position,
1997 to 2014 (257.9 Kb Pdf), was also published on 30 September. The article provided an
assessment of the impact the methodological and classification changes had on annual data
for the period 1997 to 2014. Further to the revisions published for the periods 1997 to 2014,
the methodology and classifications changes have been extended back to 1987 within the Pink
Book 2015 and the statistical bulletin datasets.
2. Reliability of estimates
All the value estimates are calculated as accurately as possible; however they cannot always
be regarded as being absolutely precise to the last digit shown. Similarly, the index numbers are
not necessarily absolutely precise to the last digit shown. Some figures are provisional and may
be revised later; this applies particularly to many of the detailed figures for the latest years. For
example, calendar year date for the International Trade in Services Survey and Foreign Direct
Investment Survey are not available until after the publication of the Pink Book. Therefore, the
latest Trade in Services and Direct Investment data published in the Pink Book are provisional
estimates and subject to annual benchmarking after publication.
The latest data when available for the International Trade in Services Survey can be found on
our website.
The latest data when available for the Foreign Direct Investment Survey can be found on our
website.
76. 30 October 2015
Office for National Statistics | 76
3. Rounding
As figures have been rounded to the nearest final digit, there may be slight discrepancies
between the sums of the constituent items and the totals as shown.
4. Revisions since the Pink Book 2014
The data in the Pink Book are subject to revisions following the ONS National Accounts
Revisions Policy (41.6 Kb Pdf). Data in this release have been revised from 1987 onwards.
A detailed assessment of changes to the Balance of Payments and International Investment
Position (257.9 Kb Pdf) annually for 1997 to 2014 can be found in the article published on 30
September 2015. In addition to changes highlighted in the article, revisions are also due to:
Trade in goods – Revisions from 2012 reflect revised data from HM Revenue & Customs and
other data suppliers, revised estimates of trading associated with VAT Missing Trader Intra-
Community (MTIC) fraud, revised survey data on trade prices and a reassessment of seasonal
factors. Further information on trade is available in the UK Trade August 2015 statistical bulletin.
Trade in services – Revisions from 2012 are due to updated transport survey information and
administrative sources and a reassessment of seasonal factors.
Secondary income account – Revisions to the secondary income account are due to revised
source data for transfers involving the UK government, the use of the latest data for various
ONS surveys and a reassessment of seasonal factors.
Capital account – Revisions to the capital account are attributable to revised source data from
HM Treasury and the ONS International Trade in Services survey.
Primary income, financial account and international investment position – Revisions from
2012 reflect new and revised survey data, a reassessment of coverage adjustments to data from
the Bank for International Settlements and a reassessment of seasonal factors. Revisions also
reflect new estimates from the Bank for International Settlements.
5. Symbols
The following symbols are used throughout:
.. = not available
- = nil or less than a million
6. Understanding the data
A brief introduction to the United Kingdom balance of payments (92.1 Kb Pdf) provides an
overview of the concepts and coverage of the UK Balance of Payments.
A glossary of terms used in the UK balance of payments is available on our website.