Recommended

Recommended
More Related Content
What's hot
What's hot (19)
Similar to Methylation Subtypes of EAC/BE
Similar to Methylation Subtypes of EAC/BE (20)
Recently uploaded
Recently uploaded (20)
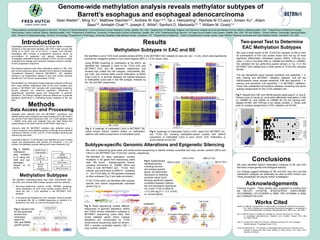
Methylation Subtypes of EAC/BE
- 1. Esophageal adenocarcinoma (EAC) has shown rapidly increased incidence in the past three decades, with 15% 5-year survival rate (Thrift et al 2012, Hur et al 2013). It arises from Barrett’s Esophagus (BE) through a progression sequence driven by accumulation of epigenetic and genetic alterations. We investigated methylation-based subtypes of EAC and BE to better understand the etiology and molecular changes involved in the BE- to-EAC progression sequence. We analyzed genome-wide DNA methylation patterns in BE, EAC and normal squamous tissue collected via the Barrett’s Esophagus Translational Research Network (BETRNET). We validated findings in an independent dataset of EAC and normal matched tissues from The Cancer Genome Atlas (TCGA). We identified four methylation-based molecular subtypes of BE and EAC using HM450 methylation data at the most variable CpG probes in BETRNET EAC samples with model-based clustering. Across subtypes we observed significant differences in epigenetically repressed genes and frequencies of genomic alterations. Our findings highlight molecular differences of potential biological significance in methylation-based subtypes of BE and EAC. Results Genome-wide methylation analysis reveals methylator subtypes of Barrett’s esophagus and esophageal adenocarcinoma Sean Maden1*, Ming Yu1*, Matthew Stachler2,3*, Andrew M. Kaz1,4,5, Tai J. Heinzerling1, Rachele M O’Leary1, Xinsen Xu3 , Adam Bass3,6, Amitabh Chak7,8, Joseph E. Willis9, Sanford D. Markowitz10, 11 William M. Grady1,4 Works Cited Introduction Methods Methylation Subtypes in EAC and BE Subtype-specific Genomic Alterations and Epigenetic Silencing Conclusions Two-panel Test to Determine EAC Methylation Subtypes *These authors contributed equally to this work, 1Division of Clinical Research, Fred Hutchinson Cancer Research Center, Seattle, WA, USA; 2Department of Pathology, Brigham and Women's Hospital and Harvard Medical School, Boston, Massachusetts, USA; 3Department of Medical Oncology, Dana-Farber Cancer Institute, Boston, Massachusetts, USA; 4Department of Medicine, University of Washington School of Medicine, Seattle, WA, USA; 5Gastroenterology Service, VA Puget Sound Health Care System, Seattle, WA, USA; 6Eli and Edythe L. Broad Institute, Cambridge, Massachusetts, USA; 7Divison of Gastroenterology, 8Division of Oncology, 9Department of Pathology, University Hospitals Case Medical Center, Cleveland, OH; 10Department of Medicine, 11Case Comprehensive Cancer Center, Case Western Reserve University and Case Medical Center, Cleveland, OH; USA. Data Access and Processing Fig 7. Results from HM- and HM/IM-specific panel search. A. and B. Volcano plots of results for array-wide differential methylation in HM vs. LM/MM (A.) and HM/IM vs. LM/MM (B.) for the training EAC dataset (N=58), with FDR-adj. p (q) values overlaid. C. Binary quilt plots for subtype assignments in EAC validation set (N=29). Fig 6. Panel sequencing reveals different frequencies of genomic alterations (SNVs and CNVs) across methylation subtypes in BETRNET sequencing panel data. Red circles highlight genes where subtype alterations are corroborated by TCGA whole-exome sequencing (data not shown). SNV = somatic nucleotide variants; CNV = copy number variants. Fig 5. Epigenetically repressed genes, including common and subtype-specific genes. we determined repression by selecting promoter island CpGs showing significant negative correlation between methyla- tion and expression (Spearman rho, p-adj < 0.05; β-value dif. > 0.3, and log2FC < -2.3, in EAC vs. normal tissue). We identified a set of 1515 most variable probes (MVPs) in the BETRNET EAC dataset (β-value std. dev. > 0.25), which were significantly enriched for intragentic probes in CpG island regions (58%, p < 0.05, binom. test). Fig 3. A heatmap of methylated CpGs in BETRNET BE cases shows distinct clusters based on methylation patterns with distinct proportions of methylated CpGs. Fig 4. Heatmaps of methylated CpGs in EAC cases from BETRNET (A.) and TCGA (B.) showing methylation-based clusters with distinct proportions of methylated CpGs in each cohort. EAC methylation is shown beside normal SQ. Samples were obtained from the BETRNET consortium, and HM450 arrays were prepared and preprocessed at Dr. Bill Grady’s lab and the Fred Hutch Genomics Core. For TCGA samples, level 1 HM450 array data was obtained from the Data Matrix and preprocessed in the same manner as BETRNET data (Fig.1). Genomic data for BETRNET samples was obtained using a custom sequence array targeting genes of etiologic and prognostic importance interest in EAC, and for TCGA samples whole-exome sequencing was used. Expression data for TCGA samples was obtained as Level 3 HiSeq output and preprocessed with sample rho threshold < 0.6, GC content normalization quantile filtering with mean threshold 0.25. Methylation Subtypes Fig 2. Decision tree for two-panel test derived from exhaustive search for HM- and HM/IM- specific panels. We identified methylation-based high (HM), intermediate (IM), low (LM), and minimal (MM) subtype samples with two methods: 1. Recursive-partitioning mixture model (RPMM) clustering using methylation at 1515 most variable probes (MVPs, β- value std. dev. > 0.25) identified in the BETRNET EAC samples. 2. A two-panel test designed for EAC samples, where a sample is assigned HM, IM, or LM/MM depending on whether it is positive for one, both, or none of the panels (Fig. 2). Fig 1. HM450 methylation data workflow in R using the minfi and sva packages (Aryee et al 2014). We used a large subset of the TCGA EAC samples (n=58) to train all combinations of five CpG probes drawn from the top 20 most significant differentially methylated probes (DMPs, FDR-adj p/q- value < 0.05) in two tests (HM vs. LM/MM and HM/IM vs. LM/MM). We validated the top performing panels (shown in Fig. 7) in the BETRNET EAC dataset and a small subset of TCGA EAC samples (N=29). The top HM-specific panel showed sensitivity and specificity 1 in both training and BETRNET validation datasets, and the top HM/IM-specific panel showed sensitivity 0.89 and specificity 1 in training, and sensitivity 0.83 specificity 1 in BETRNET validation. There was substantial concordance between clustering and panel subtype assignments for the TCGA validation set. We used a sequencing gene panel and whole exome sequencing to identify somatic nucleotide and copy number variants (SNVs and CNVs) in the BETRNET and TCGA EAC cohorts, respectively. Acknowledgements Financial Support: These studies were supported by funding from the NIH:UO1 CA152756, 5P30CA015704, U54CA163060, U01CA086402, U01CA182940 to WMG, P50 CA150964 to SDM, and T32DK007742 to MY. We have identified distinct methylation subtypes of BE and EAC that have unique genetic and biological features. Our findings suggest etiologies for BE and EAC may vary and that methylation subtypes can potentially be used to direct clinical care. These possibilities will require further investigation. Aryee MJ, Jaffe AE, Corrada-Bravo H, Ladd-Acosta C, Feinberg AP, Hansen KD and Irizarry RA. “Minfi: A flexible and comprehensive Bioconductor package for the analysis of Infinium DNA Methylation microarrays. Bioinformatics 2014, 30(10), pp. 1363-1369. Hur C, Miller M, Kong CY, Dowling EC, Nattinger KJ, Dunn M, and Feuer EJ. “Trends in esophageal adenocarcinoma incidence and mortality.” Cancer 2013 Mar 15;119(6):1149-58. Leek JT, Johnson WE, Parker HS, Fertig EJ, Jaffe AE and Storey JD. “Sva: Surrogate Variable Analysis.” R package version 3.18.0. Thrift and Whiteman DC. “The incidence of esophageal adenocarcinoma continues to rise: analysis of period and birth cohort effects on recent trends.” Ann Oncol. 2012 Dec;23(12):3155-62. We identified 63 likely pathogenic somatic mutations in 29 genes from sequencing panel data. We found subtype-specific events, including enrichment of ERBB2 SNVs and CNVs in both BETRNET and TCGA EAC cohorts, and enrichment of ARID1A mutations in the TCGA data, for HM samples compared to other subtypes (Fig. 6 and data not shown). In the TCGA cohort, we identified both subtype- specific and shared epigenetically repressed genes (Fig. 5). Using RPMM clustering on methylation at the MVPs, we identified four subtypes in each of the TCGA EAC and BETRNET EAC and BE datasets, respectively, that showed high (called the HM subtype), intermediate (IM), low (LM), and minimal (MM) overall methylation at MVPs (Figs 3 and 4). In all three datasets, the highest frequency of methylated CpGs was in the HM subtype, followed by IM, LM, and MM, respectively.