Recommended

Recommended
More Related Content
What's hot
What's hot (18)
Similar to Epigenetic Drift Landscape in EAC/BE
Similar to Epigenetic Drift Landscape in EAC/BE (20)
Recently uploaded
Recently uploaded (20)
Epigenetic Drift Landscape in EAC/BE
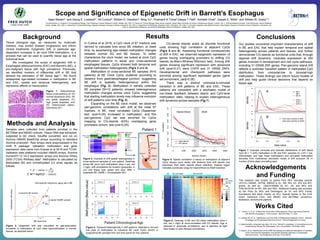
- 1. Background Tissue biological age, as measured by molecular markers, may predict disease progression and inform clinical treatments. Epigenetic drift, in particular age- dependent increases in de novo DNA methylation, is a process that can be used to quantify tissue age at the individual level. We investigated the scope of epigenetic drift in Esophageal adenocarcinoma (EAC) and Barrett’s (BE), a pre-malignant tissue with high prevalence. Previously, we identified markers of differential drift in BE that allowed the estimation of BE tissue age1,2. We found widespread age-related increases in methylation in BE and EAC, spatial and temporal heterogeneity, and repressive effects on transcription. Methods and Analysis Figure 5. Spatial correlation (r-value) of methylation at adjacent CpGs decays more slowly with distance from drift islands (red dots/lines) than static islands (black dots/line). Dashed region indicates coordinate range for Island/Shore-to-Shelf transition. Figure 7. Example unimodal and bimodal distributions of drift island CpG (N = 11,425) methylation in BE and EAC samples (A; L/I/H = low, intermediate, and high mean methylation) and simulated methylation densities from multicellular stochastic model of drift evolution (B; t= number of time steps simulating age). Figure 2. Epigenetic drift was calculated as age-associated increases in methylation at CpG sites hypomethylated in normal tissues, as depicted below: Figure 1. Histochemical tissue cross-sections of: (A) normal squamous (SQ); (B) low grade dysplasia; (C) high grade dysplasia, and (D) intramucosal adeno- carcinoma (D) 3. Results Conclusions Works Cited In Curtius et al 2016, a CpG clock of 67 markers was derived to calculate time since BE initiation, or dwell time, by ascertaining age-related methylation changes between normal SQ and BE tissues. To better characterize the clock model, we looked at clock CpG methylation patterns in serial and cross-sectional esophageal tissues. CpGs showed both temporal and spatial methylation heterogeneity (Fig’s 3 and 4). Methylation of cross-sectional BE samples (N=5 patients) at BE Clock CpGs clustered according to distance from gastroesophageal junction, suggesting BE drift is spatially heterogeneous within the esophagus (Fig. 3). Methylation in serially collected BE samples (N=12 patients) showed heterogeneous methylation changes across clock CpGs, suggesting that starting methylation levels may influence evolution of drift patterns over time (Fig. 4). Expanding on the BE clock model, we observed pan-genomic correlations with drift at the initial 67 markers. In BE, most correlated CpGs (Spearman test, qval<0.05) increased in methylation, and this pan-genomic CpG set was enriched for CpGs mapping to CG-islands (63%) overlapping gene promoters (binom. test pval<0.05). Acknowledgements and Funding This research was funded by grants from NIH, including several UO1CA (182940, 152756, 086402 to GL, SM, WH, KC, WG and MY) grants, as well as U54CA163060 (to AC, JW, and WG) and P30CA015704 (to MY, SM, and WG). Additional funding was provided by the Price (to WG) and DeGregorio (to GL and WG) Family foundations and Barts Charity (to KC). Special thanks to the Fred Hutch Genomics Core, and MEMO and BETRNet consortium facilitators, doctors and patients. 1. Curtius, K, et. al. “A Molecular Clock Infers Heterogeneous Tissue Age Among Patients with Barrett’s Esophagus”. PLoS Comput Biol 2016 May 11; 12(5) 2. Luebeck EG, et. al. “Identification of a Key Role of Widespread Epigenetic Drift in Barrett’s Esophagus and Esophageal Adenocarcinoma”. Clinical Epigenetics (in press) 3. (histochemistry composite img) Naini, BV et al. “Barrett’s Esophagus: A Comprehensive and Contemporary Review for Pathologists”. Am J Surg Pathol. 2016 May; 40(5). 4. Krause L et al. “Identification of the CIMP-like subtype and aberrant methylation of members of the chromosomal segregation and spindle assembly pathways in esophageal adenocarcinoma.” Carcinogenesis 2016 Apr; 37(4):356-65. CG-dense islands acted as discrete functional units showing high correlation at adjacent CpGs (Fig’s 5 and 6). Assessing functional consequences of drift in EAC, we observed epigenetic repression of genes having overlapping promoters to drifting CG islands (ts-Mann-Whitney-Wilcoxon test). Among 200 genes showing significant repression with advanced drift (qval<0.01) were CHFR and 31 GRAB ZNFs. Developmental and checkpoint pathways were enriched among significant repressed genes (gene set enrichment, padj<0.05). There was a distinct unimodal-to-bimodal transition in drift patterns of BE and EAC. These patterns are consistent with a stochastic model of non-linear feedback between island- and CpG-level methylation rates, helping to explain heterogeneous drift dynamics across samples (Fig 7). Our studies uncovered important characteristics of drift in BE and EAC that help explain temporal and spatial heterogeneity across patients and tissues, and further demonstrate CG-islands as functional units that, through regional drift dynamics, modulate expression at 200 genes involved in development and cell cycle pathways, including 31 GRAB ZNF genes. Pan-genomic island drift reflects a nonlinear transition pattern in methylated CpG distribution, from unimodal-low to bimodal-high methylation. These findings can inform future models of drift and help guide clinical decisions that depend on tissue age. Scope and Significance of Epigenetic Drift in Barrett’s Esophagus Figure 6. Heatmap of BE and SQ mean methylation (blue = low, red = high) at clock-correlated drift CG islands. Age is depicted in grayscale annotations, sex is depicted as light blue (male) or pink (female) annotations. *Co-first authors. A. Program in Computational Biology, Fred Hutchinson Cancer Research Center, Seattle, WA, USA ; B. Centre for Tumour Biology, Barts Cancer Institute, Queen Mary University of London Charterhouse Square, London, UK; C. Clinical Research Division, Fred Hutchinson Cancer Research Center, Seattle, WA, USA; D. Department of Gastroenterology, Digestive Disease & Surgery Institute, Cleveland, OH, USA; E. Department of Pathology, Cleveland Clinic, Cleveland, OH, USA; F. University Hospitals Case Medical Center, Case Western Reserve University School of Medicine, Cleveland, OH, USA; G. Department of Medicine, University of Washington School of Medicine, Seattle, WA, USA Sean MadenC* and Georg E. LuebeckA*, Kit CurtiusB, William D. HazeltonA, Ming YuC, Prashanti N ThotaD,Deepa T PatilE, Amitabh ChakF, Joseph E. WillisF, and William M. GradyC,G Figure 3. Example of drift spatial heterogeneity in cross-sectional samples of one patient. Heatmap shows BE clock CpG methylation (blue = low, red = high), with annotations for location (grayscale, in cm) and tissue type (green and blue, DBE = dysplastic BE, NDBE = nondysplastic BE). Figure 4. Temporal heterogeneity in drift patterns, depicted in dot and line plots of methylation at individual BE clock CpGs (N=67) in longitudinal BE samples from two time points for four patients. Samples were collected from patients enrolled in the BETRNet and MEMO cohorts. Tissue DNA was extracted, subjected to QC check, bisulfite converted, and run on Illumina HM450 BeadChip arrays according to standard Illumina protocols2. Raw arrays were preprocessed in the minfi R package. Validation methylation and gene expression data came from Krause et al 2016 and TCGA. Validation data platforms included HM450 arrays, Illumina HumanHT-12 V4.0 expression arrays and Illumina HISeq 2000 (TCGA) RNAseq data4. Methylation is calculated by Methylated (M) and Unmethylated (U) array signals as follows: 1. 𝛽 − 𝑣𝑎𝑙𝑢𝑒 = 𝑀 𝑈+𝑀 2. M = logit2(𝛽 − 𝑣𝑎𝑙𝑢𝑒)