More Related Content
Similar to SURE poster revised
Similar to SURE poster revised (13)
SURE poster revised
- 1. RESEARCH POSTER PRESENTATION DESIGN © 2011
www.PosterPresentations.com
Shot or Snot: Influencing Flu Vaccination Rates
Seasonal Influenza….
• Contagious respiratory illness
• Caused from respiratory droplets produced by a host
• Droplets produced from coughing, sneezing, talking
• Can be directly or indirectly transmitted to another person
• Symptoms
• Mild to severe
• Sore throat, nasal congestion, fever, systemic body aches,
weakness, and even death
• Symptoms can last two weeks or longer
• Can lead to other medical complications
How Does The Vaccination Work:
• The flu vaccine makes the body produce antibodies about
two weeks after the vaccination. These antibodies will help
protect the body from the viruses that were included in the
vaccine.
• Research is done to help predict which influenza viruses
may be most common during the upcoming season.
• These strands are then included in the vaccine.
Who Should Get The Vaccination?
• Anyone above the age of 6 months
• Especially those above the age of 50 or people with
immunosuppression
• Health–care personnel
• People with certain medical conditions, including asthma,
chronic lung disease, and diabetes
• Is the vaccine effective?
• Reduces the odds of getting the fly by 70-90% (Center for
Disease Control and Prevention, 2014)
• Side effects of vaccine:
• Less severe than the flu
• Range of symptoms
• Soreness where shot was injected, body aches, runny nose,
headache, vomiting, and low grade fever
• These are all short lived
PROCEDURE
PART 1:
• Continue to explore ways to increase flu vaccination rates.
The effect of testimonies vs. statistics stood out to us, and this
is where our current research is focused.
• Explore the literature: studies that used narrative information
(case studies, anecdotes).
PART 2:
• Design a study to be conducted at The University of
Minnesota.
PART 3:
• Partner with Mount Saint Mary College Heath Services in the
advertising campaign for the 2014-2015 flu vaccine season.
• then included in the vaccine
PART 2:
• We collaborated with Dr. Stellmack at University of Minnesota (UMN) to design a study to see if there was an influencing factor between seeing a sick person
(who could have the flu) or someone getting a shot in the arm (preventing them from getting the flu)
• Negative (shot, pain) now would mean no suffering from the flu later
• No pain now (don’t get the shot) could mean suffering in the future
• Identical posters, just change in the pictures
• Reason for choosing UMN: larger sample size compared to MSMC!
• Flyers were handed out during class and submitted to the professor in a folder. Study was anonymous.
PART 3:
• Partnered with Health Services here at MSMC to design a poster for the flu season
• We incorporated a narrative story into this year’s poster. We are looking to see if this narrative is powerful in compelling more students to get the flu vaccine.
METHODS
PART 1: Exploring the Literature
One study that peaked our interest was one carried out on vaccinating men who
were at risk for hepatitis B (Wit et al. 2008)
• Half the men read narrative stories while the other half received statistical
evidence
• The study showed that narrative evidence that supports a health risk
assertion can be an effective strategy to increase individuals perception of
their personal health risk, AND promote protecting behavior, receiving a
vaccination
• Narrative risk perfection – 3.45
• Statistical Risk Perception – 2.89
Continued research revealed similar findings, that narrative information can
sway us more to action that statistical evidence alone
One reason for low vaccination rates for influenza is people don’t think it’s a
serious illness. (Shahrabani et al. 2009)
• One study showed that when patients were presented with narrative
communication, they had a higher risk perception of influenza compared to
that of the no message condition (Prati et al. 2012)
Another study looked at promoting positive health behavior with narrative
information (Lemal et al. 2010)
• Those who were presented with narrative messages were “two to four times
more likely to have performed most of the recommended behaviors at follow
up” compared to those in the control group
One study looked at the effect of a fictitious character on television getting
cervical cancer, later dying off the show. They performed a retrospective
analysis on cervical screenings, and found an increase of up to 14,000 smears
the year following the airing of the show, with a substantial increase in weeks
following the soap opera story line (Howe et al. 2002)
A systematic review found that first person narrative was twice as likely to
produce an effect compared to third person narratives (Winterbottom et al.
2008)
PART 2: University of Minnesota Flu Survey
293 surveyed students did NOT get the flu vaccine last year
213 surveyed students DID get the flu vaccine last year
How will picture influence likelihood of getting vaccine?
• Shot picture – 3.02
• Sick picture – 3.06
• Higher number, higher likelihood, difference not significant
Part 3: MSMC Flu Flyer
• Pending results
RESULTS
DISCUSSION/FUTURE RESEARCH
There was plenty of literature on the topic of testimonials, case studies, and
personal anecdotes and their effect on decision making. The majority of
studies showed that these testimonies aided in making a decision, more so
than statistics and control groups with no intervention. This may be due to
the fact that these “stories” are vivid and grab our attention more than just
topic specific information. Additionally, these stories normally have
characters that we can relate to (Kreuter et al. 2011).
Our study at UMN proved to not have any real effect. We were under the
impression that when students were presented with the pictures of the shot,
this would decrease their intention to get vaccinated. On the other hand, we
thought when students were shown the “sick” students, this would move
them to get the flu shot. The end results were not significant, with only a
slight difference between groups.
Our current research at MSMC is underway. This year we are studying
whether the personal testimony on flyers will increase the flu vaccine rate
here on campus among residential freshman. Will will gather this data and
compare it with next year’s study.
We are anticipating partnering with heath services again next flu season
(2015-2016) and will design the posters to display statistical information.
This will allow us to see if testimonials do indeed sway decision making.
Further research is also needed to find out why this may be. Why does
narrative information move us to make a decision, and why does statistical
information not compare? This research will most likely need to be done in
the area of psychology and decision making.
SELECTED REFERENCES
Wit, J., Das, E., Vet, R. (2008). What works best: Objective statistics or a personal testimonial?
As assessment of the persuasive effects of different types of message evidence on risk
perception. Health Psychology, 27(1), 110-115.
Shahrabani, S. (2009). Factors affecting nurses’ decision to get the flu vaccine. Eur J Health
Econ, 10, 227-231
Lemal, M., & Van den Bulck, J. (2010). Testing the effectiveness of skin cancer narrative in
promoting positive health behavior: A pilot study. Preventative Medicine, 51, 178-181
Howe, A., Owen-Smith, V., Richardson, J. (2002). The impact of a television soap opera on the
NHS cervical screening programme in the north west of england. Journal of Public Health
Medicine, 24(4), 299-304
Winterbottom, A., Bekker, H., Conner, M, Mooney, A. (2008). Does narrative information bias
individual’s decision making? A systemativ review. Social Science & Medicine, 67, 2079-2088
Kreuter, M., Holmes, K., Alcaraz, K., Kalesan, B., Rath, S., Richet, M., . . . Clark, E. (2010).
Compaing narrative and informational videos to increase mammography in low-income african
american women. National Institute of Health, 81
Prati, G., Pietrantoni, L., Zani, B. (2012). Influenza vaccination: The persuasiveness of
messages among people aged 65 years and older. Health Communication, 27, 413-420
THANKS AND CONTACT
I would like to thank Dr. Kalkstein for giving me the opportunity to
perform this research. Also, many thanks to Dr. Moran for being
understanding and flexible with my back injury! Thank you to
Health Services, especially Ms. Bischof in collaborating with
designing the flu flyers. - Sean
Contact:
• Email – sdon2910@my.msmc.edu
• Phone – 845-742-0969
Mount Saint Mary College
Sean D’Onofrio and Dr. Yasmine Kalkstein
GET THE SHOT
NOT THE FLU
“Felt like I was hit by a car…”
“Getting the flu was the worst! I’ve never been so sick before in
my life. I had the highest fever of all time, and my body felt like I
was hit by a car. Being a college student didn’t help either. I was
too sick to go to class or to do any work, that I fell really far behind
in class. I ended up failing one science class, and got a few C’s in
others. I never want to get the flu again. I used to never get the
vaccination, but I know now that the best way to prevent myself
from getting the flu is to get the flu vaccination.”
FLU SEASON IS
APPROACHING
FAST!
ONLY $15
GET IT AT HEALTH
SERVICES!!!
NO APPOINTMENT
NECESSARY
GET THE SHOT
NOT THE FLU!
HEALTH SERVICES
Location: Guzman Hall
Hours:
Mon/Wed – 8:30-4:30
Tue/Thur – 8:30-5:00
Fri – 8:30-3:00
Phone: 845-569- 3152
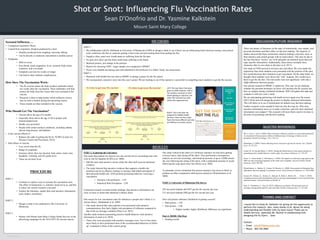
LEFT: The two flyers that were
given to UMN students. Half of
the students received on with
adults getting an injection, the
other half received one with
adults who appeared sick.
RIGHT: This is the flyer we
designed for MSMC Health
Services. There are four other
flyers that have different pictures
and different narrative stories.
It’s time to get your flu vaccine!
We are conducting this research to gather information about how many people
on campus will get the flu vaccination this year.
How likely are you to get the flu vaccine during the upcoming flu season (fall,
2014 or spring, 2015), either on campus or elsewhere?
(Circle one of the following numbers:)
1 2 3 4 5
Definitely Unlikely Equally likely Likely Definitely
will not and unlikely will
Did you get a flu vaccine during the last flu season (either in fall, 2013 or spring,
2014)?
(Circle one:)
YES NO