Advances in bio-optical sensing on robotic platforms to elucidate ecosystem production in the interior ocean

ABSTRACT The global view of ocean productivity has been defined for the past three decades by satellite-derived images of optical properties of the ocean’s surface layer. Yet in most of the ocean, zones of enhanced phytoplankton production and nutrient recycling are located at depths below the view of optical satellites. In the subtropical gyres, the almost ubiquitous deep chlorophyll maximum is often located at depths exceeding 100m, along density interfaces at a boundary between the down welling light flux and upward transport of nutrients. Below the chlorophyll maximum heterotrophic production is the dominant process resulting in strong oxygen consumption and dissolved nutrient regeneration. Observing the physical forcing and biogeochemical dynamics that drive this system at the relevant time scales ranging from the diel to the seasonal has been a long-standing challenge in oceanography. In particular, measuring the processes occurring through perturbations to relaxation has often been more happenstance than design. In this presentation we describe advances in sensor systems deployed on autonomous robotic profilers to quantify carbon, oxygen and nutrient cycling within the interior ocean and present examples from the subtropical Indian Ocean and western Mediterranean. Acknowledgements: Funding for CSIRO provided through the Australia-India Strategic Research Fund, OCE Postdoctoral fellowship scheme and Antarctic Climate and Ecosystems Cooperative Research Centre.
Recommended

Recommended
More Related Content
What's hot
What's hot (10)
Viewers also liked
Similar to Advances in bio-optical sensing on robotic platforms to elucidate ecosystem production in the interior ocean
Similar to Advances in bio-optical sensing on robotic platforms to elucidate ecosystem production in the interior ocean (20)
More from SeaBirdScientific
More from SeaBirdScientific (6)
Recently uploaded
Recently uploaded (20)
Advances in bio-optical sensing on robotic platforms to elucidate ecosystem production in the interior ocean
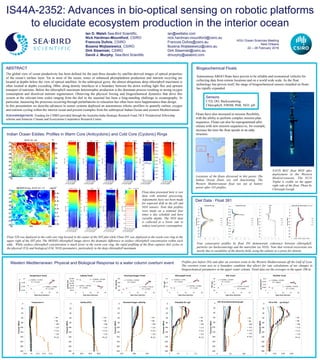
- 1. Ian D. Walsh Sea-Bird Scientific, Nick Hardman-Mountford, CSIRO Francois Dufois, CSIRO Bozena Wojtasiewicz, CSIRO Dirk Slawinski, CSIRO David J. Murphy, Sea-Bird Scientific ABSTRACT The global view of ocean productivity has been defined for the past three decades by satellite-derived images of optical properties of the ocean’s surface layer. Yet in most of the ocean, zones of enhanced phytoplankton production and nutrient recycling are located at depths below the view of optical satellites. In the subtropical gyres, the almost ubiquitous deep chlorophyll maximum is often located at depths exceeding 100m, along density interfaces at a boundary between the down welling light flux and upward transport of nutrients. Below the chlorophyll maximum heterotrophic production is the dominant process resulting in strong oxygen consumption and dissolved nutrient regeneration. Observing the physical forcing and biogeochemical dynamics that drive this system at the relevant time scales ranging from the diel to the seasonal has been a long-standing challenge in oceanography. In particular, measuring the processes occurring through perturbations to relaxation has often been more happenstance than design. In this presentation we describe advances in sensor systems deployed on autonomous robotic profilers to quantify carbon, oxygen and nutrient cycling within the interior ocean and present examples from the subtropical Indian Ocean and western Mediterranean. NAVIS BGC float 0028 after deployment in the Western Mediterranean. The ECO Triplet is visible on the upper right side of the float. Photo by Christoph Gerigk. Biogeochemical Floats Autonomous ARGO floats have proven to be reliable and economical vehicles for collecting data from remote locations and on a world wide scale. As the float technology has proven itself, the range of biogeochemical sensors installed on floats has rapidly expanded. IS44A-2352: Advances in bio-optical sensing on robotic platforms to elucidate ecosystem production in the interior ocean AGU Ocean Sciences Meeting New Orleans 22 – 26 February 2016 ian@wetlabs.com nick.hardman-mountford@csiro.au Francois.Dufois@csiro.au Bozena.Wojtasiewicz@csiro.au Dirk.Slawinski@csiro.au dmurphy@seabird.com 1 9/23/12 245 2/14/14 Locations of the floats discussed in this poster. The Indian Ocean floats are still functioning. The Western Mediterranean float ran out of battery power after 245 profiles. Indian Ocean Eddies: Profiles in Warm Core (Anticyclonic) and Cold Core (Cyclonic) Rings 0" 20" 40" 60" 80" 100" 120" 140" 160" 180" 200" 38" 38.2" 38.4" 38.6" Pressuer&(dBar)& Salinity&(PSU)& 93" 98" 100" 112" 113" 114" 115" 0" 20" 40" 60" 80" 100" 120" 140" 160" 180" 200" 0" 0.5" 1" 1.5" Pressuer&(dBar)& Chlorphyll&(fl.)&ug/l& 93" 98" 100" 112" 113" 114" 115" 0" 20" 40" 60" 80" 100" 120" 140" 160" 180" 200" 150" 200" 250" Pressuer&(dBar)& Dissolved&Oxygen&uMol/kg& 93" 98" 100" 112" 113" 114" 115" 0" 20" 40" 60" 80" 100" 120" 140" 160" 180" 200" 12.8" 13" 13.2" 13.4" 13.6" Pressuer&(dBar)& Temperature&C& 93" 98" 100" 112" 113" 114" 115" 0" 20" 40" 60" 80" 100" 120" 140" 160" 180" 200" 0" 0.01" 0.02" 0.03" Pressuer&(dBar)& Chl&to&POC&&&&&ug&Chl/ug&C& 93" 98" 100" 112" 113" 114" 115" Western Mediterranean: Physical and Biological Response to a water column overturn event Floats have also increased in mission flexibility, with the ability to perform complex mission plan sequences. Floats can also be reprogrammed after release with new mission sequences to, for example, increase the time the float spends in an eddy structure. Sensors: CTD, DO, Backscattering, Chlorophyll, FDOM, PAR, NO3, pH Float data presented here is raw data with minimal processing. Adjustments have not been made for expected drift in the pH and NO3 sensors. Note that profiles were made on a nominal four times a day schedule and have variable depths. The NO3 data is collected at a lower rate to reduce total power consumption. Float 528 was deployed in the cold core ring located in the center of the SST plot while Float 391 was deployed in the warm core ring in the upper right of the SST plot. The MODIS chlorophyll image shows the dramatic difference in surface chlorophyll concentration within each eddy. While surface chlorophyll concentration is much lower in the warm core ring, the rapid profiling of the float captures diel cycles in the physical (T,S) and biological (Chl, NO3) parameters, particularly in the deep chlorophyll maximum. Profiles just before (93) and after an overturn event in the Western Mediterranean off the Gulf of Lyon. The overturn event acts as a boundary condition that allows for rate calculations of net changes in biogeochemical parameters in the upper water column. Trend data are the averages in the upper 200 m. Acknowledgements: Funding for CSIRO provided through the Australia-India Strategic Research Fund, OCE Postdoctoral fellowship scheme and Antarctic Climate and Ecosystems Cooperative Research Centre. 0" 20" 40" 60" 80" 100" 120" 140" 160" 180" 200" 0" 0.5" 1" 1.5" 2" Pressuer&(dBar)& Chlorphyll&(fl.)&ug/l& 48" 49" 50" 51" 35.5$ 35.52$ 35.54$ 35.56$ 35.58$ 35.6$ 35.62$ 35.64$ 35.66$ 35.68$ 35.7$ 35.72$ 0$ 0.5$ 1$ 1.5$ 2$ Pressuer&(dBar)& Chlorphyll&(fl.)&ug/l& 48$ 49$ 50$ 51$ 0" 20" 40" 60" 80" 100" 120" 140" 160" 180" 200" 0" 1" 2" 3" 4" 5" Pressuer&(dBar)& NO3& 48" 49" 50" 51" 0" 20" 40" 60" 80" 100" 120" 140" 160" 180" 200" 0" 0.0001"0.0002"0.0003"0.0004" Pressuer&(dBar)& Backsca.ering&700&nm&(Beta,&m71&sr71)&& 48" 50" 51" 52" Diel Data : Float 391 Four consecutive profiles by float 391 demonstrate coherence between chlorophyll, particles (as backscattering) and the nutricline (as NO3). Note that vertical excursions are mostly due to variability of the density field, using the salinity as a proxy for density.