1. Abstract: Polar regions remain among the least accessible areas on this planet. The remoteness and harsh climate hampered their study and still present formidable
obstacles. Each data bit from these areas costs many times one obtained elsewhere. Therefore, international collaboration is absolutely critical in polar regions if we are to
build an adequate global data base for climate and ecosystem research. The volume of data at the National Oceanographic Data Center, World Data Center for
Oceanography has sharply increased owing to the Global Oceanographic Data Archaeology and Rescue (GODAR) project initiated in 1993 by the Intergovernmental
Oceanographic Commission. As a result, many data gaps that existed 20 years ago are now filled, and data coverage in polar regions dramatically improved as hundreds
of thousands of newly acquired oceanographic stations became available. Examples are presented from several key areas in the Arctic and Antarctic where modern data
density improved manifolds compared to the past, thus enabling scientific exploration and in-depth studies of these remote areas.
Oceanographic Data for Polar Regions in
the World Ocean Database
Daphne Johnson and Sydney Levitus
NOAA1/NESDIS2/National Oceanographic Data Center
World Data Center for Oceanography, Silver Spring - USA
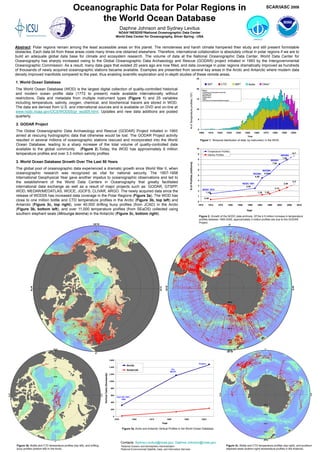
3. World Ocean Database Growth Over The Last 50 Years
The global pool of oceanographic data experienced a dramatic growth since World War II, when
oceanographic research was recognized as vital for national security. The 1957-1958
International Geophysical Year gave another impetus to oceanographic observations and led to
the establishment of the World Data Centers in Oceanography that greatly facilitated
international data exchange as well as a result of major projects such as: GODAR, GTSPP,
WOD, MEDAR/MEDATLAS, WOCE, JGOFS, CLIVAR, ARGO. The newly acquired data since the
release of WOD05 has increased data coverage in the Polar Regions (Figure 3a). The WOD has
close to one million bottle and CTD temperature profiles in the Arctic (Figure 3b, top left) and
Antarctic (Figure 3c, top right), over 40,000 drifting buoy profiles (from JCAD) in the Arctic
(Figure 3b, bottom left), and over 11,000 temperature profiles (from SEaOS) collected using
southern elephant seals (Mirounga leonina) in the Antarctic (Figure 3c, bottom right).
2. GODAR Project
The Global Oceanographic Data Archaeology and Rescue (GODAR) Project initiated in 1993
aimed at rescuing hydrographic data that otherwise would be lost. The GODAR Project activity
resulted in several millions of oceanographic stations rescued and incorporated into the World
Ocean Database, leading to a sharp increase of the total volume of quality-controlled data
available to the global community (Figure 2).Today, the WOD has approximately 9 million
temperature profiles and over 3.3 million salinity profiles.
1. World Ocean Database
The World Ocean Database (WOD) is the largest digital collection of quality-controlled historical
and modern ocean profile data (1772 to present) made available internationally without
restrictions. Data and metadata from multiple instrument types (Figure 1) and 25 variables
including temperature, salinity, oxygen, chemical, and biochemical tracers are stored in WOD.
The data are derived from U.S. and international sources and is available on DVD and on-line at
www.nodc.noaa.gov/OC5/WOD05/pr_wod05.html. Updates and new data additions are posted
quarterly.
0
5
10
15
20
25
1900 1910 1920 1930 1940 1950 1960 1970 1980 1990 2000
Year
XBT CTD MBT OSD Other*
*Other:
Undulating Oceanographic Recorder
Profiling Float
Moored Buoy
Drifting Buoy
Glider
Autonomous Pinniped Bathythermograph
#ofTemperatureprofiles(104)
Figure 1. Temporal distribution of data, by instrument, in the WOD.
Figure 2. Growth of the NODC data archives. Of the 4.5 million increase in temperature
profiles between 1993-2005, approximately 3 million profiles are due to the GODAR
Project.
NODC 1974
1.49
NODC 1991
2.54
WOA94
4.49
WOD98
5.29
WOD05
7.90
WOD01
7.04
8.7
0.40
1.28 1.48
2.12
2.64
3.3
0
1
2
3
4
5
6
7
8
9
10
1970 1974 1978 1982 1986 1990 1994 1998 2002 2006 2010
Year
#ofProfiles(millions)
Temperature Profiles
Salinity Profiles
0
200
400
600
800
1,000
1,200
1,400
1,600
1955 1965 1975 1985 1995 2005
Year
VerticalCasts(thousands)
Arctic
Antarctic
Post IGY 1957-
1958
Present
Pre
WOCE
Contacts: Sydney.Levitus@noaa.gov; Daphne.Johnson@noaa.gov
1National Oceanic and Atmospheric Administration
2National Environmental Satellite, Data, and Information Services
Figure 3a. Arctic and Antarctic Vertical Profiles in the World Ocean Database.
Figure 3b. Bottle and CTD temperature profiles (top left), and drifting
buoy profiles (bottom left) in the Arctic.
Figure 3c. Bottle and CTD temperature profiles (top right), and southern
elephant seals (bottom right) temperature profiles in the Antarctic.
Bottle
SCAR/IASC 2008