Wildlife Society Bulletin 2016 CraggTechniques for monitoring Brachyramphusmurrelets A comparison of radar autonomous acoustic recording and audio-visual surveys
Similar to Wildlife Society Bulletin 2016 CraggTechniques for monitoring Brachyramphusmurrelets A comparison of radar autonomous acoustic recording and audio-visual surveys
University Of Glasgow Iceland Expedition 2008Skalanes
Similar to Wildlife Society Bulletin 2016 CraggTechniques for monitoring Brachyramphusmurrelets A comparison of radar autonomous acoustic recording and audio-visual surveys (20)
Wildlife Society Bulletin 2016 CraggTechniques for monitoring Brachyramphusmurrelets A comparison of radar autonomous acoustic recording and audio-visual surveys
1. Tools and Technology
Techniques for Monitoring Brachyramphus
Murrelets: A Comparison of Radar,
Autonomous Acoustic Recording
and Audio-Visual Surveys
JENNA L. CRAGG,1
Department of Biology, University of Victoria, P.O. Box 3020 STN CSC, Victoria, BC V8W 3N5, Canada
ALAN E. BURGER, Department of Biology, University of Victoria, P.O. Box 3020 STN CSC, Victoria, BC V8W 3N5, Canada
JOHN F. PIATT, United States Geological Survey, Alaska Science Center, 4210 University Drive, Anchorage, AK 99508-4626, USA
ABSTRACT Conditions in Alaska, USA, pose a challenge for monitoring populations of Brachyramphus
murrelets using standard survey methods, because of strong winds, 2 sympatric species, short nights, and
variable nesting habitat. We tested 3 methods for monitoring Brachyramphus murrelets breeding in the
Kodiak Archipelago, Alaska, in 2010–2012. In addition to standard audio-visual and radar methods, we
tested—for the first time with murrelets in Alaska—the application of autonomous acoustic recorders for
monitoring vocal activity. We completed 74 radar, 124 audio-visual, and 134 autonomous acoustic surveys,
focused on presunrise activity peaks; this yielded 26,375 murrelet detections. Marbled (B. marmoratus) and
Kittlitz’s murrelets (B. brevirostris) could not be distinguished using combinations of radar and acoustic
recordings; therefore, at-sea surveys will be required to determine localized species proportions. Of the 3
methods, radar sampled the largest area and detected silently flying murrelets, providing the most reliable
data on local populations; however, radar identification of murrelets was unreliable in winds exceeding
18 km/hr. Audio-visual surveys were useful for species identification and to document behaviors associated
with local nesting, whereas autonomous acoustic recorders allowed season-long monitoring of murrelet vocal
activity. Within potential forest-nesting habitat of marbled murrelets, all 3 methods gave similar measures of
presunrise murrelet activity, but only radar reliably sampled murrelets commuting between nest and ocean.
Because of their low cost and flexible programming, automated sound recorders offer an affordable way to
sample vocal activity prior to more intensive or expensive radar and audio-visual surveys. We recommend that
population monitoring and habitat studies of Brachyramphus murrelets in Alaska include combinations of all
3 methods. Published 2016. This article is a U.S. Government work and is in the public domain in the USA.
KEY WORDS Alaska, audio-visual, automated acoustic recording, Brachyramphus murrelets, Kittlitz’s murrelet,
marbled murrelet, population monitoring, radar.
Marbled murrelets (Brachyramphus marmoratus) have an
extensive breeding range that extends from central California
through the Aleutian Islands of the United States. Their
congener, the Kittlitz’s murrelet (B. brevirostris), has a more
restricted range in Alaska, USA, and eastern Russia, and the 2
species of diving seabirds breed sympatrically in parts of Alaska.
Brachyramphus murrelets are unique among alcids (Alcidae) in
their noncolonial and highly dispersed nesting, cryptic breeding
sites, camouflaged plumage and secretive nest attendance.
These nesting habits make it difficult to survey and monitor
populations, yet both species of Brachyramphus murrelets are of
conservation concern in Alaska as a result of evidence of large
population declines over the past 25 years (Piatt et al. 2007,
2011; Kuletz et al. 2011a, b). Reliable survey methods for
murrelets are needed in Alaska to refine population estimates,
establish long-term monitoring programs and undertake
habitat association studies.
Throughout their range, marbled murrelets generally nest
in mossy limbs of old-growth conifers, but also nest on the
ground or on mossy cliff ledges (Nelson 1997, Willson et al.
2010, Barbaree et al. 2014). In Alaska, 97% of their at-sea
distribution during the breeding season occurs adjacent to
forest habitat (Piatt and Ford 1993), but recent evidence
suggests that these birds may not necessarily nest in trees
(Barbaree et al. 2014); in the Kodiak Archipelago, large
populations of murrelets were associated with unforested
habitats (Cragg 2013).
Received: 14 May 2014; Accepted: 27 September 2015
1
E-mail: jenna.cragg@gmail.com
Wildlife Society Bulletin; DOI: 10.1002/wsb.623
Cragg et al. Monitoring Techniques for Brachyramphus Murrelets 1
2. Currently, at-sea vessel surveys are the primary method
used in abundance monitoring for Brachyramphus murrelets
in Alaska (Piatt et al. 2007), but this method gives imprecise
population estimates and has low power to detect population
trends (Kissling et al. 2007, Kissling 2011). In the southern
portion of the marbled murrelet’s range, audio-visual and
radar surveys are the principal census and monitoring
methods (Evans Mack et al. 2003, Bigger et al. 2006b,
Manley 2006). Radar surveys are used to count flying
murrelets as they commute daily between marine foraging
habitat and nest sites along predictable flight paths,
providing an estimate of the local breeding population
size. Audio-visual surveys are designed to monitor murrelet
presence and relative abundance within potential nesting
habitats and detect behaviors indicative of nearby nesting.
Radar surveys have not been widely tested in Alaska because
of conditions that make standard survey methods more
challenging than in southern latitudes, including the
presence of 2 sympatric species that are not easily
distinguished, reduced period of darkness at night, windier
conditions, and highly variable nesting habitat.
Automated acoustic recorders can operate unattended in
remote locations for weeks to months and have proved
successful in population and community studies of other
seabirds (Buxton and Jones 2012, Borker et al. 2014, Oppel
et al. 2014). A major limitation of monitoring murrelet
populations using radar or audio-visual surveys is the high
cost of supporting field crews, which often reduces spatial
and temporal replication of surveys. Automated acoustic
recording devices offer an affordable alternative for season-
long monitoring with minimal field logistics, but their
effectiveness with Brachyramphus murrelets is unknown.
Here we compare daily and seasonal detection rates of
murrelets with the 3 methods (radar, audio-visual, and
automated acoustic recorders), covering both nesting habitat
and commuting flyways (flight paths used daily by murrelets
to travel between nest sites and marine foraging grounds;
Burger 1997). We compared the strengths and limitations of
each method for different aspects of Brachyramphus murrelet
population management, from monitoring vocal activity in
small patches of forest to region-wide population monitoring
programs. Although focused on Alaskan conditions, our
study has relevance for censusing and monitoring Brachyr-
amphus murrelets throughout their ranges.
STUDY AREA
We observed murrelets at 27 sites in the Kodiak Archipelago,
Alaska, from 2010 to 2012 (Fig. 1; Cragg 2013). We sampled
terrestrial habitats along an ecological gradient from tundra
ecosystems typical of subarctic Aleutian Heath on south-
western Kodiak Island (Grant Lagoon; 578280
N, 1548390
W)
to sites dominated by Sitka spruce (Picea sitchensis) forests on
the northeastern Kodiak Archipelago (e.g., Monashka Bay;
578500
N, 1528280
W). Both Kittlitz’s and marbled murrelets
are known to breed in the Kodiak Archipelago (Piatt and
Ford 1993, Stenhouse et al. 2008, Lawonn 2013), but
Kittlitz’s murrelets were rare in our study area, both at sea
( 1% of all Brachyramphus murrelets observed at sea; Cragg
2013), and in our inland counts (details below). Conse-
quently we focus our analysis on data from marbled murrelets
but provide recommendations for population monitoring
applicable to both species of murrelets in Alaska.
METHODS
We conducted repeated radar and audio-visual surveys at
Grant Lagoon in 2010 throughout the breeding season to
assess diurnal and seasonal activity trends and the effects of
weather conditions on radar counts. In 2011 and 2012, we
conducted repeated radar, audio-visual, and acoustic surveys
simultaneously at Monashka Bay. We sampled an additional
5 sites once each by radar and acoustic surveys in 2012 to
compare with results from Monashka Bay. We used counts
from radar surveys conducted in 2011–2012 at 21 additional
sites in the eastern and the northern Kodiak Archipelago to
assess diurnal activity patterns (Fig. 1). All procedures were
approved by the University of Victoria Animal Care
Committee (protocol 2010-014). Sampling spanned the
core breeding period (including incubation, chick-rearing,
and fledging), from early June through mid-August, in each
year.
Field Methods
We used a marine radar to observe flying murrelets (Hamer
et al. 1995, Burger 1997). The radar unit (Furuno 1954C,
X-band, 12-kW transmitter, 9,410-MHz, 2-m scanner;
Furuno Electric Co., Ltd., Nishinomiya, Hyogo Prefecture,
Figure 1. Radar and audio-visual sites surveyed for breeding Brachyramphus
murrelets from 2010 to 2012 in the Kodiak Archipelago, Alaska, USA. Sites
with additional automated acoustic surveys are indicated by stars.
2 Wildlife Society Bulletin 9999
3. Japan) had been modified by tilting the scanner upward by
158 according to standard adjustments for murrelet surveys
(Burger 1997, Harper et al. 2004). In 2010 at Grant Lagoon,
we conducted exploratory surveys of 6 hr in randomized
periods throughout the 24-hr cycle to investigate diurnal
activity and permit visual identification during daylight of
other species detected by radar. We found commuting
murrelets were active throughout the night, with a peak of
activity that began 2 hr before sunrise (Cragg 2013). Thus, in
2011–2012, we conducted radar surveys only at night,
beginning 30 min before sunset and ending 1 hr after sunrise
or 10 min after the last murrelet detection, whichever came
last (sunrise and sunset times from www.sunrisesunset.com).
For each murrelet detected by radar, we recorded flight
behavior in an attempt to distinguish murrelets from other
species. We identified targets (Fig. 2A) on the basis of 4
criteria: 1) flight speed !50 km/hr; 2) flight type (direct or
sinusoidal); 3) flight path consistent with the likely route
used for commuting flight between potential nesting areas
and marine foraging sites; and 4) !4 sequential images of the
target (hits). If all 4 criteria were met, we recorded the target
as a “murrelet”; we recorded targets meeting fewer than 4 of
the criteria as an unknown species. We recorded the actual
species if verified by the audio-visual observer (see below).
We categorized murrelet flight direction shown on radar as
inbound (landward) or outbound (seaward). We recorded
weather conditions (wind speed, measured with an ane-
mometer; and wind direction, measured by compass) at the
start and end of each survey, plus weather events during the
survey that would affect the reliability of data (e.g., high
winds or rain showers). Rain showers produce screen clutter
on radar that reduces visibility of bird targets; therefore, if
rain persisted for 10 min during peak activity periods (2 hr
presunrise), the survey data were not used in analyses.
We conducted audio-visual surveys in conjunction with
radar surveys at dusk (from radar survey start until civil
twilight) and at dawn (1 hr before sunrise until 1 hr after
sunrise). We used standard audio-visual protocols (Evans
Mack et al. 2003) to record murrelet detections, including
species identity when possible, and behaviors indicative of
potential nesting nearby (i.e., flight below the forest canopy,
aerial dives, and low-altitude circling).
We deployed Song Meter automated acoustic sensors
(Wildlife Acoustics, Inc., Concord, MA; SM1, SM2
Terrestrial and Night Flight; see Cragg et al. [2015] for
details on model performance) during the murrelet breeding
season(Jun–Aug)in2011and2012.Recordingswereanalyzed
using automated recognition models developed in Song Scope
acoustic software (Wildlife Acoustics, Inc.) that identified
potentialmurreletvocalizationswithinrecordings,whichwere
then checked by a human observer on a spectrogram and
grouped into call types according to Dechesne (1998). Details
of field sampling and acoustic analysis are in Cragg et al.
(2015). Song Meters were programmed to record for 2 hr each
day, starting 2 hr before sunrise, to match the peak of murrelet
activity observed by radar.
At Monashka Bay, we deployed Song Meters in 2011 and
2012 within forested potential nesting habitat (sensors
FOR1 and FOR2, located in the same tree to compare sensor
performance; Cragg et al. 2015) and along an unforested
flight path used by murrelets identified by radar (FP;
Fig. 2B). For testing differences among other sites, in 2012
we deployed sensors at 6 sites in the northern Kodiak
Archipelago in potential forested nesting habitat within the
radar scanning areas (Fig. 1); at one site no forested nesting
habitat was available and we placed the Song Meter below a
commuting flight path. Multiple Song Meters could be used
within one radar-station scanning radius because of the much
smaller area sampled by Song Meter (60-m radius; Cragg
et al. 2015) compared with the radar-scanning radius
(1.5 km).
Definitions of Detections
The murrelet ‘detection’ was the common unit of comparison
among survey methods. In radar surveys, a murrelet detection
was defined as a series of !4 radar echoes that have the
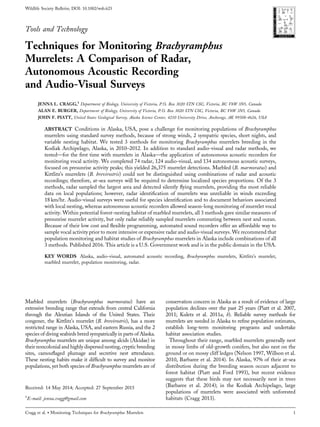
Figure 2. A) Radar screen image overlaid over a satellite photo of
Monashka Bay, Alaska, USA, showing Brachyramphus murrelet targets
commuting along a flight corridor in the lower left side of the circle. Large
red patches are areas of land detected by the radar scanning beam. Red dots
are murrelet targets with echo trails showing their flight path and speed
(distance between white dots). B) Locations of Song Meters (FOR1 and
FOR2 in likely forest habitat and FP under a commuting flight path) with
the scanning radius of the radar (white circle). Typical flight paths are shown
by white arrows, with circling occurring above potential forest-nesting
habitat and commuting occurring over unforested habitat.
Cragg et al. Monitoring Techniques for Brachyramphus Murrelets 3
4. appearance, flight speed, and flight pattern characteristic of a
murrelet (Manley 2006). For audio-visual surveys, we
defined a murrelet detection as “the sighting or hearing of
one or more murrelets acting in a similar manner” (Paton
1995:113), with gaps between calls of 5 s considered
separate detections (Evans Mack et al. 2003). We similarly
defined an automated acoustic murrelet detection as a series
of murrelet calls not separated by 5 s (Cragg et al. 2015).
Exploring Diurnal and Seasonal Trends and Wind
Effects
Only one site provided radar sampling spanning most of a
breeding season (Grant Lagoon; 14 overnight surveys, 3 Jun–
27 Jul 2010). We used mean murrelet counts per hour for
each survey to show seasonal trends in activity (Table 1A).
We also used these repeated counts to test whether
increasing wind speed resulted in higher counts of murrelet
targets (due to apparently greater flight speed of birds caused
by tailwinds) using linear regression (a ¼ 0.05 for all
statistical tests). We then removed outlier counts from
wind events exceeding approximately 18 km/hr from the
linear regression to assess whether the trend remained
significant. Despite the relatively open and exposed coastline
of the Kodiak Archipelago, high winds (18 km/hr) did not
affect a high proportion of surveys across all sites (11.1% of
all surveys attempted in 2010–2012), whereas high winds
prevented only 3 survey attempts. We did not use data from
surveys affected by high winds in other analyses.
To examine diurnal activity patterns in radar and audio-
visual surveys at all other sites in 2011 and 2012, we
calculated the proportion of murrelets flying inland in each
survey’s counts within 30-min intervals (relative to sunrise),
calculated the mean proportion in each interval across all
sites, and used the coefficient of variation of the mean as a
measure of variability in activity (Table 1B). We used mean
counts per hour at Grant Lagoon rather than using counts of
murrelets flying inland per 30-min interval presunrise,
because of the low counts at this station.
We made season-long tests of Song Meters within the
radar scanning area at Monashka Bay on Kodiak Island, at 2
locations from 15 June to 3 September 2011, and from 1 June
to 27 August 2012 (Table 1C; Fig. 2B). To illustrate
similarities in seasonal activity trends, and demonstrate
differences in seasonal coverage by different survey methods,
we plotted repeated counts for the 3 survey methods across
the breeding season from Grant Lagoon (radar; 2010), and
Monashka Bay (radar, audio-visual, and Song Meter;
2011–2012) using local polynomial regression fitting.
Comparison Between Radar, Audio-Visual, and
Autonomous Acoustic Detections
We compared audio-visual and Song Meter detections for
surveys conducted at Monashka Bay, which was the only
location where audio-visual observers were within 300 m of
the Song Meter. We conducted simultaneous surveys on 6
mornings in both 2011 (10–18 Jul) and 2012 (16–24 Jul). We
compared the total number of audio-visual detections with
Song Meter detections during the period starting 1 hr before
sunrise when surveys overlapped (Table 1D). We compared
total audio-visual detections (visual and aural) with acoustic
recordings rather than comparing only aural detections
(ignoring visual observations) to assess whether acoustic
sensors provided detection frequencies comparable to a
human observer. The 2011 data were collected slightly earlier
in the season and had lower overall counts than 2012;
therefore, we compared the yearly mean Song Meter and
audio-visual counts separately using 2-sample t-tests. In
addition, we compared counts from radar, Song Meter, and
Table 1. Summary of survey method comparisons (radar, audiovisual, and acoustic), survey effort, and locations by year, used for monitoring Brachyramphus
murrelets breeding in the Kodiak Archipelago, Alaska, USA, 2010–2012. Ã
For this analysis, repeated counts from Monashka Bay were averaged to use one
number for comparison with the other 5 sites.
Goal
Survey methods
used Year Location Sampling period No. surveys
A) Explore seasonal and
diurnal activity patterns,
test effects of wind
Radar 2010 Grant Lagoon 6-hr sampling blocks (24 hr) 35
B) Identify diurnal activity
pattern across multiple
habitat types
Radar 2011–2012 26 sites in Kodiak
Archipelago
30-min presunset until end of
dawn activity peak or 1 hr
after sunrise
36
C) Identify seasonal and
diurnal activity trends
Acoustic 2011–2012 Monashka Bay 2 hr presunrise 134
D) Compare counts in
potential nesting habitat
Audio-visual,
Acoustic
2011–2012 Monashka Bay 1 hr presunrise 6/yr
E) Compare counts in
potential nesting habitat
Radar,
Audio-visual,
Acoustic
2011–2012 Monashka Bay 1 hr presunrise 6/yr
F) Correlation test of counts
across sites
Radar
Acoustic
2011–2012 Monashka Bay 5 sites
in northern archipelago
2 hr presunrise 6Ã
G) Correlation test of counts
at one site across breeding
season
Radar
Acoustic
2011–2012 Monashka Bay 2 hr presunrise 10
H) Compare mean counts
between potential nesting
habitat and commuting
flight path
Radar
Acoustic
2011–2012 Monashka Bay 2 hr presunrise Radar: 10;
Acoustic:
34
4 Wildlife Society Bulletin 9999
5. audio-visual surveys in each year for the Monashka Bay site
using a one-way ANOVA for the period during which all 3
surveys were conducted simultaneously (1 hr presunrise;
Table 1E).
For spatial comparisons, we used radar and Song Meter
counts at 6 sites where surveys were conducted in 2012 to
test for correlations in counts across sites (Table 1F; Fig. 1).
The goal was to compare targets detected by radar that
could potentially be detected by a Song Meter; however,
because radar surveys focused on counting all flying birds
within the scanning radius, it was not possible to track the
distance of each target from the Song Meter location.
Rather, where obvious flight paths distant (!500 m) from
Song Meter locations were found, we excluded those radar
data from comparisons with Song Meter. We compared the
frequency of vocal detections from Song Meters (total
detections per morning) with the total number of incoming
commuting murrelets observed by radar at each site (with
the exception of excluded flight paths). We surveyed 5 of
the 6 sites only once (Cragg 2013), but we conducted
multiple surveys at Monashka Bay. Thus, we used a mean
count of daily Song Meter and radar detections from
Monashka Bay for this analysis. We tested for correlation
between radar and Song Meter detections across the 6 sites
using a Spearman’s rank test.
We conducted a within-site comparison of radar and Song
Meter counts at Monashka Bay, where we repeated
concurrent radar and Song Meter surveys on multiple
mornings in 2011 and 2012 (Table 1G). To test whether
radar and Song Meter counts were correlated, we compared
Song Meter counts from the sensor location FOR1 (Fig. 2B)
with radar counts for the flight path closest to this sensor
using a Spearman’s rank test for pooled counts from both
years.
To test for on-site habitat effects, we compared differences
in vocalization rates recorded by Song Meters in relation to
radar counts for Song Meters located in 2 habitat types
within the radar scanning area at Monashka Bay: 1) a
forested likely nesting area, where 24% of murrelet targets
observed by radar (N ¼ 587) engaged in circling flight
(suggesting site occupancy; Evans Mack et al. 2003); and 2) a
high-traffic commuting flight corridor, where 96% of
murrelet targets (N ¼ 926) were commuting (fast direct
flight). We compared mean counts between Song Meter and
radar in potential nesting habitat (sensors FOR1 and FOR2),
and for the commuting corridor (sensor FP) using Welch’s
2-sample t-tests (Fig. 2B; Table 1H).
RESULTS
Survey Effort
In 2010–2012, we completed 74 radar surveys (including the
dawn activity period and other sampling periods at Grant
Lagoon), 124 audio-visual surveys (dawn and dusk), and 134
dawn Song Meter surveys, yielding 26,375 murrelet
detections (Table 1). We used subsets of radar surveys for
different comparative analyses: 35 surveys throughout the
24-hr cycle at Grant Lagoon to assess diurnal activity
patterns in 2010 (Table 1A); 36 overnight surveys to assess
diurnal activity trends across 26 sites (2011–2012; Table 1B);
and 12 surveys at Monashka Bay for comparison with audio-
visual and acoustic surveys (2011–2012; Table 1E–H).
Species Differentiation and Wind Effects
Murrelet targets flew on average 35 km/hr faster than other
species visually identified during radar surveys (mean
murrelet flight speed Æ SE: 83.0 Æ 0.5 km/hr, N ¼ 1,796).
Direct or sinusoidal flight paths were most common for
murrelets (89.9% of records; N ¼ 2,330), and we observed
circling behavior (9.1%) when radar stations were located
near forested potential nesting habitat. Differentiation
between Kittlitz’s and marbled murrelet targets by radar
was not possible, even at Grant Lagoon where Kittlitz’s
murrelet was known to nest (Lawonn 2013). In our pooled
data, species identity was confirmed by visual observations
for 1% of radar detections (most murrelets appeared as fast-
flying silhouettes) and all murrelet vocalizations recorded
were by marbled murrelets.
Audio-visual surveys were useful in identifying species that
could be confused for murrelets on radar, such as red-
throated loons (Gavia stellata), mergansers (Mergus spp.),
cormorants (Phalacrocorax spp.), and eagles (Haliaeetus
leucocephalus); however, audio-visual observers were unable
to determine the species identity of the majority of murrelet
targets on radar. Over the 3 field seasons and 200 hr of
observation, no Kittlitz’s murrelets were positively identified
by audio-visual surveys. All audio-visual detections summa-
rized in this study (N ¼ 2,239) were of marbled murrelets or
unidentified Brachyramphus murrelets. Audio-visual detec-
tions were greatest where murrelets engaged in social
interaction near potential forest-nesting habitat, producing
653 detections of behavior indicative of nearby occupancy of
nest sites (‘occupied detections’; Evans Mack et al. 2003).
Automated acoustic sensors recorded 4 types of marbled
murrelet vocalizations and 2 nonvocal sounds (wing beats
and jet sounds), yielding 5,870 detections. No Kittlitz’s
murrelet vocalizations were detected over 134 surveys (268 hr
of recordings).
High winds limited the reliability of using flight behavior
to differentiate murrelets from other species with radar.
Strong tail winds increased flight speeds of all birds and head
winds reduced them; in either case, differentiating murrelets
from slower flying birds became problematic. In 2010 surveys
at Grant Lagoon, we observed a positive relationship
between murrelet counts and wind speed (F1,17 ¼ 10.94,
r2
¼ 0.39, P ¼ 0.004). However, when we removed high
wind events (18 km/hr) from the analysis, the relationship
was no longer significant (F1,15 ¼ 0.083, r2
¼ 0.01, P ¼ 0.78).
Diurnal and Seasonal Activity Patterns
Diurnal activity patterns observed by radar showed murrelet
activity peaks at dawn (1.0 hr presunrise, mean Æ SE of
27.3 Æ 0.7% of total detections, N ¼ 36; Fig. 3) and dusk
(5.5 hr presunrise, 3.7 Æ 0.3% of detections, N ¼ 35). Dawn
counts were both greater and had a lower coefficient of
variation (CV ¼ 38%) than dusk counts (CV ¼ 81%).
Landward flight activity peaked 84 Æ 3 min (N ¼ 49) before
Cragg et al. Monitoring Techniques for Brachyramphus Murrelets 5
6. sunrise, whereas seaward flight activity peaked 48 Æ 6 min
presunrise (N ¼ 47). Diurnal activity patterns at Grant
Lagoon differed from those at sites with greater murrelet
abundance. At Grant Lagoon, a prolonged period of
relatively constant activity began at sunset (6 hr presunrise)
and lasted until 2 hr postsunrise, with the mean proportion of
total activity dispersed throughout the night (ranging from
7.0% to 15.9% of all activity; mean Æ SE of 11.1 Æ 0.8%).
In contrast, at other sites, activity was concentrated at
dawn (2 hr presunrise–1 hr postsunrise), accounting for
82.3 Æ 2.3% of all detections, with very little activity
occurring before this period (mean of 4.4 Æ 0.8% of
detections/hr).
Comparing seasonal activity across all 3 survey methods,
there was a consistent trend in increased activity through
June and July, with a peak of activity occurring in late July,
followed by a decline through August (Fig. 4).
Comparison Between Radar, Audio-Visual, and
Autonomous Acoustic Detections
There was no difference in annual mean counts of all
detections between audio-visual (AV) and Song Meter (SM)
surveys in 2011 (mean Æ SE: AV ¼ 56.3 Æ 11.5, SM ¼ 77.5
Æ 8.9; 2-sample t-test; t ¼ 1.45, df ¼ 10, P ¼ 0.18) or 2012
(mean Æ SE:AV ¼ 109.0 Æ 9.0,SM ¼ 100.0Æ 11.2;t ¼ 0.57,
df ¼ 10, P ¼ 0.58). Although there was no difference in
annual mean counts between survey methods, daily counts
from the 2 methods were not correlated when detections
from both years were pooled (S ¼ 168, rs ¼ 0.41, P ¼ 0.19).
Radar detected more murrelets during dawn surveys than
either audio-visual or automated acoustic methods, when all
flight paths were considered, primarily during dark twilight
(Fig. 3). However, when all 3 survey methods were compared
in likely nesting habitat at Monashka Bay (excluding distant
radar flight paths), there was no difference in mean
presunrise counts (one-way ANOVA; F2,27 ¼ 0.58,
P ¼ 0.57), although audio-visual and Song Meter counts
had higher variance (Fig. 5).
In addition to similar presunrise counts, similar behavior
was observed between radar and audio-visual surveys: there
was no difference in the mean number of circling murrelets
observed between radar (mean Æ SE: 38.1 Æ 7.6/survey) and
audio-visual surveys (33.4 Æ 7.1/survey) for pooled counts
from 2011 and 2012 at Monashka Bay (Wilcoxon signed-
rank test; V ¼ 59.5, P ¼ 0.68). Song Meter detections did not
provide information on the flight behavior of murrelets, with
the exception of rare detections of wing beats and jet sounds
(0.2 detections/hr, N ¼ 148 hr). By comparison, audio-visual
surveys detected site-occupancy behaviors (below-canopy
flight, circling, aerial dives; Evans Mack et al. 2003) on
average 18 times/hr (N ¼ 26 hr).
The greatest difference between radar and audio counts was
along a commuting flight path at Monashka Bay (where no
audio-visual surveys were done); commuting murrelets were
generally silent, and radar counts averaged 11 times higher
than Song Meter counts (mean Æ SE ¼ 174.4 Æ 11.8 radar
detections; 16.0 Æ 1.3 Song Meter detections). In contrast,
there was no difference between the mean number of radar
and Song Meter detections in likely forest-nesting habitat
(mean Æ SE ¼ 103.6 Æ 6.8 radar detections; 95.4 Æ 2.7 Song
Meter detections; t ¼ 0.56, df ¼ 11.8, P ¼ 0.58). Although
mean counts did not differ at Monashka Bay, there was no
correlation between Song Meter and radar counts in
potential nesting habitat across the breeding season, from
pooled 2011 and 2012 surveys (S ¼ 111.8, rs ¼ 0.32,
P ¼ 0.36). There was also no correlation between radar
and Song Meter counts made at 6 sites sampled in 2012
(S ¼ 8, rs ¼ 0.77, P ¼ 0.10), even when data from one outlier
site were removed (S ¼ 2, rs ¼ 0.90, P ¼ 0.08). However, our
sample size was small (N ¼ 10 within site, N ¼ 6 comparing
across sites), which greatly reduced our power to detect a
correlation.
DISCUSSION
Diurnal Activity Patterns
Diurnal activity trends described by radar surveys on Kodiak
Island (578N) showed that commuting murrelets were active
earlier and for longer periods (peak of activity beginning
120 min before sunrise and lasting 150 min) relative to
sunrise, compared with populations at lower latitudes.
In British Columbia, Canada, and Washington, USA
(47–498N), activity peaks recorded with radar typically
began 60 min before sunrise and lasted 60 min (Burger 1997,
2001; Cooper et al. 2001). Similarly, vocal activity detected
by acoustic sensors and audio-visual surveys peaked in the
hour preceding sunrise, earlier than activity peaks in
southeastern Alaska (S. K. Nelson, Oregon State University,
personal communication) and south of Alaska (Rodway et al.
1993, Naslund and O’Donnell 1995). Patterns of activity at
high latitude corresponded to earlier civil twilight and longer
twilight periods, suggesting that murrelets respond to light
cues in timing their inland flight activity. Protocols for
monitoring populations of murrelets should therefore be
Figure 3. Mean Æ standard error detections of Brachyramphus murrelets by
radar, audio-visual (AV), and Song Meter (SM) surveys relative to sunrise
(indicated by arrow). Radar surveys were conducted from 2010 to 2012 in the
Kodiak Archipelago, Alaska (USA) beginning 7 hr before sunrise to 1 hr
after sunrise, whereas AV surveys began 1 hr before sunrise until 1 hr after
sunrise, and SM surveys began 2 hr before sunrise until sunrise (Ã
no AV or
SM survey, ÃÃ
no AV survey, ÃÃÃ
no SM survey).
6 Wildlife Society Bulletin 9999
7. adjusted with earlier start times at higher latitudes to account
for longer twilight and activity periods of murrelets (Naslund
and O’Donnell 1995). At the latitude of the Kodiak
Archipelago this corresponds to starting radar surveys
120 min presunrise, 30 min earlier than standard protocols
established in British Columbia (Manley 2006).
Seasonal Activity Patterns
Logistical and funding constraints prevented sampling
throughout the entire breeding season by radar and audio-
visual methods, whereas automated acoustic sensors pro-
vided the most complete seasonal coverage in 2011 and 2012.
All 3 survey methods showed similar timing of seasonal
trends in activity. The increased murrelet activity in mid-
July, recorded by all 3 survey methods, indicates an increase
in murrelets commuting to the nesting habitat (evidence
from radar counts), as well as more vocal activity during this
phase of the breeding season (evidence from Song Meters
and audio-visual surveys). These trends reflect the timing of
phases in breeding chronology (Hamer and Nelson 1995,
Kuletz 2005), where peak activity corresponds to the onset of
chick-rearing and early fledging stages. South of Alaska from
California to British Columbia, seasonal trends have been
Figure 5. Boxplots of simultaneous daily Brachyramphus murrelet detections
from radar, audio-visual surveys (AV), and Song Meters (SM) during the 1
hr before sunrise in forested habitat at Monashka Bay, Alaska (USA), 2011
and 2012 pooled. Boxplot indicates median and interquartile range; whiskers
show minimum and maximum values.
Figure 4. Seasonal trends in detections of Brachyramphus murrelets for radar, audio-visual, and Song Meter surveys conducted in the Kodiak Archipelago,
Alaska (USA) from 2010 to 2012, with smoothed trend line (local polynomial regression).
Cragg et al. Monitoring Techniques for Brachyramphus Murrelets 7
8. detected in some cases by radar (Cooper et al. 2001) and
audio-visual surveys (reviewed in O’Donnell et al. 1995);
however, no seasonal trends were observed in other studies
restricted to the core periods of the breeding season (Jodice
and Collopy 2000, Burger 2001). The clear seasonal activity
trend in high-latitude murrelet populations highlights the
need for monitoring protocols to factor in seasonal changes
in abundance, either by keeping monitoring consistent
within similar periods of the breeding season (low activity vs.
high activity) or by sampling across the breeding season in
each year. Autonomous acoustic monitoring could provide a
useful and inexpensive way to identify the seasonal activity
patterns in different areas to inform the timing of radar
surveys for monitoring populations.
Comparison of Methods: Strengths and Limitations
Radar, audio-visual, and automated acoustic surveys provide
information on the relative abundance and behavior of
murrelets at 3 scales of activity: commuting flight (away from
nesting habitat), near or above nesting habitat, and at the
nest site. Of the 3 methods tested, radar detected much
higher numbers of murrelets flying silently on commuting
flyways over habitat unsuitable for nesting. Both acoustic
sensors and audio-visual observers recorded activity above or
near nesting habitat, whereas only audio-visual observations
could identify likely nesting behaviors.
Our study confirms the superiority of radar as a method for
censusing and monitoring populations of breeding murrelets.
Radar sampled a much larger area (1.5-km radius compared
with approximately 200 m for audiovisual and 60 m for Song
Meters; Evans Mack et al. 2003, Cragg et al. 2015) and radar
counts had lower variance than audio-visual or automated
acoustic surveys (Burger 1997, Cooper et al. 2001, Cooper
and Blaha 2002, Bigger et al. 2006a, b). Radar counts
represent an estimate of local-breeding-population size
within ‘catchment areas’ or watersheds directly inland of the
radar station. These counts have high statistical power to
detect population trends (Bigger et al. 2006a, Cooper et al.
2006), and provide information on habitat associations in
areas where murrelet flight paths are confined by fjords and
valleys (Burger 2001, Raphael et al. 2002, Burger et al. 2004).
The differences among the methods were accentuated during
the dark twilight when few murrelets called and human
observers were unable to see flying murrelets. Radar surveys
provided more detailed information on flight behavior,
including commuting flight direction, circling flight, and
spatial patterns over a wide area.
Despite their advantages over other survey methods, radar
studies can be limited by low sampling replication (either
temporally or spatially) due to cost, logistical constraints,
unsuitable topography, and the effects of weather (rain
masking radar detections, and unreliable counts during high-
wind events). In our comparison, automated acoustic sensors
obtained the best seasonal resolution of the 3 survey
methods, and at much lower cost than radar surveys (cost
per Song Meter unit US$700 and 1 hr to process each
survey, compared with radar equipment cost of $10,000
and 5 hr field-crew time/survey). In addition, costs of
transporting radar units are also high (heavy, bulky
equipment necessitates transport by boat, vehicle, or
floatplane). Site access can be difficult in areas with few
roads or a lack of suitable anchorages, and radar surveys also
require a clear field of view, which can be problematic in
forested areas. Other site features such as low topography can
be unsuitable for radar counts because murrelet flight paths
are dispersed over a wide area (Burger 1997, Raphael et al.
2002). Finally, radar surveys cannot detect below-canopy
flight behaviors indicative of nesting, which reduces the
likelihood of identifying stand occupancy.
Autonomous acoustic sensor systems can either comple-
ment radar studies (e.g., giving greater seasonal coverage) or
provide a low-cost alternative to radar surveys for fine-scale
assessments of relative abundance and seasonal patterns of
vocal activity at localized patches of habitat. The similarity in
presunrise rates of detection by all 3 methods at suitable
forest-nesting habitat gives support for the use of autono-
mous recorders for pilot or monitoring studies, provided that
the limitations of this method are considered. The similarity
in detections by audio-visual and automated acoustic
sampling was surprising, given that murrelets were also
detected visually by the audio-visual observer and the 2
methods have different sampling radii (approx. 200 m and
60 m, respectively). Two factors might explain the similarity.
First, our comparison was confined to the dark twilight hour
before sunrise, when visual detections were difficult. Second,
our comparison was conducted in high-quality nesting
habitat (high densities of potential nest platforms) where
murrelets were often observed flying low, circling, and
vocalizing frequently. In habitat with fewer potential nest
sites or along commuting flyways, murrelets might be less
likely to be detected by Song Meters because their vocal
behavior may be less conspicuous.
Acoustic sensors are able to detect vocal activity of
murrelets near or above nest sites, but cannot consistently
detect behaviors indicative of nearby nesting (stand
occupancy). Because murrelets are silent at or near their
nests, inferences about habitat use (nesting) from indices of
vocal activity should be made with caution. Audio-visual
surveys, which provide both vocal and behavioral informa-
tion remain the best method for detecting stand occupancy
(local nesting).
MONITORING RECOMMENDATIONS
There is no single ideal method for surveying and monitoring
Brachyramphus murrelets, particularly in Alaska. Radar
surveys provide the most reliable population estimates, but
the inability to separate the 2 species with radar and audio
methods will require complementary boat surveys in adjacent
nearshore waters to estimate the proportions of Kittlitz’s and
marbled murrelets. Radar surveys on Kodiak Island were
correlated with at-sea counts of murrelets within 5–15 km of
radar stations (Cragg 2013), but such correlations might not
apply where commuting distances between nests and
foraging grounds are greater (e.g., 78 km in southeastern
AK [Whitworth et al. 2000]; 16 km in Prince William Sound
[Kuletz 2005]). Local information on commuting distances
8 Wildlife Society Bulletin 9999
9. and the numerical proportions of the species at sea would
improve interpretation of radar censusing.
Boat-based surveys are likely to continue as a monitoring
tool in Alaska; therefore, we recommend that radar counts be
integrated into these population monitoring programs, using
vessels as radar platforms from which to conduct surveys of
local breeding populations at suitable shoreline anchorages.
Radar surveys should be conducted at carefully selected
stations that have suitable topographic features to confine
murrelet flight paths along predictable routes to provide the
most reliable estimates of abundance, population trends, and
habitat associations.
Localized seasonal trend data from automated sensors can
be used to inform the timing of radar surveys in subsequent
seasons, or can be used to calibrate surveys done within the
same season with regard to seasonal activity peaks. Breeding
chronology of murrelets can vary between local breeding
populations even at the same latitude (McFarlane Tranquilla
et al. 2005), potentially affecting the timing of seasonal
activity peaks, which is an important factor to consider in
timing radar surveys.
For murrelets, combinations of radar, audio-visual, and
automated acoustic surveys can be used for different
monitoring purposes, providing information on population
units and terrestrial habitat associations at finer spatial scales
than current at-sea monitoring in Alaska. For example, radar
surveys can be used to identify large or important populations
of murrelets by censusing flyways into watershed catchment
areas (Burger 1997, 2001), followed by assessment of vocal
activity within specific habitat patches by acoustic sensors
(Cragg et al. 2015). One application of this combination of
methods would be to investigate the use of nonforested
nesting habitat by marbled murrelets, which may be
potentially more widespread than previously assumed in
Alaska (Cragg 2013, Barbaree et al. 2014). Acoustic sensors
could reduce the need for repeated audio-visual assessments
of habitat, by providing an index of murrelet abundance
based on vocal activity in the study area that could be
followed by targeted audio-visual surveys of the most likely
habitat patches to determine occupancy.
The remote nesting locations and sympatric distribution of
Alaskan Brachyramphus murrelets creates unique challenges
for population monitoring and research, yet this region
supports the majority of global populations for these 2
threatened seabirds (Gaston and Jones 1998, Piatt et al.
2007). Adding radar, audio-visual, and automated acoustic
surveys to regional at-sea monitoring programs will provide
greater power to detect population trends and improve
knowledge of terrestrial habitat associations.
ACKNOWLEDGMENTS
The study was supported by a grant from the North Pacific
Research Board (NPRB); this is NPRB publication number
569. Additional financial, logistical, and equipment support
was provided by the U.S. Geological Survey, the Kodiak
National Wildlife Refuge, U.S. Fish and Wildlife Service,
and the University of Victoria. JLC was supported by grants
from Natural Sciences and Engineering Research Council of
Canada, and the University of Victoria graduate fellowships
and awards. For major contributions to this study we thank
A. Borker, R. Buxton, R. M. Corcoran, S. Hrushowy, M. J.
Lawonn, J. Lewis, E. Madison, M. M. Osmond, W. Pyle, A.
Roberts, and S. Snyder. We thank J. Leafloor, K. Nelson, C.
Ribic, and 2 anonymous reviewers for suggestions that
greatly improved the manuscript. Any use of trade names is
for descriptive purposes only and does not imply endorse-
ment by the U.S. Federal Government.
LITERATURE CITED
Barbaree, B. A., S. K. Nelson, B. D. Dugger, D. B. Roby, H. R. Carter, D. L.
Whitworth, and S. H. Newman. 2014. Nesting ecology of marbled
murrelets at a remote mainland fjord in Southeast Alaska. Condor
116:173–184.
Bigger, D., Z. M. Peery, J. Baldwin, S. Chinnici, and S. P. Courtney. 2006a.
Power to detect trends in marbled murrelet breeding populations using
audiovisual and radar surveys. Journal of Wildlife Management
70:493–504.
Bigger, D., Z. M. Peery, S. Chinnici, and S. P. Courtney. 2006b. Efficacy of
audiovisual and radar surveys for studying marbled murrelets in inland
habitats. Journal of Wildlife Management 70:505–516.
Borker, A. L., M. L. McKown, J. T. Ackerman, C. A. Eagles-Smith,
B. R. Tershy, and D. A. Croll. 2014. Vocal activity as a low cost
and scalable index of seabird colony size. Conservation Biology
28:1100–1108.
Burger, A. E. 1997. Behavior and numbers of marbled murrelets measured
with radar. Journal of Field Ornithology 68:208–223.
Burger, A. E. 2001. Using radar to estimate populations and assess habitat
associations of marbled murrelets. Journal of Wildlife Management
65:696–715.
Burger, A. E., T. A. Chatwin, S. A. Cullen, N. P. Holmes, I. A. Manley,
M. H. Mather, B. K. Schroeder, J. D. Steventon, J. E. Duncan, P. Arcese,
and E. Selak. 2004. Application of radar surveys in the management of
nesting habitat of marbled murrelets Brachyramphus marmoratus. Marine
Ornithology 32:1–11.
Buxton, R. T., and I. L. Jones. 2012. Measuring nocturnal seabird activity
and status using acoustic recording devices: applications for island
restoration. Journal of Field Ornithology 83:47–60.
Cooper, B. A., and R. T. Blaha. 2002. Comparisons of radar and audio-
visual counts of marbled murrelets during inland forest surveys. Wildlife
Society Bulletin 30:1182–1194.
Cooper, B. A., M. G. Raphael, and D. Evans Mack. 2001. Radar-based
monitoring of marbled murrelets. Condor 103:219–229.
Cooper, B. A., M. G. Raphael, and Z. M. Peery. 2006. Trends in radar-
based counts of marbled murrelets on the Olympic Peninsula,
Washington, 1996–2004. Condor 108:936–947.
Cragg, J. L. 2013. Brachyramphus murrelets at high latitude: ecological
adaptations and new methods for population monitoring in Alaska.
Thesis, University of Victoria, Victoria, British Columbia, Canada.
Cragg, J. L., A. E. Burger, and J. F. Piatt. 2015. Testing the effectiveness of
automated acoustic sensors for monitoring vocal activity of marbled
murrelets Brachyramphus marmoratus. Marine Ornithology 43:151–160.
Dechesne, S. B. C. 1998. Vocalizations of the marbled murrelet
(Brachyramphus marmoratus): vocal repertoire and individuality. Thesis,
University of Victoria, Victoria, British Columbia, Canada.
Evans Mack D. E., W. P. Ritchie, S. K. Nelson, E. Kuo-Harrison, P.
Harrison, and T. E. Hamer. 2003. Methods for surveying marbled
murrelets in forests: a revised protocol for land management and research.
Pacific Seabird Group Technical Publication No. 2, Portland, Oregon,
USA. http://www.pacificseabirdgroup.org. Accessed 22 Sep 2015.
Gaston, A. J., and I. L. Jones. 1998. The auks: Alcidae. Oxford University
Press, Oxford, England, United Kingdom.
Hamer, T. E., B. A. Cooper, and C. J. Ralph. 1995. Use of radar to study the
movements of marbled murrelets at inland sites. Northwestern Naturalist
76:73–78.
Hamer, T. E., and S. K. Nelson. 1995. Nesting chronology of the marbled
murrelet. Pages 49–56 in C. J. Ralph, G. L. Hunt, Jr., M. G. Raphael, and
J. F. Piatt, editors. Ecology and conservation of the marbled murrelet. U.S.
Department of Agriculture, Forest Service, Pacific Southwest Research
Cragg et al. Monitoring Techniques for Brachyramphus Murrelets 9
10. Station General Technical Report PSW-GTR-152, Albany, California,
USA.
Harper, W. L., B. K. Schroeder, I. A. Manley, and J. A. Deal. 2004. Direct
comparison of tilted and untilted radar for monitoring marbled murrelet
Brachyramphus marmoratus populations. Marine Ornithology 32:69–76.
Jodice, P. G. R., and M. W. Collopy. 2000. Activity patterns of marbled
murrelets in Douglas-fir old-growth forests in the Oregon Coast Range.
Condor 102:275–285.
Kissling, M. L. 2011. Population status and trends of the Kittlitz’s murrelet
Brachyramphus brevirostris. Marine Ornithology 39:2.
Kissling, M. L., M. Reid, P. M. Lukacs, S. M. Gende, and S. B. Lewis.
2007. Understanding abundance patterns of a declining seabird:
implications for monitoring. Ecological Applications 17:2164–2174.
Kuletz, K. J. 2005. Foraging behavior and productivity of a non-colonial seabird,
themarbledmurrelet(Brachyramphusmarmoratus),relativetoprey andhabitat.
Dissertation, University of Victoria, Victoria, British Columbia, Canada.
Kuletz, K. J., C. S. Nations, B. Manly, A. Allyn, D. B. Irons, and A.
McKnight. 2011a. Distribution, abundance and population trends of the
Kittlitz’s murrelet Brachyramphus brevirostris in Prince William Sound,
Alaska. Marine Ornithology 39:97–109.
Kuletz, K. J., S. G. Speckman, J. F. Piatt, and E. A. Labunski. 2011b.
Distribution, population status and trends of the Kittlitz’s murrelet
Brachyramphus brevirostris in Lower Cook Inlet and Kachemak Bay,
Alaska. Marine Ornithology 39:85–95.
Lawonn, M. J. 2013. Breeding ecology and nest site selection of Kittlitz’s
murrelets on Kodiak Island, Alaska. Thesis, Oregon State University,
Corvallis, USA.
Manley,I.2006.Inventorymethodsformarbledmurreletradarsurveys.Standards
for components of British Columbia’s biodiversity No. 10a. Resources
Information Standards Committee, Ministry of Environment Ecosystems
Branch, Victoria, British Columbia. https://www.for.gov.bc.ca/hts/risc/pubs/
tebiodiv/murrelet2k6/mamu_radarsurv.pdf. Accessed 22 Sep 2015.
McFarlane Tranquilla L., N. R. Parker, R. W. Bradley, D. B. Lank, E. A.
Krebs, L. Lougheed, and C. Lougheed. 2005. Breeding chronology of
marbled murrelets varies between coastal and inshore sites in southern
British Columbia. Journal of Field Ornithology 76:357–367.
Naslund, N. L., and B. P. O’Donnell. 1995. Daily patterns of marbled
murrelet activity at inland sites. Pages 129–134 in C. J. Ralph, G. L. Hunt,
Jr., M. G. Raphael, and J. F. Piatt, editors. Ecology and conservation of the
marbled murrelet. U.S. Department of Agriculture, Forest Service, Pacific
Southwest Research Station General Technical Report PSW-GTR-152,
Albany, California, USA.
Nelson, S. K. 1997. Marbled murrelet (Brachyramphus marmoratus). Account
276 in A. Poole and G. Gill, editors. The birds of North America.
Academy of Natural Sciences, Philadelphia, Pennsylvania, and American
Ornithologists’ Union, Washington, D.C., USA.
O’Donnell, B. P., N. L. Naslund, and C. J. Ralph. 1995. Patterns of
seasonal variation of activity of marbled murrelets in forested stands. Pages
117–128 in C. J. Ralph, G. L. Hunt, Jr., M. G. Raphael, and J. F. Piatt,
editors. Ecology and conservation of the marbled murrelet. U.S.
Department of Agriculture, Forest Service, Pacific Southwest Research
Station General Technical Report PSW-GTR-152, Albany, California,
USA.
Oppel, S., S. Hervias, N. Oliveira, T. Pipa, C. Silva, P. Geraldes, M. Goh,
E. Immler, and M. McKown. 2014. Estimating population size of a
nocturnal burrow-nesting seabird using acoustic monitoring and habitat
mapping. Nature Conservation 7:1–13.
Paton, P. W. C. 1995. Marbled murrelet inland patterns of activity: defining
detections and behavior. Pages 113–116 in C. J. Ralph, G. L. Hunt, Jr.,
M. G. Raphael, and J. F. Piatt, editors. Ecology and conservation of the
marbled murrelet. U.S. Department of Agriculture, Forest Service, Pacific
Southwest Research Station General Technical Report PSW-GTR-152,
Albany, California, USA.
Piatt, J. F., M. Arimitsu, G. Drew, E. N. Madison, J. Bodkin, and
M. D. Romano. 2011. Status and trend of the Kittlitz’s murrelet
Brachyramphus brevirostris in Glacier Bay, Alaska. Marine Ornithology
39:65–75.
Piatt, J. F., and R. G. Ford. 1993. Distribution and abundance of marbled
murrelets in Alaska. Condor 95:662–669.
Piatt, J. F., K. J. Kuletz, A. E. Burger, S. A. Hatch, V. L. Friesen, T. P. Birt,
M. L. Arimitsu, G. S. Drew, A. M. A. Harding, and K. S. Bixler. 2007.
Status review of the marbled murrelet (Brachyramphus marmoratus) in
Alaska and British Columbia. U.S. Geological Survey Open-File Report
2006-1387. http://pubs.usgs.gov/of/2006/1387/pdf/ofr20061387.pdf.
Accessed 22 Sep 2015.
Raphael, M. G., D. Evans Mack, and B. A. Cooper. 2002. Landscape-scale
relationships between abundance of marbled murrelets and distribution of
nesting habitat. Condor 104:331–342.
Rodway, M. S., H. M. Regehr, and J.-P. L. Savard. 1993. Activity patterns
of marbled murrelets in old-growth forest in the Queen Charlotte Islands,
British Columbia. Condor 95:831–848.
Stenhouse, I. J., S. Studebaker, and D. Zwiefelhofer. 2008. Kittlitz’s
murrelet Brachyramphus brevirostris in the Kodiak Archipelago, Alaska.
Marine Ornithology 36:59–66.
Whitworth, D. L., S. K. Nelson, S. H. Newman, G. B. Van Vliet, and W. P.
Smith. 2000. Foraging distances of radio-marked marbled murrelets from
inland areas in Southeast Alaska. Condor 102:452–456.
Willson, M. F., K. M. Hocker, and R. H. Armstrong. 2010. Ground-nesting
marbled murrelets in Juneau, Alaska. Western Birds 41:44–48.
Associate Editor: Leafloor.
10 Wildlife Society Bulletin 9999