2018 Aon Tech Survey Infographic
•
0 likes•50 views

Insight into emerging benefit trends in the technology sector taken from Aon's 2018 Technology Survey.
Recommended

Recommended
More Related Content
What's hot
What's hot (14)
Similar to 2018 Aon Tech Survey Infographic
Similar to 2018 Aon Tech Survey Infographic (20)
More from sarah marville
More from sarah marville (6)
Recently uploaded
Recently uploaded (20)
2018 Aon Tech Survey Infographic
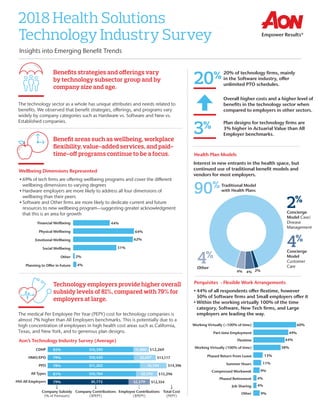
- 1. 2018 Health Solutions Technology Industry Survey Insights into Emerging Benefit Trends The technology sector as a whole has unique attributes and needs related to benefits. We observed that benefit strategies, offerings, and programs vary widely by company categories such as Hardware vs. Software and New vs. Established companies. • 69% of tech firms are offering wellbeing programs and cover the different wellbeing dimensions to varying degrees • Hardware employers are more likely to address all four dimensions of wellbeing than their peers • Software and Other firms are more likely to dedicate current and future resources to new wellbeing program—suggesting greater acknowledgment that this is an area for growth Benefits strategies and offerings vary by technology subsector group and by company size and age. Benefit areas such as wellbeing, workplace flexibility, value-added services, and paid- time-off programs continue to be a focus. Technology employers provide higher overall subsidy levels of 81%, compared with 79% for employers at large. The medical Per Employee Per Year (PEPY) cost for technology companies is almost 7% higher than All Employers benchmarks. This is potentially due to a high concentration of employees in high health cost areas such as California, Texas, and New York, and to generous plan designs. Aon’s Technology Industry Survey (Average) Interest in new entrants in the health space, but continued use of traditional benefit models and vendors for most employers. Health Plan Models 2% Concierge Model Case/ Disease Management 4% Concierge Model Customer Care 4% Other 2%4%4% Traditional Model with Health Plans90% 90% Wellbeing Dimensions Represented 65% 36% HVI-All Employers Company Subsidy (% of Premium) Total Cost (PEPY) Company Contributions ($PEPY) Employee Contributions ($PEPY) All Types PPO HMO/EPO CDHP • 44% of all respondents offer flextime, however 50% of Software firms and Small employers offer it • Within the working virtually 100% of the time category, Software, New Tech firms, and Large employers are leading the way. Perquisites - Flexible Work Arrangements 11% 9% 4% 4% 9% 20% of technology firms, mainly in the Software industry, offer unlimited PTO schedules. Overall higher costs and a higher level of benefits in the technology sector when compared to employers in other sectors. Plan designs for technology firms are 3% higher in Actuarial Value than All Employer benchmarks. 20% 3% $12,269 $13,117 $14,396 $13,296 $12,354 $1,880 $2,697 $3,194 $2,592 $2,579 $10,390 $10,420 $11,202 $10,704 $9,775 85% 79% 78% 81% 79% Financial Wellbeing 44% Physical Wellbeing 64% Emotional Wellbeing 62% Social Wellbeing 51% Other 2% Planning to Offer in Future 4% 60% 49% 44% Summer Hours Compressed Workweek Phased Retirement Job Sharing Other Working Virtually (<100% of time) Part-time Employment Flextime Working Virtually (100% of time) Phased Return From Leave 38% 13%