SlideShare a Scribd company logo
1 of 22
Download to read offline
RESEARCH ARTICLE
SOCIAL MEDIA, TRADITIONAL MEDIA, AND MUSIC SALES
1
Sanjeev Dewan
Paul Merage School of Business, University of California, Irvine,
Irvine, CA 92697 U.S.A. {sdewan@uci.edu}
Jui Ramaprasad
Desautels Faculty of Management, McGill University,
Montreal, QC H3A 1G5 CANADA {jui.ramaprasad@mcgill.ca}
Motivated by the growingimportance of social media,this paper examines the relationship between new media,
old media, and sales in the context of the music industry. In particular, we study the interplay between blog
buzz, radio play, and music sales at both the album and song levels of analysis. We employ the panel vector
autoregression (PVAR) methodology, an extension of vector autoregression to panel data. We find that radio
play is consistently and positively related to future sales at both the song and album levels. Blog buzz, however,
is not related to album sales and negatively related to song sales, suggesting that sales displacement due to free
online sampling dominates any positive word-of-mouth effects of song buzz on sales. Further, the negative
relationship between song buzz and sales is stronger for niche music relative to mainstream music, and for less
popular songs within albums. We discuss the implications of these results for both research and practice
regarding the role of new media in the music industry.
Keywords: Social media, traditional media, music industry, panel vector auto-regression, blog buzz, music
sales
Introduction1
New media driven by user-generated content is starting to
displace traditional media in terms of the way consumers
learn about products and services, and even how they
consume them. The music industry is a bellwether for this
revolution, where social media are increasingly used for
sharing information about music albums and songs—and also
for the sharing of the music itself. Traditionally, users dis-
covered music either through radio play or from their friends,
and consumed it through album purchases (see Peitz and
Waelbroeck 2004). Now, users are increasingly discovering
music through social media (such as music blogs and online
music services) and consuming digital versions of songs and
albums, often made available online by other consumers.
These dynamics are not only changing consumer behavior but
also impacting the size and shape of music sales (see Dewan
and Ramaprasad 2008, 2012). Our objective in this study is
to examine the interaction between new media, traditional
media, and sales as it applies to the music industry.
The recent disruption of the music industry can be traced back
to the arrival of online peer-to-peer technologies such as
Napster. The key to the disruption were two characteristics
of music: the information goods nature of the product and
that it is an experience good. The fact that songs are infor-
mation goods makes them shareable, free, and able to be
distributed unbundled from the album. With the arrival of
social media, people have many alternatives for discovering
new artists, sharing recommendations, and consuming music.
Discovery and sharing now often go hand-in-hand, where
individuals can not only share their recommendations, but can
share the actual music and allow others to sample it. Many of
these interactions between individuals have been enabled
through social media, including individual blogs, sites such as
1
Ravi Bapna was the accepting senior editor for this paper. Gautam Ray
served as the associate editor.
MIS Quarterly Vol. 38 No. 1, pp. 101-121/March 2014 101
Dewan and Ramaprasad/Social Media, Traditional Media, and Music Sales
Last.fm, the Hype Machine, Mog, and Pandora, and video
streaming sites like YouTube.
The decline of sales in the music industry over the last decade
has often been attributed to peer-to-peer sharing of music
online (Siwek 2007), with record labels arguing that this has
cost the record industry $55 billion in revenue over the last
decade (Ehlrich 2011). In 2010 alone, revenues from global
recorded music fell by over 8 percent, amounting to almost
$1.5 billion. The increase in digital sales of 5.3 percent ($4.6
billion) did not compensate for the decline in physical sales of
14.2 percent or $10.4 billion.2
Looking at just the United
States shows a similar story: overall shipments of recorded
music in the United States fell 11 percent to $6.9 billion,
while growth in digital formats only partially offset a decline
of 20 percent by value in physical formats. Our empirical
analysis addresses in part the impact of new media on music
sales, both at the album and song level. Specifically, our
research questions are
• What are the relative impacts of social versus traditional
media on music sales?
• How do these impacts vary at the song-level versus the
album-level, and for mainstream versus niche music?
To address these questions, we have assembled music album
and song sales data from Nielsen SoundScan, and obtained
radio play data from the same source as well. Our social
media variables are constructed fromthe volume of blog posts
about the album or song in question, which we call blog buzz,
and it is measured using Google Blog Search. This is consis-
tent with the approach of Stephen and Galak (2012) and Dhar
and Chang (2009) who also operationalize online buzz
through measures of volume of postings online. Our blog
buzz measure captures—among other things—music blog
activity, which is arguably the primary mechanism by which
consumers share music and music-related information with
each other. While blog buzz is no doubt a narrower measure
than social media buzz (which includes music sharing on
Facebook, Twitter, MySpace, etc.), we find that blog buzz is
highly correlated with other online music activity, such as
Last.fm listens and Amazon music sales rank, suggesting that
blog buzz is likely a good proxy for overall social media
music interaction.
Our empirical analysis is conducted using the panel vector
autoregression (PVAR) model, which is an extension of tradi-
tional VAR for panel data. The advantages of using the
PVAR approach, as opposed to traditional multiple regres-
sion, are as follows: First, we are able to treat all of the key
variables (buzz, radio play, and sales) as jointly endogenous,
and assess the nature of bidirectional causality between all
pairs of variables. Second, the model allows for lagged ef-
fects within and across time series, so we can understand the
dynamic relationships between all variables. Third, we are
able to illustrate the effects of a shock in one variable on other
variables as a function of time, using impulse response
functions.
A summary of our findings is as follows: We find that the
relationship between traditional media and sales and social
media and sales differ from each other. These relationships
are also different at the song level versus the album level.
Specifically, we find that traditional media (radio play) has a
positive relationship with both song and album sales.
Interestingly, the relationship between social media (blog
buzz) and album sales is largely insignificant, while the rela-
tionship between social media and sales at the song level is
negative. Further, this negative relationship is more signifi-
cant for niche music as compared to mainstream music and
for the less popular songs in an album.
Our explanation for this surprising negative relative relation-
ship between song buzz and song sales centers on the dual
nature of social media, as a platform for sharing not just
information and opinions about music, but also for sharing the
music itself. A spike in blog buzz about a piece of music is
typically accompanied by a contemporaneous spike in the
supply of free shareable music online. The negative associa-
tion between song buzz and sales is likely due to the fact that
the sales displacement caused by free online sampling
dominates any potential incremental sales due to positive
word-of-mouth influence of buzz on sales. It is important to
note that our resultsreflect short-termdynamics between buzz
and sales, and they do not rule out the possibility of positive
impacts of song/album buzz on sales in the long term.
The rest of the paper is structured as follows. The next
section provides an overview of the relevant prior literature
and lays out the theoretical underpinnings of our work. We
then develop our PVAR empirical specification, after which
we describe the data we have assembled for this study and
discuss our results and robustness checks. In the final section,
we provide some discussion and concluding remarks.
Background and Prior Literature
Related Prior Work
Our analysis draws from and contributes to the literature
dealing with (1) social media and market outcomes and2
http://76.74.24.142/DB3D7CCB-1E88-03DF-387D-E0F1FBBC4775.pdf.
102 MIS Quarterly Vol. 38 No. 1/March 2014
Dewan and Ramaprasad/Social Media, Traditional Media, and Music Sales
(2) impact of social media in the music industry. A key issue
addressed in the first stream of the literature has to do with the
influence of consumer opinions (reviews, recommendations)
and actions (consumption choices) on product sales. A num-
ber of papers have examined the influence of product reviews
on sales, such as Godes and Mayzlin (2004) for TV show
ratings, Chevalier and Mayzlin (2006) for books, and
Chintagunta et al. (2010), Dellarocas et al. (2007), Duan et
al. (2008), Liu (2006), and Moon et al. (2010) for movies.
Typical results in this body of work are as follow: product
sales are positively related to the volume and valence (e.g.,
star rating) of reviews; negative reviews are more influential
than positive ones; consumer word of mouth is more impor-
tant for niche products; featured reviews and reviews posted
by reputable reviewers are more impactful (Forman et al.
2008); and the actual text of reviews offers incremental
explanatory power beyond the average ratings (Ghose and
Ipeirotis 2011). In a different context, Dewan and Hsu (2004)
studied the impact of seller ratings (a product of word-of-
mouth) on probability of sale and price in online auctions on
eBay. Finally, some studies have looked at the role of obser-
vational learning, or learning from the past actions of other
consumers, on product sales; for example, Chen et al. (2010)
found that the display of product popularity information on
Amazon is associated with increased incremental sales.
More recent research has examined the association between
social media activity and market outcomes. For example,
Onishi and Manchanda (2012) look at the impact of blogging
on product sales of three products in Japan: green tea drinks,
movies, and cellular phone subscriptions. They find a clear
link between blogging volume and valence on product sales.
They also examine the interaction between new media and
traditional media and find that TV advertising has the effect
of spurring additional blogging activity, especially in the pre-
release period. Rui et al. (2011) examine the relationship
between Twitter messages and sales, finding that valence of
the tweet, influence level of the tweeter, and the intention
expressed by the tweeter to watch a specific film all matter
when examining the influence on sales. The study closest to
our research questions, Dhar and Chang (2009), asks whether
blog “chatter” is predictive of future album sales. Sales are
imputed from Amazon album sales rank and blog chatter is
measured by the total number of blog posts about the album
using Technorati blog search. The results suggest that blog
chatter is predictive of future sales, as is the volume of main-
stream reviews, but the number of MySpace friends is not
significant. While our study has similar goals to Dhar and
Chang, there are a number of key differences. We have
obtained actual music sales data (from Nielsen SoundScan) at
both the album and song level. Further, we look at blog buzz
at both the album and song levels. Our analysis incorporates
both new media (blog buzz) and traditional media (radio play)
and examines the possibility of bidirectional causality using
Granger causality and panel vector autoregression (PVAR).
Our research also contributes to the literature that has
examined the impact of emerging technologies on the music
industry. Given the decline in music sales, there is significant
research attention given to questions of whether and to what
extent new technologies and media are responsible for the
sales decline. With respect to peer-to-peer music sharing
technologies, Rob and Waldfogel (2006) estimate that each
album download displaces purchases by 0.2 albums. Simi-
larly, Zentner (2006) finds that peer-to-peer usage reduces the
probability of buying music by 30 percent. In a more recent
study, Waldfogel (2010) reexamines the issue of sales dis-
placement due to illegal file sharing in the presence of a legal
download service: iTunes. The real-world experiment, which
used University of Pennsylvania undergraduates as subjects,
found that an additional song illegally downloaded reduces
paid consumption by between a third and a sixth of a song,
which is similar in magnitude to the earlier study. The study
by Liebowitz (2004) similarly found that file sharing and mp3
downloads have resulted in sales displacement at the rate of
15 to 20 percent.
Other research is examining the impact of social media on
music sales, of which the Dhar and Chang study is one
example. In the same vein, Morales-Arroyo and Pandey
(2010) and Abel et al. (2010) also examine the value of
electronic word-of-mouth (WOM) and online chatter, respec-
tively, in predicting future music album sales. Chellappa and
Chen (2009) show that sampling on MySpace has a positive
relationship with music purchases. Chen et al. (2011) also
look at MySpace data and find that music sales are positively
related with bulletins and friend’s updates on the artist’s
profile pages. These effects are amplified by the number of
friends that the artist has on MySpace.
Dewan and Ramaprasad (2012) shift the focus from sales to
a different form of music consumption, which is full-track
online sampling, a form of free consumption enabled by the
ability of users to upload and share digital versions of songs
(see also Peitz and Waelbroeck 2006). Based on data from
one of the largest music blog aggregators, and motivated by
theories of observational learning, Dewan and Ramaprasad
(2012) document robust empirical results showing that music
sampling is positively associated with music and blog popu-
larity, and these effects are stronger for niche music as com-
pared to mainstream music, raising some intriguing questions
about the potential long-tailing of music sampling and sales.
Dewan and Ramaprasad (2008) is similar in spirit to the
MIS Quarterly Vol. 38 No. 1/March 2014 103
Dewan and Ramaprasad/Social Media, Traditional Media, and Music Sales
present study, but the research design is limited to albums (not
songs) and social media alone (not radio play).
Theoretical Background
The objective of this paper, as illustrated in the conceptual
framework of Figure 1, is to understand the interactions
between new media (blog buzz), traditional media (radio
play), and music sales at both the album and song levels. We
are also interested in understanding how these interactions are
moderated by music characteristics such as niche versus
mainstream music, as indicated by the type of record label
(major or independent) and artist reputation. Within this
broad framework, we are most interested in the effect of buzz
on music sales, which is where we start our discussion.
We can posit both a positive and a negative association
between social media buzz and music sales. The positive
effect of buzz on sales is due to the WOM effect, whereby
social interactions and influence between consumers affect
consumer decision making. The blogging and sharing of a
piece of music implicitly conveys a positive opinion about the
piece, potentially influencing other consumers to not only
sample the music, usually through full-track streaming
(Dewan and Ramaprasad 2012), but to purchase it as well
(Dhar and Chang 2009). Indeed, a recent music consumer
survey (Nielsen 2012) indicates that positive recommen-
dations from a friend and positive feedback from a blog or
chat room are among the most likely factors to influence
music purchase decisions, which is consistent with King and
Balasubramanian’s (1994) argument that other-based prefer-
ence formation is particularly important for experience goods.
In the aggregate, the higher the buzz about a piece of music,
the greater the potential influence on consumers, which
should ultimately translate into higher sales of the music that
is blogged about.
We turn now to the potential negative effect of buzz on sales,
which on the face of it appears quite counterintuitive. It arises
from the information goods nature of music and the dual
nature of social media, not only as a disseminator of infor-
mation about music (i.e., a source of WOM) but as a platform
for sharing the music as well. Here, music is typically con-
sumed through the use of full-track streaming, which we have
referred to as sampling in prior work (see Dewan and Rama-
prasad 2012). In other words, social media such as music
blogs can be used by consumers not only to share music
consumption choices and opinions, but also to share the actual
music itself. Indeed, the typical music blog post includes a
discussion of songs, albums, or artists along with mp3 links
for the streaming of specific songs that the blogger chooses to
share. It is not uncommon for an entire blog post to consist of
a listing of mp3 links for all of the songs from an album.
Thus, a spike in buzz about a piece of music increases the
volume of information about it, and at the same time the spike
in buzz also results in a jump in the supply of free music that
is easily accessible by interested consumers. Indeed, music
consumption through full-track streaming is a free substitute
for consumption through sales, and this sampling-driven sales
displacement leads to the negative effect of buzz on sales.
Whether or not this negative effect dominates the afore-
mentioned positive WOM effect is ultimately an empirical
question, which we hope to answer through our analysis.
The next question of theoretical interest is how the rela-
tionship between buzz and sales is different across different
categories of music characteristics. The key characteristics
that we focus on are music preference (mainstream or niche)
and consumption preference (albums or songs). Table 1 sum-
marizes how these characteristics interact to affect the modes
of music discovery (traditional media or social media) and
consumption (CDs or digital downloads). Mainstream music
is that music preferred by the mass market, and thus more
likely to be publicized and discovered through traditional
media, while niche music has an inherently smaller market of
interested consumers. Niche music is almost exclusively
discovered through social media, not only through blog posts,
but also through videos on YouTube or recommendations
through online music sites. This is because niche music does
not get the attention of traditional media unless it becomes
wildly popular (see Stephen and Galak 2012). In terms of
consumption, albums tend to be consumed in the form of
CDs—60 percent of purchased albums are physical CDs―
although digital downloads of entire albums is catching up
because it is seen as a better value than physical CDs (Nielsen
2012). Songs, on the other hand, are almost exclusively
consumed via digital downloads (Nielsen 2012).
Thus, given that songs are discovered and consumed online,
whereas the majority of this process is offline for albums, and
since free sampling is a closer substitute for digital down-
loads, we expect that the sales displacement effect will be
stronger at the song level as compared to the album level. On
the other hand, these differences between albums and songs
do not affect the impact of positive WOM, and therefore the
WOM effect would be comparable for albums and songs.
Together, we can predict a positive association between buzz
and sales for albums, but the corresponding prediction at the
song level is ambiguous, due to the countervailing positive
WOM effect and negative free online consumption effect.
104 MIS Quarterly Vol. 38 No. 1/March 2014
Dewan and Ramaprasad/Social Media, Traditional Media, and Music Sales
Song
Buzz
Album
Buzz
Song
Sales
Album
Sales
Radio
Play
Music
Characteristics
Figure 1. Conceptual Framework
Table 1. Primary Modes of Music Discovery and Consumption
Consumption
Preference
Music
Preference
Albums Songs
Mainstream
Traditional Media Social and Traditional Media
CD’s Digital Downloads
Niche
Social Media Social Media
CD’s Digital Downloads
Note: In each quadrant, the top and bottom cells indicate the modes of music discovery and consumption, respectively.
The scenario at the song level may become less ambiguous
when distinguishing between mainstream versus niche songs.
Indeed, as Table 1 shows, the difference between the two
types of songs is that whereas the most popular mainstream
songs might be discovered via traditional media, niche songs
are almost always discovered via social media. Thus, for
niche songs, music discovery and consumption are both
online (usually separated by a single click), but for main-
stream songs, discovery and consumption are less synchro-
nized and typically occur on different media. Therefore, it is
reasonable to conclude that the sales displacement effect of
free sampling would be stronger for niche songs as compared
to mainstream songs, and we can more confidently predict a
negative relationship between buzz and sales for niche songs
relative to mainstream songs.
The different effect of social media versus traditional media
on market outcomes is also one that has been recently ex-
plored. Trusov et al. (2009) find that the WOM effect lasts
longer than the effects of traditional marketing when looking
at the impact on sign-ups to a social networking site. Stephen
and Galak (2012) find that social media activity does impact
sales (loans on Kiva.org), but only through the effect that
social media has on traditional media. In the case of music,
while the effect of social media on song sales is uncertain, as
discussed above, we would expect a positive relationship
between traditional media (radio play) and sales, due to the
tremendous exposure enjoyed by the select few songs singled
out to be played on radio, TV, cable, or other traditional
media. Accordingly, we expect differences in the impact of
traditional and social media on music consumption, which we
hope to tease out in our analysis.
Our study is more comprehensive in scope than prior studies
in at least three ways. First, we look at the relationship be-
tween buzz and sales at both the album and song levels, while
MIS Quarterly Vol. 38 No. 1/March 2014 105
Dewan and Ramaprasad/Social Media, Traditional Media, and Music Sales
allowing for interactions across the levels. This is clearly
important given the dramatic shift in music sales from albums
to songs. Second, our research design incorporates both new
media (social media) and traditional media (radio play), and
thereby isolates the effect of social media beyond the effects
of mainstream media. Finally, while prior work has been
focused solely on the role of social media as a word of mouth
platform, our study brings out the dual role of social media as
both a disseminator of music information, and as a mechanism
for sharing music in digital form.
We employ the PVAR method for our empirical analysis.
The PVAR model is suitable for studying the relationships
between a system of interdependent variables without im-
posing ad hoc model restrictions; for example, assuming
exogeneity of some of the variables, which other econometric
modeling techniques require (Adomavicius et al. 2012). In
other words, this method allows us to treat all of the key
variables as jointly endogenous, and to explicate dynamic
effects, such as the impact of a shock in one variable on other
variables over time. While the use of PVAR is fairly nascent,
it has recently been employed in the management literature,
particularly in Finance and Marketing. In Finance, Love and
Zicchino (2006) examine the relationships between a coun-
try’s financial development and its dynamic investment
behavior, and Stanca and Gallegati (1999) study the link be-
tween firms’ financial decisions and their investment deci-
sions. In Marketing, PVAR has been used to study the per-
sistent effects of marketing investments on sales (Dekimpe
and Hanssens 1995), the differential impact of marketing-
induced versus WOM-induced customer acquisition (Villa-
nueva et al. 2008), and the effects of WOM versus traditional
marketing (Trusov et al. 2009). Chen et al. (2011) also use
the PVAR approach to examine artists’ MySpace broadcasts
on music sales as imputed from Amazon Sales Rank. The
following section provides a detailed discussion of how we
use the PVAR method for the problem at hand.
Empirical Methodology
We examinetheinteractions between social media, traditional
media, and sales (see Figure 1) at both the song and album
levels. To do this, we first conduct Granger causality tests to
examine the potential endogeneity between pairs of each of
our three key variables, first at the song level and then at the
album level. Next, we conduct the PVAR analysis, which
allows us to understand the dynamic relationships between all
variables. In examining the results of the PVAR analysis, we
estimate and interpret the regression coefficients, create and
analyze impulse response functions, and calculate elasticities
between our key variables. As in traditional VAR, PVAR
allows us to treat all variables as endogenous, but PVAR also
allows estimation for multiple cross sections of data—some-
thing not possible in traditional VAR. The panel nature of the
data allows us to handle unobserved individual heterogeneity,
while treating all variables as endogenous (Love and Zicchino
2006).
Our PVAR model is specified (for each song or album) as
follows:
(1)
S
B
R
S
B
R
t
t
t
j
J
t j t j t j
r j t j t j
t j t j t j
t j
t j
t j
S t
B t
R t










=




















+










=
− − −
− − −
− − −
−
−
−
 1
11 12 13
21 22 23
31 32 33
π π π
π π π
π π π
ε
ε
ε
,
,
,
where St, Bt, and Rt denote weekly song sales, weekly song
buzz, and weekly radio play, in week t(t = 1, 3, …, T),
respectively. J is the order of the model, which may be
determined using Akaike’s information criterion (AIC). For
the analysis at the album level, the variables St and Bt are
replaced by their album-level counterparts. Thus, in the song-
level (album-level) analysis, song (album) sales is a function
of past song (album) sales, past song (album) buzz, past radio
play, and an error term. In the PVAR model, the coefficients
represent the relationship between the lagged values of each
of the variables (song sales, radio play, and buzz) and the
variable on the left-hand side. When looking at the impact on
song sales, for example, the coefficient on the first lag of
radio play indicates the percentage increase in song sales in
the following week corresponding to a 1 percent increase in
radio play in the current week. Details of the variable opera-
tionalization are provided in the “Data” section.
We determine the appropriate lag length J using Akaike’s
information criterion (AIC), following the standard approach
in the VAR literature (see Holtz-Eakin et al. 1988; Love and
Zicchino 2006). Specifically, we calculate AIC for each cross
section and take the modal value of the optimal lag length
among all cross sections. We performed two transformations
to the main variables. First, we took the natural log of the
buzz, sales, and radio play variables. In order to remove indi-
vidual fixed effects that might affect our relationship of
interest (such as song or album quality and advertising
budgets), we performed the Helmert transformation on the
song buzz, album buzz, song sales, and radio play variables
following Arellano and Bover (1995) and Love and Zicchino
(2006). The Helmert transformation involves the forward
mean-differencing of the variables; that is, fixed effects are
removed by subtracting the mean of all future observations
available for each song-week. This transformation ensures
106 MIS Quarterly Vol. 38 No. 1/March 2014
Dewan and Ramaprasad/Social Media, Traditional Media, and Music Sales
orthogonality between the forward-differenced variables and
their lagged values (see Love and Zicchino 2006). Therefore,
to address the issue of simultaneity, the lagged regressors are
used as instruments for the forward-differenced variables and
the system GMM estimator is used to allow for error
correlation across equations.
The PVAR analysis is supplemented with the analysis of
impulse response functions (IRFs) to elucidate the dynamics
in the relationships of interest. IRFs show the response of one
variable to an exogenous shock (i.e., a one standard deviation
shock) to another variable in the system, while holding all
other shocks at zero. Using IRFs, we are able to visualize the
dynamics of the pairwise relationships. In other words, we
can isolate the reaction of song (album) sales to an orthogonal
shock in the song (album) buzz while holding radio play con-
stant; similarly, we can isolate the reaction of song (album)
sales to an orthogonal shock in radio play, while holding buzz
constant. Together, PVAR and impulse response functions
allow us to gain a comprehensive understanding of the rela-
tionships between traditional media, social media, and sales.
In addition to the full-sample analysis described above, we
conducted a set of subsample analyses in order to understand
the nuances in the set of the relationships represented in the
conceptual model of Figure 1. That is, we are interested in
understanding whether the relationships we observe are con-
sistent for different types of music—music that is considered
more and less niche. To do this, we conduct subsample
analyses based on record label (major versus independent)
and artist reputation (high and low).
Data
To conduct the PVAR analysis, we use two panel datasets. At
the song level, we have a dataset including approximately
1,000 cross sections across 24 time periods (weeks). That is,
for a set of approximately 1,000 songs, we have obtained
weekly data on the volume of song-level blog buzz from
Google Blog search (used also in Stephen and Galak), song-
level unit sales, and radio play (measured by the number of
“spins”) from Nielsen SoundScan, for a period of 24 weeks
in 2006. Specifically, the data covers the period of June 19,
2006, to December 3, 2006. At the album level, we have
created a panel of 594 albums across 24 weeks, using the
albums that correspond to the songs in the song-level dataset.
To construct this dataset, we obtained weekly data on the
volume of album-level blog buzz using Google Blog Search
as well as album unit sales from Nielsen SoundScan. To
create the album-level radio play variable, we aggregated the
song radio play data in the song-level dataset to the album
level. We have supplemented these datasets to include infor-
mation on record label and release date from allmusic.com
and Amazon.com.
The blog buzz data was collected through Google Blog
Search, and is measured by the number of blogs that men-
tioned both the exact artist name along with the exact song
name (for song level) or the exact artist name and the exact
album name (for album level) in a given week.3
This weekly
blog buzz data is matched with corresponding weekly song
and album sales from Nielsen SoundScan. This data includes
both offline and online sales and is used to create the
Billboard music charts. In doing this analysis, we included
only songs and albums that have both sales and buzz obser-
vations different from zero for at least one week during the
span of the 24 weeks we are analyzing.
We supplement this data with additional variables including
record label (independent versus major label) and artist repu-
tation; these variables do not vary over time. Artist reputation
is a dummy variable, indicating whether the artist was on the
Billboard “Top Artists of the Year” in any of the years
between 2002 and 2006 or if the artist was on the “All-Time
Hot 100 Artists” list. If the artist was on either one of these
charts in the years mentioned, the “artist reputation” variable
is set to one; otherwise, it is zero. Summary statistics are pre-
sented in Tables 2 and 3, at the song and album levels, respec-
tively. At the song level, we see that the average number of
radio spins and the average song sales are higher for songs
released by independent labels, although average song buzz
is higher for songs and albums that are released by major
labels. Radio play and song sales are higher for songs re-
leased by artists who have a high artist reputation, while song
buzz is higher for songs released by artists who have a lower
artist reputation. At the album level, we see that radio play is
higherforindependentlyreleasedmusic,althoughalbumsales
are lower. Album buzz is marginally higher for independent
music. Turning to artist reputation, we see that radio play,
album buzz, and album sales are all higher for albums
released by high reputation artists as compared to albums
released by artists who have not established themselves.
Results
At the outset, we tested our data for stationarity: to conduct
both Granger causalityandPVARanalysis, the variables must
be stationary. We use the Harris-Tzavalis test (Harris and
3
Song-level posts occasionally mention the corresponding album, and vice-
versa, but this overlap is small and does not affect the qualitative nature of
our results (more on this in the subsection “Robustness Checks”).
MIS Quarterly Vol. 38 No. 1/March 2014 107
Dewan and Ramaprasad/Social Media, Traditional Media, and Music Sales
Table 2. Summary Statistics—Song Level
Full Sample Major Label Independent Label
High Artist
Reputation
Low Artist
Reputation
Radio Play
(# spins)
60.197
(487.843)
55.553
(323.731)
70.238
(725.193)
226.512
(1157.973)
37.552
(289.138)
Song Buzz
(# blog posts)
768.327
(7724.130)
934.972
(9251.646)
407.970
(1844.706)
311.3789
(1512.064)
830.543
(8212.332)
Song Sales
(# units)
359.402
(3295.174)
322.685
(2092.771)
439.075
(4986.696)
1227.048
(8004.678)
241.324
(1870.009)
No. of
observations
23832
(993 songs)
16296
(679 songs)
7536
(314 songs)
2856
(119 songs)
20976
(874 songs)
Table 3. Summary Statistics—Album Level
Full Sample Major Label Independent Label
High Artist
Reputation
Low Artist
Reputation
Album Radio Play 100.759
(832.314)
88.724
(412.519)
131.278
(1420.182)
441.883
(2325.136)
61.719
(372.610)
Album Buzz
(# blog posts)
27.685
(142.795)
26.666
(114.647)
29.207
(196.899)
45.830
(106.970)
25.274
(146.192)
Album Sales
(# units)
985.931
(4594.503)
1145.933
(5049.051)
580.213
(3130.61)
2139.344
(7634.342)
853.927
(4086.542)
No. of
observations
14256
(594 albums)
10224
(426 albums)
4032
(168 albums)
1464
(61 albums)
12792
(533 albums)
Table 4. Harris-Tzavalis Unit Root Test
Rho Statistic Z p-value
Song Sales 0.674 -48.789 0.000
Song Buzz 0.101 -1.9e02 0.000
Song Airplay 0.421 -1.1e02 0.000
Album Sales 0.784 -17.029 0.000
Album Buzz 0.084 -1.5e02 0.000
Album Airplay 0.468 -76.377 0.000
Notes: The Harris-Tzavalis unit root test is appropriate for samples with a large number of cross-sections and comparatively fewer panels. The test here is conducted
on logged, Helmert transformed variables. The null hypothesis that the panels contain unit roots is rejected for all variables.
Table 5. Granger Causality Tests (Song-Level)
Dependent Variable
Song Sales Airplay Song Buzz
Song Sales — 17.32 (0.00) 9.15 (0.00)
Airplay 16.84 (0.00) — 3.35 (0.00)
Song Buzz 5.73(0.00) 4.60 (0.00) —
Notes: The results reported are the F-statistic with the p-value in parentheses. Granger Causality tests are performed with six lags for consistency with the PVAR
models (as selected by AIC).
108 MIS Quarterly Vol. 38 No. 1/March 2014
Dewan and Ramaprasad/Social Media, Traditional Media, and Music Sales
Table 6. Granger Causality Tests (Album-Level)
Dependent Variable
Album Sales Album Buzz Album Airplay
Album Sales — 9.75 (0.00) 12.81 (0.00)
Album Buzz 11.97 (0.00) — 2.66 (0.01)
Album Airplay 27.80 (0.00) 1.78 (0.10) —
Notes: The results reported are the F-statistic with the p-value in parentheses. Granger Causality tests are performed with 6 lags for consistency with the PVAR models
(as selected by AIC).
Tzavalis 1999) for panel data. Results of this test are
reported in Table 4 and indicate that all of the variables are
stationary. Next, we conducted Granger causality tests. The
results for these tests are reported in Tables 5 and 6 and
show clear evidence of bidirectional causality in each pair of
variables, at both the song level and the album level. This
supports our approach of analyzing the variables as a full
dynamic system (Trusov et al. 2009) through PVAR
analysis. The results of this analysis are reported below.
Main Results
The results from our PVAR analysis (Equation 1) are
reported in Tables 7 and 8, for the song and album levels,
respectively. We first examine the results for the regressions
with sales as the dependent variable. Looking at the coeffi-
cient estimates on the radio play variables, we see that the
results are fairly consistent at the song and album level:
radio play has a short-term positive relationship with sales,
as shown by the positive and significant coefficient on the
first lag (album level) or two (song level) and insignificant
coefficients for the subsequent lags.
However, looking at the coefficient estimates on the lagged
buzz variables shows different relationships at the song and
album levels. At the album level, we see that the coefficient
estimates are insignificant across all lags, indicating that
buzz at the album level does not have any discernible asso-
ciation with sales, possibly because the positive and negative
effects of buzz on sales balance each other out. At the song
level, however, we see that the coefficient estimates on all of
the lags are negative and significant suggesting that at the
song level buzz is negatively related to sales. These con-
trasting results are interesting and suggest that blog buzz
potentially plays different roles in terms of predicting song
versus album sales, as we discussed in the subsection
“Theoretical Background.”
To further quantify the relative predictive power of each of
the covariates for explaining the variance of sales, we con-
duct a variance decomposition analysis, reported in Table 9.
The table shows the decomposition for different number of
weeks ahead. What we see is that past sales are obviously
the best predictor of future sales. However, the predictive
power of buzz increases over time at the song level, so that
about 10 percent of the variance in sales is explained by buzz
at Week 6 and almost 20 percent in Week 10. By com-
parison, the explanatory power of album buzz is very weak.
The predictive power of airplay is limited due to the fact that
most songs do not get any air time, and therefore there is
very little variation in the airplay variable across songs (i.e.,
most values are 0). Nonetheless, the predictive value of
airplay is higher for albums as compared to songs, and rises
to a little over 5 percent by Week 10.
Now we turn to the analysis of the relationships between
sales, airplay, and buzz. When buzz is the dependent vari-
able (Tables 7 and 8), we see fairly consistent results. That
is, at the song level, the coefficients on the sales variables
are largely negative and significant although at the album
level there is no discernible pattern. Together, we see that
the song-level results differ from the album-level results and
that, contrary to expectations given our knowledge of the
positive impact of positive word-of-mouth, buzz may not
always drive consumption.
An explanation for the negative association between song
buzz and song sales, based on our earlier theoretical discus-
sion, is that the positive WOM effect of buzz on sales is
dominated by the negative sales displacement effect of free
sampling. Given this, one might wonder if the sales dis-
placement effect varies across songs in an album as a func-
tion of song popularity. This is a pertinent question since
consumers’ relative preference for buying versus freely
sampling might depend on the popularity of the song. Speci-
fically, consumers might be more willing to buy popular
songs, but would rather freely sample (rather than buy) the
less popular songs.
To address this question, we characterized song popularity
on the basis of Last.fm listens.4
We put every song in our
4
We used Last.fm listens to rank song popularity because we do not have
sales numbers for all songs from an album. Further Last.fm listens is highly
correlated with Amazon Sales rank, so it seems a valid measure of
popularity.
MIS Quarterly Vol. 38 No. 1/March 2014 109
Dewan and Ramaprasad/Social Media, Traditional Media, and Music Sales
Table 7. Song-Level PVAR Regression Results
Dependent Variable
Song Sales Song Buzz Airplay
SongSalest-1 0.575***
(0.026)
-0.002
(0.018)
0.052***
(0.015)
SongSalest-2 0.065***
(0.011)
-0.016*
(0.010)
-0.000
(0.008)
SongSalest-3 0.037***
(0.009)
-0.017**
(0.008)
-0.018**
(0.008)
SongSalest-4 0.002
(0.008)
-0.017**
(0.008)
-0.011
(0.007)
SongSalest-5 -0.011
(0.008)
0.002
(0.008)
0.000
(0.007)
SongSalest-6 -0.024***
(0.009)
-0.017**
(0.007)
-0.0182***
(0.006)
SongBuzzt-1 -0.101**
(0.045)
0.186**
(0.036)
-0.069**
(0.029)
SongBuzzt-2 -0.087***
(0.032)
0.107***
(0.026)
-0.047**
(0.021)
SongBuzzt-3 -0.616***
(0.023)
0.075***
(0.020)
-0.041**
(0.016)
SongBuzzt-4 -0.048***
(0.018)
0.041**
(0.016)
-0.032**
(0.013)
SongBuzzt-5 -0.046***
(0.019)
0.079***
(0.016)
-0.031**
(0.013)
SongBuzzt-6 -0.054***
(0.015)
0.130***
(0.014)
-0.019*
(0.011)
Airplayt-1 0.069***
(0.020)
0.022
(0.022)
0.390***
(0.014)
Airplayt-2 0.047***
(0.014)
0.010
(0.014)
0.201***
(0.011)
Airplayt-3 -0.007
(0.012)
0.013
(0.011)
0.116***
(0.011)
Airplayt-4 -0.006
(0.011)
0.005
(0.010)
0.046***
(0.010)
Airplayt-5 0.003
(0.011)
-0.003
(0.010)
0.042***
(0.010)
Airplayt-6 0.004
(0.010)
-0.017**
(0.007)
0.024***
(0.009)
Notes: Variables are as defined in Table 1 and are logged and forward mean-differences. **, **, * denote significance at 1%, 5%, and 10%,
respectively.
110 MIS Quarterly Vol. 38 No. 1/March 2014
Dewan and Ramaprasad/Social Media, Traditional Media, and Music Sales
Table 8. Album-Level PVAR Regression Results
Dependent Variable
Album Sales Album Buzz Airplay
AlbumSalest-1 0.729***
(0.037)
0.136**
(0.055)
0.065**
(0.030)
AlbumSalest-2 -0.012
(0.029)
-0.060**
(0.025)
0.006
(0.013)
AlbumSalest-3 -0.009
(0.016)
0.007
(0.019)
-0.013
(0.011)
AlbumSalest-4 -0.009
(0.013)
-0.010
(0.017)
0.006
(0.010)
AlbumSalest-5 -0.009
(0.012)
0.005
(0.016)
-0.014
(0.010)
AlbumSalest-6 -0.018**
(0.008)
-0.004
(0.013)
-0.006
(0.008)
AlbumBuzt-1 0.003
(0.011)
0.192***
(0.021)
0.006
(0.009)
AlbumBuzzt-2 0.005
(0.009)
0.139***
(0.019)
0.010
(0.007)
AlbumBuzzt-3 -0.007
(0.008)
0.104***
(0.017)
0.013*
(0.007)
AlbumBuzzt-4 -0.005
(0.007)
0.083***
(0.016)
0.011
(0.007)
AlbumBuzzt-5 0.011
(0.006)
0.050***
(0.016)
0.005
(0.006)
AlbumBuzzt-6 0.010)
(0.007)
0.056
(0.015)
-0.001
(0.006)
Airplayt-1 0.097***
(0.031)
0.007
(0.046)
0.416***
(0.022)
Airplayt-2 0.030
(0.020)
-0.024
(0.030)
0.186***
(0.016)
Airplayt-3 -0.014
(0.016)
-0.032
(0.022)
0.110***
(0.015)
Airplayt-4 0.014
(0.013)
0.030
(0.020)
0.041***
(0.013)
Airplayt-5 0.003
(0.011)
0.014
(0.018)
0.032**
(0.013)
Airplayt-6 -0.003
(0.012)
-0.028
(0.017)
0.003
(0.012)
Notes: Variables are as defined in Table 1 and are logged and forward mean-differences. **, **, * denote significance at 1%, 5%, and 10%, respectively.
Table 9. Variance Decomposition of Sales
Weeks Ahead Past Sales Buzz Airplay
Song Level
2 99.03% 0.70% 0.02%
4 94.33% 4.67% 1.01%
6 88.60% 9.99% 1.44%
8 82.32% 15.95% 1.73%
10 78.23% 19.89% 1.87%
Album Level
2 99.52% 0.00% 0.48%
4 98.12% 0.00% 1.86%
6 96.59% 0.05% 3.36%
8 95.22% 0.20% 4.59%
10 94.28% 0.33% 5.39%
MIS Quarterly Vol. 38 No. 1/March 2014 111
Dewan and Ramaprasad/Social Media, Traditional Media, and Music Sales
Table 10. PVAR Regression Results for Different Song Subsamples
Dependent Variable: Song Sales
All Songs Top Three Songs Top Song
SongSalest-1 0.575***
(0.026)
0.603***
(0.035)
0.635***
(0.040)
SongSalest-2 0.065***
(0.011)
0.064***
(0.015)
0.080***
(0.025)
SongSalest-3 0.037***
(0.009)
0.042**
(0.019)
0.058***
(0.019)
SongSalest-4 0.002
(0.008)
0.014
(0.011)
0.018
(0.017)
SongSalest-5 -0.011
(0.008)
-0.017
(0.011)
-0.023
(0.015)
SongSalest-6 -0.024***
(0.009)
-0.010
(0.10)
0.028***
(0.012)
SongBuzzt-1 -0.101**
(0.045)
-0.056
(0.045)
0.014
(0.055)
SongBuzzt-2 -0.087***
(0.032)
-0.056*
(0.031)
-0.012
(0.038)
SongBuzzt-3 -0.616***
(0.023)
-0.037
(0.024)
-0.015
(0.030)
SongBuzzt-4 -0.048***
(0.018)
-0.015
(0.017)
0.010
(0.023)
SongBuzzt-5 -0.046***
(0.019)
-0.024
(0.018)
-0.0001
(0.024)
SongBuzzt-6 -0.054***
(0.015)
-0.032**
(0.014)
-0.016
(0.018)
Airplayt-1 0.069***
(0.020)
0.070**
(0.028)
0.096***
(0.037)
Airplayt-2 0.047***
(0.014)
0.043
(0.019)
0.027
(0.025)
Airplayt-3 -0.007
(0.012)
-0.009
(0.017)
-0.027
(0.022)
Airplayt-4 -0.006
(0.011)
-0.021
(0.014)
-0.014
(0.018)
Airplayt-5 0.003
(0.011)
-0.004
(0.014)
-0.001
(0.016)
Airplayt-6 0.004
(0.010)
-0.005
(0.013)
-0.027*
(0.016)
Notes: Variables are as defined in Table 1 and are logged and forward mean-differenced. **, **, * denote significance at 1%, 5% and 10%,
respectively.
data set into one of four categories, corresponding to whether
the song was the first, second, third, or lower than third rank
in terms of Last.fm listens across all songs in the album.
Based on this classification, we conducted a comparative
analysis of three subsamples of songs, as reported in Table
10: all songs, top three songs, and the top song. We focus on
just song sales as the dependent variable, since that is what
resulted in the most surprising result so far.
Comparing the results in the three columns of Table 10, we
see that while all of the song buzz variables are negative and
significant for the full sample of songs, only two of the coeffi-
cients are negative and significant for the top three songs sub-
sample, and none of the coefficients are significant for the top
song subsample. This is consistent with the notion that, in-
deed, consumers do have a greater willingness to pay for the
more popular songs in the album, to the point where, for the
most popular song in the album, the negative sales displace-
ment effect is weak enough, so as to be counter-balanced by
the positive WOM effects. Thus, song popularity does ex-
plain some of the variation in the effect of buzz on sales.
Next, we consider the moderating role of other music
characteristics.
112 MIS Quarterly Vol. 38 No. 1/March 2014
Dewan and Ramaprasad/Social Media, Traditional Media, and Music Sales
Sample Split Analysis
We continue our analysis by exploring how the nature of
relationships in Figure 1 vary based on the type of music
(mainstream versus niche) using sample split analyses of
record label (independent versus major) and artist reputation
(high versus low).5
The results are reported in Tables 11 and
12. Looking first at the record-label sample split (Table 11),
we find some interesting patterns. The radio play coefficients
for both major label and independently released music at the
song level are consistent with our main results, in that radio
play has a short-term positive relationship with sales. At the
album level, we note that this relationship is significant for
independently released music, but not for major labels. For
songs, both sets of radio play coefficients are significant,
although the magnitude of the coefficients for independent-
label music is larger than the corresponding coefficients for
major-label music. That is, radio play has a stronger effect on
sales of independent music, as compared to major label music,
at both the song and album levels. However, the sales boost
appears to be short term, as the coefficients older than the
second lag are insignificant.
There are also interesting differences in the estimates for the
buzz variables depending on the record label. For major-label
music, the relationship between song buzz and sales is insig-
nificant throughout. For independent music, all of the buzz
coefficients are negative and significant. So the sales
displacement effect due to a spike in song buzz is long-lived,
lasting at least 6 weeks. At the album-level, the insignificant
relationship that we found in the main results persists here.
Looking at the results of the sample split on artist reputation
(Table 12), we see similar results for the relationship between
buzz and sales as we did with the sample split on record label.
Here, it is clear that the relationship between song buzz and
song sales that we saw in the main results at both the song and
album levels are driven by music released by artists who have
not yet established a high reputation. Again, airplay has a
short-term positive effect on sales, but in this sample split we
see these results for low reputation artists only; there is no
significant relationship between radio play and sales for high
reputation artists at either the song level or the album level.
Taken together, the record label and artist reputation sample
splits provide evidence that it is perhaps less well-known
music and artists whose sales are most impacted by the sales
displacement effect of free sampling.
Impulse Response Functions
We supplement the regression estimates with the analysis of
the corresponding impulse response functions (IRFs). The
IRFs allow us to examine the response of one variable to a
shock in another variable, and to check whether the impact is
transitory or longer term. Figures 2 through 5 highlight selec-
tive IRFs so we can examine the response of song sales and
album sales to a shock in airplay (Figures 2 and 3) and to a
shock in buzz (Figures 4 and 5), respectively. Looking at
Figure 2, we see that the reaction of song sales to a shock in
radio play is positive, although the effect attenuates quickly
over time. In contrast, the reaction of song sales to a shock in
song buzz (Figure 4) is initially close to zero and becomes
more negative over time. At the album level, we see that
there does not seem to be an immediate reaction of album
sales to a shock in radio play (Figure 3), although after one
time period the reaction increases and stays positive over
time; it only marginally decreases by the sixth time period.
Additionally, we see the insignificant relationship between
album buzz and album sales reflected again in the corre-
sponding IRFs (Figure 5)—the reaction of album sales to a
shock in album buzz hovers around 0 for the six periods.
Overall, comparing song versus album level reaction of sales
to buzz, it is evident that while album sales have virtually no
reaction to a shock in album buzz, song sales have a negative
and increasingly negative reaction to a shock in song buzz.
Further, the reaction of sales to radio play is positive at both
the song level and the album level, peaking quickly and then
declining over time.
From the results of the IRFs, we are able to calculate the
elasticity of sales with respect to buzz and airplay. These
elasticities are presented in Tables 13 (song-level) and Table
14 (album-level). We see that overall, the elasticity of song
sales with respect to airplay is positive and fairly consistent
over time, while the elasticity of song sales with respect to
song buzz is negative and increases in magnitude over time.
This indicates that as time progresses, song sales become
more sensitive to a shift in song buzz. At the album-level we
find that the elasticity of album sales with respect to airplay
is positive and increases in magnitude over time, while the
elasticity of album sales with respect to album buzz is almost
zero. Both the results presented in the IRFs and the elasticity
results are consistent with the original PVAR regression
results reported earlier.
Robustness Checks
Our basic specifications so far did not include the cross
effects of album buzz and sales on song sales, and vice versa.6
5
We also conduct a sample split analysis based on genre, although our results
here indicate that the relationships do not vary based on genre alone. 6
We thank an anonymous reviewer for suggesting this point.
MIS Quarterly Vol. 38 No. 1/March 2014 113
Dewan and Ramaprasad/Social Media, Traditional Media, and Music Sales
Table 11. PVAR Regression Results (Sample Split on Label)
Dependent Variable
Song Sales Album Sales
Major Independent Major Independent
Buzzt-1 -0.010
(0.040)
-0.385***
(0.166)
-0.004
(0.013)
0.033
(0.025)
Buzzt-2 -0.016
(0.027)
-0.322***
(0.127)
0.007
(0.010)
0.014
(0.021)
Buzzt-3 -0.010
(0.195)
-.240***
(0.095)
-0.011
(0.009)
0.003
(0.019)
Buzzt-4 -0.177
(0.154)
-0.181***
(0.774)
-0.005
(0.008)
0.000
(0.018)
Buzzt-5 -0.003
(0.153)
-0.209***
(0.809)
0.013
(0.008)
0.006
(0.016)
Buzzt-6 -0.022
(0.012)
-0.183***
(0.066)
0.001
(0.007)
0.030*
(0.016)
Airplayt-1 0.082***
(0.031)
0.254***
(0.089)
0.073
(0.040)
0.153***
(0.044)
Airplayt-2 0.050***
(0.019)
0.143***
(0.053)
0.002
(0.026)
0.086***
(0.031)
Airplayt-3 -0.004
(0.014)
0.010
(0.307)
-0.012
(0.020)
-0.008
(0.027)
Airplayt-4 0.006
(0.013)
-0.023
(0.025)
0.007
(0.016)
0.036
(0.022)
Airplayt-5 -0.014
(0.013)
0.049*
(0.027)
0.027**
(0.014)
-0.032
(0.020)
Airplayt-6 -0.011
(0.012)
0.048*
(0.026)
0.002
(0.016)
-0.008
(0.018)
Notes: Variables are as defined in Table 1 and are logged and forward mean-differenced. **, **, * denote significance at 1%, 5% and 10%, respectively. Note that
Buzz refers to Song Buzz when looking at the Song Sales results and refers to Album Buzz when looking at the Album Sales results.
Table 12. PVAR Regression Results (Sample Split on Artist Reputation)
Dependent Variable
Song Sales Album Sales
High Artist
Reputation
Low Artist
Reputation
High Artist
Reputation
Low Artist
Reputation
Buzzt-1 0.023
(0.119)
-0.105***
(0.045)
-0.141
(0.325)
0.007
(0.012)
Buzzt-2 -0.009
(0.069)
-0.089***
(0.033)
-0.110
(0.240)
0.009
(0.010)
Buzzt-3 -0.006
(0.040)
-0.067***
(0.025)
-0.095
(0.174)
-0.005
(0.009)
Buzzt-4 0.002
(0.030)
-0.054***
(0.020)
-0.085
(0.182)
-0.003
(0.008)
Buzzt-5 0.013
(0.033)
-0.051***
(0.020)
-0.061
(0.145)
0.013
(0.008)
Buzzt-6 -0.039
(0.030)
-0.053***
(0.016)
-0.051
(0.083)
0.013*
(0.008)
Airplayt-1 0.075
(0.081)
0.070***
(0.021)
0.213
(0.345)
0.103***
(0.034)
Airplayt-2 0.034
(0.048)
0.049***
(0.015)
0.137
(0.387)
0.035
(0.021)
Airplayt-3 0.037
(0.052)
-0.017
(0.013)
0.063
(0.192)
-0.014
(0.017)
Airplayt-4 -0.003
(0.041)
-0.007
(0.012)
0.057
(0.134)
0.015
(0.014)
Airplayt-5 -0.010
(0.036)
0.003
(0.012)
0.053
(0.160)
0.004
(0.012)
Airplayt-6 0.031
(0.028)
0.002
(0.011)
0.065
(0.183)
-0.002
(0.013)
Notes: Variables are as defined in Table 1 and are logged and forward mean-differenced. **, **, * denote significance at 1%, 5% and 10%, respectively.
114 MIS Quarterly Vol. 38 No. 1/March 2014
Dewan and Ramaprasad/Social Media, Traditional Media, and Music Sales
Note: Errors are 5% on each side generated by Monte Carlo with 500 repetitions.
Figure 2. Impulse Response Function: Response of Song Sales to Airplay
Note: Errors are 5% on each side generated by Monte Carlo with 500 repetitions.
Figure 3. Impulse Response Function: Response of Album Sales to Airplay
Note: Errors are 5% on each side generated by Monte Carlo with 500 repetitions.
Figure 4. Impulse Response Function: Response of Song Sales to Song Buzz
MIS Quarterly Vol. 38 No. 1/March 2014 115
Dewan and Ramaprasad/Social Media, Traditional Media, and Music Sales
Note: Errors are 5% on each side generated by Monte Carlo with 500 repetitions.
Figure 5. Impulse Response Function: Response of Song Sales to Album Buzz
Table 13. Elasticity of Song Sales with Respect to Song Buzz and Airplay
One Week Three Weeks Six Weeks
Song Buzz -0.021 -0.044 -0.059
Airplay 0.006 0.009 0.008
Table 14. Elasticity of Album Sales with Respect to Album Buzz and Airplay
One Week Three Weeks Six Weeks
Album Buzz 0.001 0.001 0.000
Airplay 0.005 0.008 0.008
These cross effects could be important since blog posts that
contain song names also contain album names, and thus
influence album sales along with song sales—and vice versa.
In other words, variation in the song (album) buzz variable to
some extent captures variation in album (song) buzz as well.
If these cross effects are significant, then ignoring them might
lead to biased results. Accordingly, we expanded our song
and albumspecifications to include albumand song variables,
respectively. The PVAR estimation results for these ex-
panded specifications are provided Table 15, where we focus
just on song and album sales as the dependent variables. We
see that the qualitative nature of our baseline results is
unchanged. That is, airplay has a positive association with
both album and song sales. Song buzz has a negative associa-
tion with song sales, while the coefficients on album buzz in
the album sales regression have mixed signs. In terms of the
cross effects, album buzz appears to have a positive associa-
tion with song sales, whereas the coefficients on song buzz in
the album sales regression are negative and significant. The
latter result reflects the fact that free sampling of songs hurts
not just song sales, but corresponding album sales as well.
The coefficients on album sales in the song sales regression
have mixed signs, whereas song sales appear to have a nega-
tive association with album sales (i.e., when people buy a
song they tend not to buy the corresponding album).
Next, we explore the idea that perhaps there is an “over-hype”
effect that may explain the negative effect of song buzz on
song sales. In other words, we explore whether the large
volume of song buzz, particularly for some of the most
buzzed about or “hyped” songs, is overwhelming the smaller
volume of song sales, driving the negative relationship
between the two. To see if this is the case, we divide the
sample based on the ratio of song buzz to song sales,
including the songs in the top 99th
percentile mean buzz to
sales ratio in the high hype group and the others in the low
hype group. These results are reported in Table 16. It is clear
that, even after excluding the most hyped songs, our results
are consistent. We do the same exercise with the airplay to
song sales ratio and, again, find that our results are consistent.
116 MIS Quarterly Vol. 38 No. 1/March 2014
Dewan and Ramaprasad/Social Media, Traditional Media, and Music Sales
Table 15. PVAR Regression Results (Both Song and Album Variables)
Dependent Variable
Song Sales Album Sales
SongSalest-1 0.532***
(0.025)
-0.059***
(0.020)
SongSalest-2 0.099***
(0.013)
0.011
(0.013)
SongSalest-3 0.039***
(0.010)
0.017
(0.011)
SongSalest-4 -0.003
(0.009)
0.006
(0.011)
SongSalest-5 0.005
(0.009)
0.001
(0.009)
SongSalest-6 -0.016*
(0.009)
-0.031***
(0.009)
SongBuzzt-1 -0.082*
(0.049)
-0.113***
(0.029)
SongBuzzt-2 -0.067*
(0.025)
-0.069**
(0.028)
SongBuzzt-3 -0.049*
(0.026)
-0.046***
(0.016)
SongBuzzt-4 -0.035*
(0.020)
-0.032*
(0.017)
SongBuzzt-5 -0.033
(0.021)
-0.029**
(0.013)
SongBuzzt-6 -0.046***
(0.017)
-0.029***
(0.013)
SongAirplayt-1 0.051**
(0.020)
0.084***
(0.021)
SongAirplayt-2 0.035**
(0.015)
0.021
(0.014)
SongAirplayt-3 -0.008
(0.012)
-0.009
(0.011)
SongAirplayt-4 -0.007
(0.011)
0.014
(0.009)
SongAirplayt-5 0.003
(0.011)
0.010
(0.009)
SongAirplayt-6 0.007
(0.010)
0.007
(0.009)
AlbumBuzzt-1 -0.007
(0.012)
-0.005
(0.011)
AlbumBuzzt-2 -0.009
(0.009)
0.005
(0.009)
AlbumBuzzt-3 -0.012
(0.008)
-0.017**
(0.007)
AlbumBuzzt-4 0.023***
(0.007)
-0.005
(0.006)
AlbumBuzzt-5 -0.001
(0.007)
0.014**
(0.006)
AlbumBuzzt-6 -0.001
(0.007)
0.012**
(0.006)
AlbumSalest-2 -0.128***
(0.019)
-0.047*
(0.025)
AlbumSalest-3 -0.016
(0.013)
-0.008
(0.015)
AlbumSalest-4 0.035***
(0.013)
-0.001
(0.012)
AlbumSalest-5 -0.043***
(0.012)
-0.019*
(0.011)
AlbumSalest-6 0.006
(0.009)
-0.011
(0.007)
Notes: Variables are as defined in Table 1 and are logged and forward mean-differenced. **, **, * denote significance at 1%, 5% and 10%, respectively.
MIS Quarterly Vol. 38 No. 1/March 2014 117
Dewan and Ramaprasad/Social Media, Traditional Media, and Music Sales
Table 16. PVAR Regression Results (Robustness for the “Over-Hype” Effect)
Song Sales
Low Buzz: Sales High Buzz: Sales Low Airplay: Sales High Airplay: Sales
Buzzt-1 -0.758*
(0.040)
0.839
(0.736)
-0.098**
(0.043)
0.150***
(0.346)
Buzzt-2 -0.692**
(0.029)
0.382
(0.526)
-0.086***
(0.031)
0.116
(0.257)
Buzzt-3 -0.048**
(0.021)
-0.441
(0.568)
-0.060***
(0.022)
0.045
(0.236)
Buzzt-4 -0.038**
(0.016)
-0.661
(0.494)
-0.047***
(0.018)
0.038
(0.163)
Buzzt-5 -0.036**
(0.017)
-0.304
(0.504)
-0.046**
(0.018)
0.180
(0.125)
Buzzt-6 -0.047***
(0.013)
-0.594
(0.423)
-0.055***
(0.015)
0.004
(0.120)
Airplayt-2 0.074***
(0.019)
0.359
(0.416)
0.072***
(0.018)
-0.053
(1.049)
Airplayt-2 0.049***
(0.014)
0.132
(0.173)
0.048***
(0.013)
-0.121
(0.462)
Airplayt-3 -0.008
(0.012)
-0.012
(0.179)
-0.009
(0.012)
0.489
(0.702)
Airplayt-4 -0.009
(0.011)
-0.015
(0.249)
-0.008
(0.010)
0.071
(0.517)
Airplayt-5 -0.000
(0.010)
0.162
(0.167)
0.003
(0.010)
-0.334
(0.568)
Airplayt-6 0.0001
(0.009)
0.101
(0.176)
0.000
(0.009)
0.304
(0.391)
Notes: Variables are as defined in Table 1 and are logged and forward mean-differenced. **, **, * denote significance at 1%, 5% and 10%, respectively.
Finally, we conduct a robustness check on the number of lags
included in the PVAR specification. The AIC criterion indi-
cated that six or seven lags might be best, although the
difference in the AIC magnitudes was small. We decided to
include six lags for the sake of parsimony. Table 17 shows
the main results when seven lags of all variables are included
and, as can be, seen the qualitative nature of the results is
unchanged.
Discussion and Conclusions
Our analysis of the dynamic relationships between social
media, traditional media, and sales found interesting differ-
ences at the song and album level and within different music
subsamples. We find that at the song level, the impact of
radio play on sales is positive and declines rapidly over time,
and the impact of song buzz is negative and becomes more
negative over time. By contrast, at the album level, both radio
play and buzz have a moderate and consistent positive
relationship with sales. This analysis suggests that the impact
of social media, and the buzz therein, is different at the song
level and at the album level, and for mainstream versus niche
music. As mentioned earlier, it is important to note that our
results reflect short-term dynamics between buzz and sales,
and they do not rule out the possibility of positive impacts of
song/album buzz on sales in the long term.
A potential explanation for the contrasting effects of buzz on
album versus song sales highlights the dual role of social
media as a platform for sharing not just information and
opinions about music, but for sharing the music itself—which
has not been addressed in prior research. A shock in blog
buzz is typically accompanied by a contemporaneous shock
in the supply of free, shareable music in the form of streaming
mp3 links. Indeed, in a majority of blog posts at the song
level, we find that the bloggers provide a mechanism for users
to sample the music via streaming. As a result, any potential
positive effects of blog buzz on song sales appears to be
swamped by the negative effect of free sampling on sales.
Interestingly, we find this net negative result at the song level
and not at the album level. This might be due to the fact that
with the trend in unbundling of albums, this media sharing
happens largely at the song level, not at the album level. In
addition, it is also possible that individuals who consume
albums are different from those who consume songs in their
propensity to sample versus purchase music. Anecdotal evi-
dence suggests that those who consume albums are most
likely to purchase physical albums (Nielsen 2012), while
those interested in songs are digital consumers, who are more
likely to sample music online.
118 MIS Quarterly Vol. 38 No. 1/March 2014
Dewan and Ramaprasad/Social Media, Traditional Media, and Music Sales
Table 17. PVAR Regression Results (Seven Lags)
Dependent Variable
Song Sales Album Sales
Salest-1 0.520***
(0.032)
0.700***
(0.044)
Salest-2 0.066***
(0.012)
-0.010
(0.031)
Salest-3 0.031***
(0.009)
-0.004
(0.017)
Salest-4 0.007
(0.008)
-0.011
(0.013)
Salest-5 -0.013
(0.009)
-0.010
0.012)
Salest-6 -0.002
(0.008)
-0.005
(0.011)
Salest-7 -0.038***
(0.010)
-0.017**
(0.009)
Buzzt-1 -0.136***
(0.050)
0.001
(0.011)
Buzzt-2 -0.115***
(0.036)
0.003
(0.009)
Buzzt-3 -0.092***
(0.028)
-0.011
(0.008)
Buzzt-4 -0.059***
(0.020
-0.005
(0.007)
Buzzt-5 -0.047***
(0.017)
0.007
(0.007)
Buzzt-6 -0.063***
(0.016)
0.009
(0.007)
Buzzt-7 -0.006
(0.010)
0.002
(0.006)
Airplayt-1 0.067***
(0.021)
0.089**
(0.031)
Airplayt-2 0.044***
(0.014)
0.028
(0.021)
Airplayt-3 -0.010
(0.013)
-0.021
(0.016)
Airplayt-4 -0.010
(0.011)
0.006
(0.014)
Airplayt-5 0.010
(0.011)
0.003
(0.011)
Airplayt-6 0.009
(0.010)
-0.001
(0.066)
Airplayt-7 0.004
(0.010)
0.003
(0.011)
Our analysis has a number of implications for both research
and practice. The evidence of bidirectional causality calls for
caution when analyzing buzz and sales data. Unless proper
models are used to explicitly allow for two-way causal
effects, estimates of the impact of buzz on sales might be
biased and therefore misleading. With respect to the impact
of buzz on sales, our results highlight the multifaceted role of
social media in the music context. These media are used to
share information about music items—but also to share the
music itself. Any positive effects of the first type of sharing
might be cancelled and reversed by the negative effects of the
second type of sharing (i.e., the music itself) on sales. There-
fore, a study of the word-of-mouth effects of social media
must also account for the use of this media for sharing digital
goods. From a practical standpoint, our findings suggest that
buzz marketing campaigns might have different results when
targeted at the album versus song level. Further the design of
the campaigns must account for the confounding effects of
word-of-mouth social influence versus the sharing of music.
It is clear that the results we found here are unlikely if music
were not an information good. The digitization of products
has made them more accessible to consumers, through both
legitimate and illegitimate means. The online music land-
MIS Quarterly Vol. 38 No. 1/March 2014 119
Dewan and Ramaprasad/Social Media, Traditional Media, and Music Sales
scape is continually growing, with a large variety of sites
available to stream and download music, including sites such
as Last.fm and Spotify. As individuals begin to have access
to music through such sites, which enable consumption with-
out purchase, the relationship between sampling and sales
becomes even more important. Our results demonstrate that
creating awareness of such goods, through online venues such
as social media, may not have a direct, positive effect on
sales; in fact, it may lead people to access the good for free.
While this may be concerning for those operating and seeking
to make money from digital goods, it is important to note that
this ability to consume the good for free (i.e., sample it) may
provide incentive for consumers to purchase complementary
products. The insights that are generated from our analysis
are applicable to other information goods, where sampling
and sales are both viable mechanisms for consumption. Thus
our overall framework and insights are applicable to software,
print, and film, although the distinction between an albumand
single songs may not be relevant in these contexts.
This study does have some limitations. We have data on only
one type of social media—blog posts—and not Facebook,
MySpace, and other media. Also, we have data on only
volume of word-of-mouth, not valence. However, we believe
this is not very limiting in the music blog context, due to the
fact that almost all music blog posts implicitly represent a
positive opinion so that there is no variation in valence here.
Another issue with the measurement of buzz is that it just
counts album and song mentions, which combines word-of-
mouth effects with media sharing effects. Thus, we are only
able to observe the net impact of the two factors; it may be
interesting for future research to separately measure the two
effects, so their individual contributions can be distinguished
from one another. Another limitation is that our research
design includes just one traditional media, namely radio play.
However, Peitz and Waelbroeck (2004) note that radio play
is the single most important traditional channel through which
users discover music. Overcoming these limitations can
provide fruitful directions for further research. Overall, this
study sheds new light on the impact of new versus traditional
media on music album and song sales, and the results have
implications for the design of both academic studies and buzz
marketing campaigns in practice.
Acknowledgments
The order of authors is alphabetical and they contributed equally.
The authors thank Debbie Schwartz at Nielsen SoundScan for
facilitating the access to essential data for this project. They also
thank the editorial team and seminar participants at the University
of Minnesota, New York University, Hong Kong University of
Science and Technology, Beijing University, and SCECR 2011 for
their helpful comments and suggestions.
References
Abel, F., Diaz-Aviles, E., Henze, N., Krause, D. and Siehndel, P.
2010. “Analyzing the Blogosphere for Predicting the Success of
Music and Movie Products,” in Proceedings of the 2010 Inter-
national Conference on Advances in Social Networks Analysis
and Mining, Odense, Denmark, August 9-11.
Adomavicius, G., Bockstedt, J., and Gupta, A. 2012. “Modeling
Supply-Side Dynamics of IT Components, Products, and
Infrastructure: An Empirical Analysis Using Vector Auto-
regression,” Information Systems Research (23:2), pp. 397- 417.
Arellano, M., and Bover, O. 1995. “Another Look at the Instru-
mental Variable Estimation of Error Component Models,”
Journal of Econometrics (68:1), pp. 29-51.
Chellappa, R., and Chen, C. 2009. “MySpace Killed the Radio
Star? The Impact of Online Sampling on Song Sales,” in
Proceedings of the 13th
International Conference on Information
Systems, Phoenix, AZ, December 15-18.
Chen, H., De, P., and Hu Yu. 2011. “IT-Enabled Broadcasting in
Social Media: An Empirical Study of Artists’ Activities and
Music Sales,” paper presented at the Workshop on Information
Systems and Economics, Shanghai, China.
Chen, Y., Wang, Q., and Xie, J. 2010. “Online Social Interactions:
A Natural Experiment on Word of Mouth Versus Observational
Learning,” Working Paper, University of Arizona.
Chevalier, J. A., and Mayzlin, D. 2006. “The Effect of Word of
Mouth on Sales: Online Book Reviews,” Journal of Marketing
Research (43:3), pp. 345-354.
Chintagunta, P. K., Gopinath, S., and Venkataraman, S. 2010. “The
Effects of Online User Reviews on Movie Box Office Perfor-
mance: Accounting for Sequential Rollout and Aggregation
Across Local Markets,” Marketing Science (29:5), pp. 944-957.
Dekimpe, M. G., and Hanssens, D. M. 1995. “The Persistence of
Marketing Effects on Sales,” Marketing Science (14:1), pp. 1-21.
Dellarocas, C., Awad, N., and Zhang, X. 2007. “Exploring the
Value of Online Product Reviews in Forecasting Sales: The Case
of Motion Pictures,” Journal of Interactive Marketing (21:4), pp.
23-45.
Dewan, S., and Hsu, V. 2004. “Adverse Selection in Electronic
Markets: Evidence from Online Stamp Auctions,” Journal of
Industrial Economics (LII:4), pp. 497-516.
Dewan, S., and Ramaprasad, J. 2008. “Chicken and Egg? Interplay
Between Music Blog Buzz and Album Sales,” paper presented at
Workshop on Information Systems Economics, Paris, France.
Dewan, S., and Ramaprasad, J. 2012. “Music Blogging, Online
Sampling, and the Long Tail,” Information Systems Research
(23:3), pp. 1056-1067.
Dhar, V., and Chang, E. A. 2009. “Does Chatter Matter? The
Impact of User-Generated Content on Music Sales,” Journal of
Interactive Marketing (23), pp. 300-307.
Duan, W., Gu, B., and Whinston, A. B. 2008. “The Dynamics of
Online Word of Mouth and Product Sales—An Empirical
Investigation of the Movie Industry,” Decision Support Systems
(84:2), pp. 233-242.
120 MIS Quarterly Vol. 38 No. 1/March 2014
Dewan and Ramaprasad/Social Media, Traditional Media, and Music Sales
Ehlrich, B. 2011. “What Would the Music Industry Look Like if
Napster Never Existed?,” Mashable.com, April 8
(http://mashable.com/2011/04/08/napster-never-existed/).
Forman, C., Ghose, A., and Weisenfeld, B. 2008. “Examining the
Relationship Between Reviews and Sales: The Role of Reviewer
Identity Disclosure in Electronic Markets,” Information Systems
Research (19:3), pp. 291-313.
Ghose, A., and Ipeirotis, P. G. 2011. “Estimating the Helpfulness
and Economic Impact of Product Reviews: Mining Text and
ReviewerCharacteristics,”IEEETransactionsonKnowledgeand
Data Engineering (23:10), pp. 1498-1512.
Godes, D., and Mayzlin, D. 2004. “Using Online Conversations to
Study Word of Mouth Communication,” Marketing Science
(23:4), pp. 545-560.
Harris, R. D. F., and Tzavalis, E. 1999. “Inference for Unit Roots
in Dynamic Panels Where the Time Dimension is Fixed” Journal
of Econometrics (91:2), pp. 201-226.
Holtz-Eakin, D., Newey, W., and Rosen, H. S. 1988. “Estimating
Vector Autoregressions with Panel Data,” Econometrica (56:6),
pp. 1371-1395.
King, M. F., and Balasubramanian, S. K. 1994. “The Effects of
Expertise, End Goal, and Product Type on Adoption of Prefer-
ence Formation Strategy,” Journal of the Academy of Marketing
Science (22:2), pp. 146-159.
Liebowitz, S. 2004. “Will MP3 Downloads Annihilate the Record
Industry? The Evidence so Far,” Advances in the Study of Entre-
preneurship, Innovation and Economic Growth (15), pp.
229-260.
Liu, Y. 2006. “Word of Mouth for Movies: It’s Dynamics and
Impact on Box Office Revenues,” Journal of Marketing (70:7),
pp. 74-89.
Love, I., and Zicchino, L. 2006. “Financial Development and
Dynamic Investment Behavior: EvidencefromPanelVAR,”The
Quarterly Review of Economics and Finance (46:2), May, pp.
190-210.
Moon, S, Bergey, P. K., and Iacobucci, D. 2010. “Dynamic Effects
Among Movie Ratings, Movie Revenues, and Viewer Satis-
faction” Journal of Marketing (74:1), pp. 108-121.
Morales-Arroyo, M., and Pandey, T. 2010. “Identification of
Critical eWOM Dimensions for Music Albums,” in Proceedings
of the 5th
IEEE International Conference on Management of
Innovation and Technology, Singapore, June 2-5.
Nielsen Company. 2012. “Nielsen Music 3600
,” partial report
available upon request and full report available upon license
retrieval from The Nielsen Company.
Onishi, H., and Manchanda, P. 2012. “Marketing Activity,
Blogging and Sales,” International Journal of Research in
Marketing, (29:3), pp. 221-234.
Peitz, M., and Waelbroeck, P. 2004. “An Economist’s Guide to
Digital Music,” CESifo Working Paper 1333, CESIfo Group
Munich.
Peitz, M., and Waelbroeck, P. 2006. “Why the Music Industry May
Gain from Free Downloading—The Role of Sampling,”
International Journal of Industrial Organization (24:5), pp.
907-913.
Rob, R., and Waldfogel, J. 2006. “Piracy on the High C’s: Music
Downloading, Sales Displacement, and Social Welfare in a
Sample of CollegeStudents,” The Journal of Law and Economics
(49:1), pp. 29-62.
Rui, H., Liu, Y., and Whinston, A. B. 2011. “Whose and What
Chatter Matters? The Impact of Tweets on Music Sales,”
Working Paper No. 8, Zwick Center for Food and Resource
Policy, University of Connecticut, Storrs, CT.
Siwek, S. E. 2007. “The True Cost of Sound Recording Piracy to
the U.S. Economy,” Policy Report 188, Institute for Policy
Innovation, Lewisville, TX.
Stanca, L., and Gallegati, M. 1999. “The Dynamic Relation
Between Financial Positions and Investment: Evidence from
Company Account Data,” Industrial and Corporate Change
(8:3), pp. 551-572.
Stephen, A. T., and Galak, J. 2012. “The Effects of Traditional and
Social Earned Media on Sales: A Study of a Microlending Mar-
ketplace,” Journal of Marketing Research (49:5), pp. 624-639.
Trusov, M., Bucklin, R. E., and Pauwels, K. 2009. “Effects of
Word-of-MouthVersusTraditionalMarketing: Findingsfroman
Internet Social Networking Site,” Journal of Marketing (73:9),
pp. 90-102.
Villanueva, J., Yoo, S., and Hanssens, D. M. 2008. “The Impact of
Marketing-Induced Versus Word-of-Mouth Consumer Acquisi-
tion on Customer Equity Growth,” Journal of Marketing
Research (45:1), pp. 48-59.
Waldfogel, J. 2010. “Music File Sharing and Sales Displacement
in the iTunes Era,” Information Economics and Policy (22:4), pp.
306-314.
Zentner, A. 2006. “Piracy and File Sharing: Measuring the Effect
of Music Downloads on Music Purchases,” The Journal of Law
and Economics (49:1), pp. 63-90.
About the Authors
Sanjeev Dewan is a professor at the the Paul Merage School of
Business, University of California, Irvine. Prior to joining UC
Irvine in 2001, he served on the faculties of the business schools at
the University of Washington, Seattle, and George Mason Univer-
sity. He received his Ph.D. in Business Administration in 1991 from
the Simon School at the University of Rochester, in the area of
Information Systems. His current research interests are in the areas
of the impact of online social media, business value of IT invest-
ments, and electronic commerce. He has served as a senior editor
at Information Systems Research and associate editor at Manage-
ment Science.
Jui Ramaprasad is currently an assistant professor at the Desautels
Faculty of Management at McGill University. She received her
doctorate in information systems from the Paul Merage School of
Business at the University of California, Irvine, and holds a B.S.
from the University of Southern California. Her main research
interests lie in the impacts of online social media, the music
industry, and electronic markets. She cochaired the 2012 Statistical
Challenges in eCommerce Research (SCECR) conference held at
McGill University in Montreal, Canada, and has served on a number
of other conference program committees.
MIS Quarterly Vol. 38 No. 1/March 2014 121
122 MIS Quarterly Vol. 38 No. 1/March 2014

More Related Content

What's hot

Industrial music paper
Industrial music paperIndustrial music paper
Industrial music paperKevin Bessey
 
J R Brown Music industry interests
J R Brown Music industry interestsJ R Brown Music industry interests
J R Brown Music industry interestsJordan Rohan Brown
 
Exam Project - Andrei Tiu
Exam Project - Andrei TiuExam Project - Andrei Tiu
Exam Project - Andrei TiuAndrei Tiu
 
Magazine Advertisement Evaluation
Magazine Advertisement EvaluationMagazine Advertisement Evaluation
Magazine Advertisement Evaluationwatterss
 
The music industry
The music industryThe music industry
The music industrySarahRaychel
 
Marketing of music videos
Marketing of music videosMarketing of music videos
Marketing of music videosamberneedham
 
How has you tube, vimeo and social media effected the music industry
How has you tube, vimeo and social media effected the music industry How has you tube, vimeo and social media effected the music industry
How has you tube, vimeo and social media effected the music industry 07adanmu
 
Proposal for Cartoon Network to launch a Music Album
Proposal for Cartoon Network to launch a Music AlbumProposal for Cartoon Network to launch a Music Album
Proposal for Cartoon Network to launch a Music AlbumShubham Khurana
 
Mood board analysis
Mood board analysisMood board analysis
Mood board analysisKofi Cheung
 
Lo1 (final major project)
Lo1 (final major project)Lo1 (final major project)
Lo1 (final major project)phele1994
 
Lo1 (undesigned
Lo1 (undesignedLo1 (undesigned
Lo1 (undesignedphele1512
 
Century media
Century mediaCentury media
Century mediaannagigi
 
Lady Gaga Marketing Campaign
Lady Gaga Marketing CampaignLady Gaga Marketing Campaign
Lady Gaga Marketing CampaignCharlDale
 
Question 5 of media evaluation
Question 5 of media evaluationQuestion 5 of media evaluation
Question 5 of media evaluationTasha900
 
Media questionnaire
Media questionnaireMedia questionnaire
Media questionnairejawgeenahh
 

What's hot (20)

Industrial music paper
Industrial music paperIndustrial music paper
Industrial music paper
 
Breaking Acts
Breaking ActsBreaking Acts
Breaking Acts
 
J R Brown Music industry interests
J R Brown Music industry interestsJ R Brown Music industry interests
J R Brown Music industry interests
 
Exam Project - Andrei Tiu
Exam Project - Andrei TiuExam Project - Andrei Tiu
Exam Project - Andrei Tiu
 
Intro to unit
Intro to unitIntro to unit
Intro to unit
 
Magazine Advertisement Evaluation
Magazine Advertisement EvaluationMagazine Advertisement Evaluation
Magazine Advertisement Evaluation
 
The music industry
The music industryThe music industry
The music industry
 
Marketing of music videos
Marketing of music videosMarketing of music videos
Marketing of music videos
 
How has you tube, vimeo and social media effected the music industry
How has you tube, vimeo and social media effected the music industry How has you tube, vimeo and social media effected the music industry
How has you tube, vimeo and social media effected the music industry
 
Poster research
Poster researchPoster research
Poster research
 
Proposal for Cartoon Network to launch a Music Album
Proposal for Cartoon Network to launch a Music AlbumProposal for Cartoon Network to launch a Music Album
Proposal for Cartoon Network to launch a Music Album
 
Mood board analysis
Mood board analysisMood board analysis
Mood board analysis
 
Lo1 (final major project)
Lo1 (final major project)Lo1 (final major project)
Lo1 (final major project)
 
Lo1 (undesigned
Lo1 (undesignedLo1 (undesigned
Lo1 (undesigned
 
Century media
Century mediaCentury media
Century media
 
Lady Gaga Marketing Campaign
Lady Gaga Marketing CampaignLady Gaga Marketing Campaign
Lady Gaga Marketing Campaign
 
Waner Music Group
Waner Music GroupWaner Music Group
Waner Music Group
 
Question 5 of media evaluation
Question 5 of media evaluationQuestion 5 of media evaluation
Question 5 of media evaluation
 
Radio stations
Radio stationsRadio stations
Radio stations
 
Media questionnaire
Media questionnaireMedia questionnaire
Media questionnaire
 

Viewers also liked

Comment les artistes musiciens ce sont ils saisis du web ?
Comment les artistes musiciens ce sont ils saisis du web ?Comment les artistes musiciens ce sont ils saisis du web ?
Comment les artistes musiciens ce sont ils saisis du web ?yop88240
 
Stress and Eating
Stress and EatingStress and Eating
Stress and EatingInnerHelper
 
Compressor technology options supporting r744 system design for diverse end u...
Compressor technology options supporting r744 system design for diverse end u...Compressor technology options supporting r744 system design for diverse end u...
Compressor technology options supporting r744 system design for diverse end u...Venu Kandi
 
Target Audience Power Point
Target Audience Power PointTarget Audience Power Point
Target Audience Power PointJosh Rothwell
 
Questionnaire Result
Questionnaire Result Questionnaire Result
Questionnaire Result kristylai__
 
The Effect of Stress on Eating in Undergraduates-- Final
The Effect of Stress on Eating in Undergraduates-- FinalThe Effect of Stress on Eating in Undergraduates-- Final
The Effect of Stress on Eating in Undergraduates-- FinalKayla Hanzsek-Brill
 
The Narrative Consistency of the Warcraft Movie
The Narrative Consistency of the Warcraft MovieThe Narrative Consistency of the Warcraft Movie
The Narrative Consistency of the Warcraft MovieJonathan Barbara
 
Summer Internship Report (National Engineering Services Pakistan)-2014
Summer Internship Report (National Engineering Services Pakistan)-2014Summer Internship Report (National Engineering Services Pakistan)-2014
Summer Internship Report (National Engineering Services Pakistan)-2014Danial Sohail
 
Blundell Dissertation Defense - 3.31.2015 REVISED
Blundell Dissertation Defense - 3.31.2015 REVISEDBlundell Dissertation Defense - 3.31.2015 REVISED
Blundell Dissertation Defense - 3.31.2015 REVISEDShelley Blundell
 
Introduction to Apache Hive
Introduction to Apache HiveIntroduction to Apache Hive
Introduction to Apache HiveAvkash Chauhan
 
The Dark Knight - Production Marketing and Audience
The Dark Knight - Production Marketing and AudienceThe Dark Knight - Production Marketing and Audience
The Dark Knight - Production Marketing and AudienceElle Sullivan
 

Viewers also liked (19)

Comment les artistes musiciens ce sont ils saisis du web ?
Comment les artistes musiciens ce sont ils saisis du web ?Comment les artistes musiciens ce sont ils saisis du web ?
Comment les artistes musiciens ce sont ils saisis du web ?
 
Results_new
Results_newResults_new
Results_new
 
Stress and Eating
Stress and EatingStress and Eating
Stress and Eating
 
Compressor technology options supporting r744 system design for diverse end u...
Compressor technology options supporting r744 system design for diverse end u...Compressor technology options supporting r744 system design for diverse end u...
Compressor technology options supporting r744 system design for diverse end u...
 
Question 3
Question 3Question 3
Question 3
 
Target Audience Power Point
Target Audience Power PointTarget Audience Power Point
Target Audience Power Point
 
Questionnaire Result
Questionnaire Result Questionnaire Result
Questionnaire Result
 
Edwards.N.Research Presentation
Edwards.N.Research PresentationEdwards.N.Research Presentation
Edwards.N.Research Presentation
 
BYCO Internship Report
BYCO Internship ReportBYCO Internship Report
BYCO Internship Report
 
The Effect of Stress on Eating in Undergraduates-- Final
The Effect of Stress on Eating in Undergraduates-- FinalThe Effect of Stress on Eating in Undergraduates-- Final
The Effect of Stress on Eating in Undergraduates-- Final
 
Dr. Moses Muthinja Cv
Dr. Moses Muthinja CvDr. Moses Muthinja Cv
Dr. Moses Muthinja Cv
 
Storyboard
StoryboardStoryboard
Storyboard
 
Libro 2
Libro 2Libro 2
Libro 2
 
The Narrative Consistency of the Warcraft Movie
The Narrative Consistency of the Warcraft MovieThe Narrative Consistency of the Warcraft Movie
The Narrative Consistency of the Warcraft Movie
 
Apache Hive 2.0: SQL, Speed, Scale
Apache Hive 2.0: SQL, Speed, ScaleApache Hive 2.0: SQL, Speed, Scale
Apache Hive 2.0: SQL, Speed, Scale
 
Summer Internship Report (National Engineering Services Pakistan)-2014
Summer Internship Report (National Engineering Services Pakistan)-2014Summer Internship Report (National Engineering Services Pakistan)-2014
Summer Internship Report (National Engineering Services Pakistan)-2014
 
Blundell Dissertation Defense - 3.31.2015 REVISED
Blundell Dissertation Defense - 3.31.2015 REVISEDBlundell Dissertation Defense - 3.31.2015 REVISED
Blundell Dissertation Defense - 3.31.2015 REVISED
 
Introduction to Apache Hive
Introduction to Apache HiveIntroduction to Apache Hive
Introduction to Apache Hive
 
The Dark Knight - Production Marketing and Audience
The Dark Knight - Production Marketing and AudienceThe Dark Knight - Production Marketing and Audience
The Dark Knight - Production Marketing and Audience
 

Similar to Reading

216999608 capri-working-paper-13-2
216999608 capri-working-paper-13-2216999608 capri-working-paper-13-2
216999608 capri-working-paper-13-2Greg Sterling
 
Advertising wouldn’t be the same without music. After sever.docx
Advertising wouldn’t be the same without music. After sever.docxAdvertising wouldn’t be the same without music. After sever.docx
Advertising wouldn’t be the same without music. After sever.docxgalerussel59292
 
Digital Streaming, Big Data, and Local Music: When Is There Enough Cowbell?
Digital Streaming, Big Data, and Local Music: When Is There Enough Cowbell?Digital Streaming, Big Data, and Local Music: When Is There Enough Cowbell?
Digital Streaming, Big Data, and Local Music: When Is There Enough Cowbell?Alek Nybro
 
Music is a very important feature when it is used in the adv.docx
Music is a very important feature when it is used in the adv.docxMusic is a very important feature when it is used in the adv.docx
Music is a very important feature when it is used in the adv.docxrosemarybdodson23141
 
File sharing and copyright
File sharing and copyrightFile sharing and copyright
File sharing and copyrightGustavo Viegas
 
Consumption Practices And Uses Of Social Tagging By Last.Fms Brazilian Users ...
Consumption Practices And Uses Of Social Tagging By Last.Fms Brazilian Users ...Consumption Practices And Uses Of Social Tagging By Last.Fms Brazilian Users ...
Consumption Practices And Uses Of Social Tagging By Last.Fms Brazilian Users ...Adriana Amaral
 
Felix Canetty-Clarke - What The Heck Does Your Audience Want? [Darker Music T...
Felix Canetty-Clarke - What The Heck Does Your Audience Want? [Darker Music T...Felix Canetty-Clarke - What The Heck Does Your Audience Want? [Darker Music T...
Felix Canetty-Clarke - What The Heck Does Your Audience Want? [Darker Music T...Tommy Darker
 
The American Music Industry5 The Am.docx
The American Music Industry5        The Am.docxThe American Music Industry5        The Am.docx
The American Music Industry5 The Am.docxlillie234567
 
Market research
Market researchMarket research
Market researchSnazymedia
 
Final paper fys
Final paper fysFinal paper fys
Final paper fyslostwinds
 
Music and Social Media.pdf
Music and Social Media.pdfMusic and Social Media.pdf
Music and Social Media.pdfPeterYarrow4
 
GENeral Admission: A Consumer Behavior Approach in Marketing to the Millennia...
GENeral Admission: A Consumer Behavior Approach in Marketing to the Millennia...GENeral Admission: A Consumer Behavior Approach in Marketing to the Millennia...
GENeral Admission: A Consumer Behavior Approach in Marketing to the Millennia...Vino Mazzei
 
Back to the Future: Evolution of Music Moods From 1992 to 2022
Back to the Future: Evolution of Music Moods From 1992 to 2022Back to the Future: Evolution of Music Moods From 1992 to 2022
Back to the Future: Evolution of Music Moods From 1992 to 2022AndriaLesane
 
orr_dave_Consumer_Behavior_2007
orr_dave_Consumer_Behavior_2007orr_dave_Consumer_Behavior_2007
orr_dave_Consumer_Behavior_2007David Orr
 
Music ethics
Music ethicsMusic ethics
Music ethicswaleed92
 

Similar to Reading (20)

216999608 capri-working-paper-13-2
216999608 capri-working-paper-13-2216999608 capri-working-paper-13-2
216999608 capri-working-paper-13-2
 
488Paper
488Paper488Paper
488Paper
 
Advertising wouldn’t be the same without music. After sever.docx
Advertising wouldn’t be the same without music. After sever.docxAdvertising wouldn’t be the same without music. After sever.docx
Advertising wouldn’t be the same without music. After sever.docx
 
Digital Streaming, Big Data, and Local Music: When Is There Enough Cowbell?
Digital Streaming, Big Data, and Local Music: When Is There Enough Cowbell?Digital Streaming, Big Data, and Local Music: When Is There Enough Cowbell?
Digital Streaming, Big Data, and Local Music: When Is There Enough Cowbell?
 
Music is a very important feature when it is used in the adv.docx
Music is a very important feature when it is used in the adv.docxMusic is a very important feature when it is used in the adv.docx
Music is a very important feature when it is used in the adv.docx
 
File sharing and copyright
File sharing and copyrightFile sharing and copyright
File sharing and copyright
 
Fys iii
Fys iiiFys iii
Fys iii
 
Consumption Practices And Uses Of Social Tagging By Last.Fms Brazilian Users ...
Consumption Practices And Uses Of Social Tagging By Last.Fms Brazilian Users ...Consumption Practices And Uses Of Social Tagging By Last.Fms Brazilian Users ...
Consumption Practices And Uses Of Social Tagging By Last.Fms Brazilian Users ...
 
Felix Canetty-Clarke - What The Heck Does Your Audience Want? [Darker Music T...
Felix Canetty-Clarke - What The Heck Does Your Audience Want? [Darker Music T...Felix Canetty-Clarke - What The Heck Does Your Audience Want? [Darker Music T...
Felix Canetty-Clarke - What The Heck Does Your Audience Want? [Darker Music T...
 
The American Music Industry5 The Am.docx
The American Music Industry5        The Am.docxThe American Music Industry5        The Am.docx
The American Music Industry5 The Am.docx
 
Market research
Market researchMarket research
Market research
 
Final paper fys
Final paper fysFinal paper fys
Final paper fys
 
Final paper fys
Final paper fysFinal paper fys
Final paper fys
 
Music and Social Media.pdf
Music and Social Media.pdfMusic and Social Media.pdf
Music and Social Media.pdf
 
GENeral Admission: A Consumer Behavior Approach in Marketing to the Millennia...
GENeral Admission: A Consumer Behavior Approach in Marketing to the Millennia...GENeral Admission: A Consumer Behavior Approach in Marketing to the Millennia...
GENeral Admission: A Consumer Behavior Approach in Marketing to the Millennia...
 
Back to the Future: Evolution of Music Moods From 1992 to 2022
Back to the Future: Evolution of Music Moods From 1992 to 2022Back to the Future: Evolution of Music Moods From 1992 to 2022
Back to the Future: Evolution of Music Moods From 1992 to 2022
 
orr_dave_Consumer_Behavior_2007
orr_dave_Consumer_Behavior_2007orr_dave_Consumer_Behavior_2007
orr_dave_Consumer_Behavior_2007
 
Music ethics
Music ethicsMusic ethics
Music ethics
 
Powerpoint To Help Task 3
Powerpoint To Help Task 3Powerpoint To Help Task 3
Powerpoint To Help Task 3
 
Powerpoint To Help Task 3
Powerpoint To Help Task 3Powerpoint To Help Task 3
Powerpoint To Help Task 3
 

More from Samuel McNamara

Independent Research Task - Memento Postmodern Study - A2 Media Studies
Independent Research Task - Memento Postmodern Study - A2 Media StudiesIndependent Research Task - Memento Postmodern Study - A2 Media Studies
Independent Research Task - Memento Postmodern Study - A2 Media StudiesSamuel McNamara
 
Plan for Music Video Project Evaluation
Plan for Music Video Project EvaluationPlan for Music Video Project Evaluation
Plan for Music Video Project EvaluationSamuel McNamara
 
Axillary Text Past Student Work
Axillary Text Past Student WorkAxillary Text Past Student Work
Axillary Text Past Student WorkSamuel McNamara
 
Shotlist - Media Music Video
Shotlist - Media Music VideoShotlist - Media Music Video
Shotlist - Media Music VideoSamuel McNamara
 
Audience Feedback Survey - A2 Media Studies
Audience Feedback Survey - A2 Media StudiesAudience Feedback Survey - A2 Media Studies
Audience Feedback Survey - A2 Media StudiesSamuel McNamara
 
Music Video Analysis for A2 Media Studies - Radiohead - No Suprises
Music Video Analysis for A2 Media Studies - Radiohead - No SuprisesMusic Video Analysis for A2 Media Studies - Radiohead - No Suprises
Music Video Analysis for A2 Media Studies - Radiohead - No SuprisesSamuel McNamara
 
Music Video Styles - A2 Media Studies
Music Video Styles - A2 Media StudiesMusic Video Styles - A2 Media Studies
Music Video Styles - A2 Media StudiesSamuel McNamara
 
Media A2 Music Video Analysis
Media  A2 Music Video AnalysisMedia  A2 Music Video Analysis
Media A2 Music Video AnalysisSamuel McNamara
 
Past Student Work Analysis - Inner Evil
Past Student Work Analysis - Inner EvilPast Student Work Analysis - Inner Evil
Past Student Work Analysis - Inner EvilSamuel McNamara
 

More from Samuel McNamara (20)

Independent Research Task - Memento Postmodern Study - A2 Media Studies
Independent Research Task - Memento Postmodern Study - A2 Media StudiesIndependent Research Task - Memento Postmodern Study - A2 Media Studies
Independent Research Task - Memento Postmodern Study - A2 Media Studies
 
Plan for Music Video Project Evaluation
Plan for Music Video Project EvaluationPlan for Music Video Project Evaluation
Plan for Music Video Project Evaluation
 
Music In Ads
Music In AdsMusic In Ads
Music In Ads
 
Axillary Text Past Student Work
Axillary Text Past Student WorkAxillary Text Past Student Work
Axillary Text Past Student Work
 
Shotlist - Media Music Video
Shotlist - Media Music VideoShotlist - Media Music Video
Shotlist - Media Music Video
 
Audience Feedback Survey - A2 Media Studies
Audience Feedback Survey - A2 Media StudiesAudience Feedback Survey - A2 Media Studies
Audience Feedback Survey - A2 Media Studies
 
Music Video Analysis for A2 Media Studies - Radiohead - No Suprises
Music Video Analysis for A2 Media Studies - Radiohead - No SuprisesMusic Video Analysis for A2 Media Studies - Radiohead - No Suprises
Music Video Analysis for A2 Media Studies - Radiohead - No Suprises
 
Music Video Styles - A2 Media Studies
Music Video Styles - A2 Media StudiesMusic Video Styles - A2 Media Studies
Music Video Styles - A2 Media Studies
 
Which Record Label?
Which Record Label?Which Record Label?
Which Record Label?
 
Division of labour
Division of labourDivision of labour
Division of labour
 
Bastille - Good Grief
Bastille - Good GriefBastille - Good Grief
Bastille - Good Grief
 
Bastille good grief
Bastille   good griefBastille   good grief
Bastille good grief
 
360° Video & VR
360° Video & VR360° Video & VR
360° Video & VR
 
Warner Music Group
Warner Music GroupWarner Music Group
Warner Music Group
 
The Music Industry
The Music IndustryThe Music Industry
The Music Industry
 
Media A2 Music Video Analysis
Media  A2 Music Video AnalysisMedia  A2 Music Video Analysis
Media A2 Music Video Analysis
 
Andrew goodwin
Andrew goodwinAndrew goodwin
Andrew goodwin
 
List
ListList
List
 
Titles
TitlesTitles
Titles
 
Past Student Work Analysis - Inner Evil
Past Student Work Analysis - Inner EvilPast Student Work Analysis - Inner Evil
Past Student Work Analysis - Inner Evil
 

Recently uploaded

Full Stack Web Development Course for Beginners
Full Stack Web Development Course  for BeginnersFull Stack Web Development Course  for Beginners
Full Stack Web Development Course for BeginnersSabitha Banu
 
भारत-रोम व्यापार.pptx, Indo-Roman Trade,
भारत-रोम व्यापार.pptx, Indo-Roman Trade,भारत-रोम व्यापार.pptx, Indo-Roman Trade,
भारत-रोम व्यापार.pptx, Indo-Roman Trade,Virag Sontakke
 
Capitol Tech U Doctoral Presentation - April 2024.pptx
Capitol Tech U Doctoral Presentation - April 2024.pptxCapitol Tech U Doctoral Presentation - April 2024.pptx
Capitol Tech U Doctoral Presentation - April 2024.pptxCapitolTechU
 
How to Make a Pirate ship Primary Education.pptx
How to Make a Pirate ship Primary Education.pptxHow to Make a Pirate ship Primary Education.pptx
How to Make a Pirate ship Primary Education.pptxmanuelaromero2013
 
Enzyme, Pharmaceutical Aids, Miscellaneous Last Part of Chapter no 5th.pdf
Enzyme, Pharmaceutical Aids, Miscellaneous Last Part of Chapter no 5th.pdfEnzyme, Pharmaceutical Aids, Miscellaneous Last Part of Chapter no 5th.pdf
Enzyme, Pharmaceutical Aids, Miscellaneous Last Part of Chapter no 5th.pdfSumit Tiwari
 
KSHARA STURA .pptx---KSHARA KARMA THERAPY (CAUSTIC THERAPY)————IMP.OF KSHARA ...
KSHARA STURA .pptx---KSHARA KARMA THERAPY (CAUSTIC THERAPY)————IMP.OF KSHARA ...KSHARA STURA .pptx---KSHARA KARMA THERAPY (CAUSTIC THERAPY)————IMP.OF KSHARA ...
KSHARA STURA .pptx---KSHARA KARMA THERAPY (CAUSTIC THERAPY)————IMP.OF KSHARA ...M56BOOKSTORE PRODUCT/SERVICE
 
Proudly South Africa powerpoint Thorisha.pptx
Proudly South Africa powerpoint Thorisha.pptxProudly South Africa powerpoint Thorisha.pptx
Proudly South Africa powerpoint Thorisha.pptxthorishapillay1
 
DATA STRUCTURE AND ALGORITHM for beginners
DATA STRUCTURE AND ALGORITHM for beginnersDATA STRUCTURE AND ALGORITHM for beginners
DATA STRUCTURE AND ALGORITHM for beginnersSabitha Banu
 
“Oh GOSH! Reflecting on Hackteria's Collaborative Practices in a Global Do-It...
“Oh GOSH! Reflecting on Hackteria's Collaborative Practices in a Global Do-It...“Oh GOSH! Reflecting on Hackteria's Collaborative Practices in a Global Do-It...
“Oh GOSH! Reflecting on Hackteria's Collaborative Practices in a Global Do-It...Marc Dusseiller Dusjagr
 
Introduction to AI in Higher Education_draft.pptx
Introduction to AI in Higher Education_draft.pptxIntroduction to AI in Higher Education_draft.pptx
Introduction to AI in Higher Education_draft.pptxpboyjonauth
 
Introduction to ArtificiaI Intelligence in Higher Education
Introduction to ArtificiaI Intelligence in Higher EducationIntroduction to ArtificiaI Intelligence in Higher Education
Introduction to ArtificiaI Intelligence in Higher Educationpboyjonauth
 
Historical philosophical, theoretical, and legal foundations of special and i...
Historical philosophical, theoretical, and legal foundations of special and i...Historical philosophical, theoretical, and legal foundations of special and i...
Historical philosophical, theoretical, and legal foundations of special and i...jaredbarbolino94
 
Meghan Sutherland In Media Res Media Component
Meghan Sutherland In Media Res Media ComponentMeghan Sutherland In Media Res Media Component
Meghan Sutherland In Media Res Media ComponentInMediaRes1
 
Computed Fields and api Depends in the Odoo 17
Computed Fields and api Depends in the Odoo 17Computed Fields and api Depends in the Odoo 17
Computed Fields and api Depends in the Odoo 17Celine George
 
ECONOMIC CONTEXT - PAPER 1 Q3: NEWSPAPERS.pptx
ECONOMIC CONTEXT - PAPER 1 Q3: NEWSPAPERS.pptxECONOMIC CONTEXT - PAPER 1 Q3: NEWSPAPERS.pptx
ECONOMIC CONTEXT - PAPER 1 Q3: NEWSPAPERS.pptxiammrhaywood
 
CELL CYCLE Division Science 8 quarter IV.pptx
CELL CYCLE Division Science 8 quarter IV.pptxCELL CYCLE Division Science 8 quarter IV.pptx
CELL CYCLE Division Science 8 quarter IV.pptxJiesonDelaCerna
 

Recently uploaded (20)

Model Call Girl in Tilak Nagar Delhi reach out to us at 🔝9953056974🔝
Model Call Girl in Tilak Nagar Delhi reach out to us at 🔝9953056974🔝Model Call Girl in Tilak Nagar Delhi reach out to us at 🔝9953056974🔝
Model Call Girl in Tilak Nagar Delhi reach out to us at 🔝9953056974🔝
 
Full Stack Web Development Course for Beginners
Full Stack Web Development Course  for BeginnersFull Stack Web Development Course  for Beginners
Full Stack Web Development Course for Beginners
 
भारत-रोम व्यापार.pptx, Indo-Roman Trade,
भारत-रोम व्यापार.pptx, Indo-Roman Trade,भारत-रोम व्यापार.pptx, Indo-Roman Trade,
भारत-रोम व्यापार.pptx, Indo-Roman Trade,
 
Capitol Tech U Doctoral Presentation - April 2024.pptx
Capitol Tech U Doctoral Presentation - April 2024.pptxCapitol Tech U Doctoral Presentation - April 2024.pptx
Capitol Tech U Doctoral Presentation - April 2024.pptx
 
ESSENTIAL of (CS/IT/IS) class 06 (database)
ESSENTIAL of (CS/IT/IS) class 06 (database)ESSENTIAL of (CS/IT/IS) class 06 (database)
ESSENTIAL of (CS/IT/IS) class 06 (database)
 
How to Make a Pirate ship Primary Education.pptx
How to Make a Pirate ship Primary Education.pptxHow to Make a Pirate ship Primary Education.pptx
How to Make a Pirate ship Primary Education.pptx
 
Enzyme, Pharmaceutical Aids, Miscellaneous Last Part of Chapter no 5th.pdf
Enzyme, Pharmaceutical Aids, Miscellaneous Last Part of Chapter no 5th.pdfEnzyme, Pharmaceutical Aids, Miscellaneous Last Part of Chapter no 5th.pdf
Enzyme, Pharmaceutical Aids, Miscellaneous Last Part of Chapter no 5th.pdf
 
KSHARA STURA .pptx---KSHARA KARMA THERAPY (CAUSTIC THERAPY)————IMP.OF KSHARA ...
KSHARA STURA .pptx---KSHARA KARMA THERAPY (CAUSTIC THERAPY)————IMP.OF KSHARA ...KSHARA STURA .pptx---KSHARA KARMA THERAPY (CAUSTIC THERAPY)————IMP.OF KSHARA ...
KSHARA STURA .pptx---KSHARA KARMA THERAPY (CAUSTIC THERAPY)————IMP.OF KSHARA ...
 
Proudly South Africa powerpoint Thorisha.pptx
Proudly South Africa powerpoint Thorisha.pptxProudly South Africa powerpoint Thorisha.pptx
Proudly South Africa powerpoint Thorisha.pptx
 
Model Call Girl in Bikash Puri Delhi reach out to us at 🔝9953056974🔝
Model Call Girl in Bikash Puri  Delhi reach out to us at 🔝9953056974🔝Model Call Girl in Bikash Puri  Delhi reach out to us at 🔝9953056974🔝
Model Call Girl in Bikash Puri Delhi reach out to us at 🔝9953056974🔝
 
OS-operating systems- ch04 (Threads) ...
OS-operating systems- ch04 (Threads) ...OS-operating systems- ch04 (Threads) ...
OS-operating systems- ch04 (Threads) ...
 
DATA STRUCTURE AND ALGORITHM for beginners
DATA STRUCTURE AND ALGORITHM for beginnersDATA STRUCTURE AND ALGORITHM for beginners
DATA STRUCTURE AND ALGORITHM for beginners
 
“Oh GOSH! Reflecting on Hackteria's Collaborative Practices in a Global Do-It...
“Oh GOSH! Reflecting on Hackteria's Collaborative Practices in a Global Do-It...“Oh GOSH! Reflecting on Hackteria's Collaborative Practices in a Global Do-It...
“Oh GOSH! Reflecting on Hackteria's Collaborative Practices in a Global Do-It...
 
Introduction to AI in Higher Education_draft.pptx
Introduction to AI in Higher Education_draft.pptxIntroduction to AI in Higher Education_draft.pptx
Introduction to AI in Higher Education_draft.pptx
 
Introduction to ArtificiaI Intelligence in Higher Education
Introduction to ArtificiaI Intelligence in Higher EducationIntroduction to ArtificiaI Intelligence in Higher Education
Introduction to ArtificiaI Intelligence in Higher Education
 
Historical philosophical, theoretical, and legal foundations of special and i...
Historical philosophical, theoretical, and legal foundations of special and i...Historical philosophical, theoretical, and legal foundations of special and i...
Historical philosophical, theoretical, and legal foundations of special and i...
 
Meghan Sutherland In Media Res Media Component
Meghan Sutherland In Media Res Media ComponentMeghan Sutherland In Media Res Media Component
Meghan Sutherland In Media Res Media Component
 
Computed Fields and api Depends in the Odoo 17
Computed Fields and api Depends in the Odoo 17Computed Fields and api Depends in the Odoo 17
Computed Fields and api Depends in the Odoo 17
 
ECONOMIC CONTEXT - PAPER 1 Q3: NEWSPAPERS.pptx
ECONOMIC CONTEXT - PAPER 1 Q3: NEWSPAPERS.pptxECONOMIC CONTEXT - PAPER 1 Q3: NEWSPAPERS.pptx
ECONOMIC CONTEXT - PAPER 1 Q3: NEWSPAPERS.pptx
 
CELL CYCLE Division Science 8 quarter IV.pptx
CELL CYCLE Division Science 8 quarter IV.pptxCELL CYCLE Division Science 8 quarter IV.pptx
CELL CYCLE Division Science 8 quarter IV.pptx
 

Reading

  • 1. RESEARCH ARTICLE SOCIAL MEDIA, TRADITIONAL MEDIA, AND MUSIC SALES 1 Sanjeev Dewan Paul Merage School of Business, University of California, Irvine, Irvine, CA 92697 U.S.A. {sdewan@uci.edu} Jui Ramaprasad Desautels Faculty of Management, McGill University, Montreal, QC H3A 1G5 CANADA {jui.ramaprasad@mcgill.ca} Motivated by the growingimportance of social media,this paper examines the relationship between new media, old media, and sales in the context of the music industry. In particular, we study the interplay between blog buzz, radio play, and music sales at both the album and song levels of analysis. We employ the panel vector autoregression (PVAR) methodology, an extension of vector autoregression to panel data. We find that radio play is consistently and positively related to future sales at both the song and album levels. Blog buzz, however, is not related to album sales and negatively related to song sales, suggesting that sales displacement due to free online sampling dominates any positive word-of-mouth effects of song buzz on sales. Further, the negative relationship between song buzz and sales is stronger for niche music relative to mainstream music, and for less popular songs within albums. We discuss the implications of these results for both research and practice regarding the role of new media in the music industry. Keywords: Social media, traditional media, music industry, panel vector auto-regression, blog buzz, music sales Introduction1 New media driven by user-generated content is starting to displace traditional media in terms of the way consumers learn about products and services, and even how they consume them. The music industry is a bellwether for this revolution, where social media are increasingly used for sharing information about music albums and songs—and also for the sharing of the music itself. Traditionally, users dis- covered music either through radio play or from their friends, and consumed it through album purchases (see Peitz and Waelbroeck 2004). Now, users are increasingly discovering music through social media (such as music blogs and online music services) and consuming digital versions of songs and albums, often made available online by other consumers. These dynamics are not only changing consumer behavior but also impacting the size and shape of music sales (see Dewan and Ramaprasad 2008, 2012). Our objective in this study is to examine the interaction between new media, traditional media, and sales as it applies to the music industry. The recent disruption of the music industry can be traced back to the arrival of online peer-to-peer technologies such as Napster. The key to the disruption were two characteristics of music: the information goods nature of the product and that it is an experience good. The fact that songs are infor- mation goods makes them shareable, free, and able to be distributed unbundled from the album. With the arrival of social media, people have many alternatives for discovering new artists, sharing recommendations, and consuming music. Discovery and sharing now often go hand-in-hand, where individuals can not only share their recommendations, but can share the actual music and allow others to sample it. Many of these interactions between individuals have been enabled through social media, including individual blogs, sites such as 1 Ravi Bapna was the accepting senior editor for this paper. Gautam Ray served as the associate editor. MIS Quarterly Vol. 38 No. 1, pp. 101-121/March 2014 101
  • 2. Dewan and Ramaprasad/Social Media, Traditional Media, and Music Sales Last.fm, the Hype Machine, Mog, and Pandora, and video streaming sites like YouTube. The decline of sales in the music industry over the last decade has often been attributed to peer-to-peer sharing of music online (Siwek 2007), with record labels arguing that this has cost the record industry $55 billion in revenue over the last decade (Ehlrich 2011). In 2010 alone, revenues from global recorded music fell by over 8 percent, amounting to almost $1.5 billion. The increase in digital sales of 5.3 percent ($4.6 billion) did not compensate for the decline in physical sales of 14.2 percent or $10.4 billion.2 Looking at just the United States shows a similar story: overall shipments of recorded music in the United States fell 11 percent to $6.9 billion, while growth in digital formats only partially offset a decline of 20 percent by value in physical formats. Our empirical analysis addresses in part the impact of new media on music sales, both at the album and song level. Specifically, our research questions are • What are the relative impacts of social versus traditional media on music sales? • How do these impacts vary at the song-level versus the album-level, and for mainstream versus niche music? To address these questions, we have assembled music album and song sales data from Nielsen SoundScan, and obtained radio play data from the same source as well. Our social media variables are constructed fromthe volume of blog posts about the album or song in question, which we call blog buzz, and it is measured using Google Blog Search. This is consis- tent with the approach of Stephen and Galak (2012) and Dhar and Chang (2009) who also operationalize online buzz through measures of volume of postings online. Our blog buzz measure captures—among other things—music blog activity, which is arguably the primary mechanism by which consumers share music and music-related information with each other. While blog buzz is no doubt a narrower measure than social media buzz (which includes music sharing on Facebook, Twitter, MySpace, etc.), we find that blog buzz is highly correlated with other online music activity, such as Last.fm listens and Amazon music sales rank, suggesting that blog buzz is likely a good proxy for overall social media music interaction. Our empirical analysis is conducted using the panel vector autoregression (PVAR) model, which is an extension of tradi- tional VAR for panel data. The advantages of using the PVAR approach, as opposed to traditional multiple regres- sion, are as follows: First, we are able to treat all of the key variables (buzz, radio play, and sales) as jointly endogenous, and assess the nature of bidirectional causality between all pairs of variables. Second, the model allows for lagged ef- fects within and across time series, so we can understand the dynamic relationships between all variables. Third, we are able to illustrate the effects of a shock in one variable on other variables as a function of time, using impulse response functions. A summary of our findings is as follows: We find that the relationship between traditional media and sales and social media and sales differ from each other. These relationships are also different at the song level versus the album level. Specifically, we find that traditional media (radio play) has a positive relationship with both song and album sales. Interestingly, the relationship between social media (blog buzz) and album sales is largely insignificant, while the rela- tionship between social media and sales at the song level is negative. Further, this negative relationship is more signifi- cant for niche music as compared to mainstream music and for the less popular songs in an album. Our explanation for this surprising negative relative relation- ship between song buzz and song sales centers on the dual nature of social media, as a platform for sharing not just information and opinions about music, but also for sharing the music itself. A spike in blog buzz about a piece of music is typically accompanied by a contemporaneous spike in the supply of free shareable music online. The negative associa- tion between song buzz and sales is likely due to the fact that the sales displacement caused by free online sampling dominates any potential incremental sales due to positive word-of-mouth influence of buzz on sales. It is important to note that our resultsreflect short-termdynamics between buzz and sales, and they do not rule out the possibility of positive impacts of song/album buzz on sales in the long term. The rest of the paper is structured as follows. The next section provides an overview of the relevant prior literature and lays out the theoretical underpinnings of our work. We then develop our PVAR empirical specification, after which we describe the data we have assembled for this study and discuss our results and robustness checks. In the final section, we provide some discussion and concluding remarks. Background and Prior Literature Related Prior Work Our analysis draws from and contributes to the literature dealing with (1) social media and market outcomes and2 http://76.74.24.142/DB3D7CCB-1E88-03DF-387D-E0F1FBBC4775.pdf. 102 MIS Quarterly Vol. 38 No. 1/March 2014
  • 3. Dewan and Ramaprasad/Social Media, Traditional Media, and Music Sales (2) impact of social media in the music industry. A key issue addressed in the first stream of the literature has to do with the influence of consumer opinions (reviews, recommendations) and actions (consumption choices) on product sales. A num- ber of papers have examined the influence of product reviews on sales, such as Godes and Mayzlin (2004) for TV show ratings, Chevalier and Mayzlin (2006) for books, and Chintagunta et al. (2010), Dellarocas et al. (2007), Duan et al. (2008), Liu (2006), and Moon et al. (2010) for movies. Typical results in this body of work are as follow: product sales are positively related to the volume and valence (e.g., star rating) of reviews; negative reviews are more influential than positive ones; consumer word of mouth is more impor- tant for niche products; featured reviews and reviews posted by reputable reviewers are more impactful (Forman et al. 2008); and the actual text of reviews offers incremental explanatory power beyond the average ratings (Ghose and Ipeirotis 2011). In a different context, Dewan and Hsu (2004) studied the impact of seller ratings (a product of word-of- mouth) on probability of sale and price in online auctions on eBay. Finally, some studies have looked at the role of obser- vational learning, or learning from the past actions of other consumers, on product sales; for example, Chen et al. (2010) found that the display of product popularity information on Amazon is associated with increased incremental sales. More recent research has examined the association between social media activity and market outcomes. For example, Onishi and Manchanda (2012) look at the impact of blogging on product sales of three products in Japan: green tea drinks, movies, and cellular phone subscriptions. They find a clear link between blogging volume and valence on product sales. They also examine the interaction between new media and traditional media and find that TV advertising has the effect of spurring additional blogging activity, especially in the pre- release period. Rui et al. (2011) examine the relationship between Twitter messages and sales, finding that valence of the tweet, influence level of the tweeter, and the intention expressed by the tweeter to watch a specific film all matter when examining the influence on sales. The study closest to our research questions, Dhar and Chang (2009), asks whether blog “chatter” is predictive of future album sales. Sales are imputed from Amazon album sales rank and blog chatter is measured by the total number of blog posts about the album using Technorati blog search. The results suggest that blog chatter is predictive of future sales, as is the volume of main- stream reviews, but the number of MySpace friends is not significant. While our study has similar goals to Dhar and Chang, there are a number of key differences. We have obtained actual music sales data (from Nielsen SoundScan) at both the album and song level. Further, we look at blog buzz at both the album and song levels. Our analysis incorporates both new media (blog buzz) and traditional media (radio play) and examines the possibility of bidirectional causality using Granger causality and panel vector autoregression (PVAR). Our research also contributes to the literature that has examined the impact of emerging technologies on the music industry. Given the decline in music sales, there is significant research attention given to questions of whether and to what extent new technologies and media are responsible for the sales decline. With respect to peer-to-peer music sharing technologies, Rob and Waldfogel (2006) estimate that each album download displaces purchases by 0.2 albums. Simi- larly, Zentner (2006) finds that peer-to-peer usage reduces the probability of buying music by 30 percent. In a more recent study, Waldfogel (2010) reexamines the issue of sales dis- placement due to illegal file sharing in the presence of a legal download service: iTunes. The real-world experiment, which used University of Pennsylvania undergraduates as subjects, found that an additional song illegally downloaded reduces paid consumption by between a third and a sixth of a song, which is similar in magnitude to the earlier study. The study by Liebowitz (2004) similarly found that file sharing and mp3 downloads have resulted in sales displacement at the rate of 15 to 20 percent. Other research is examining the impact of social media on music sales, of which the Dhar and Chang study is one example. In the same vein, Morales-Arroyo and Pandey (2010) and Abel et al. (2010) also examine the value of electronic word-of-mouth (WOM) and online chatter, respec- tively, in predicting future music album sales. Chellappa and Chen (2009) show that sampling on MySpace has a positive relationship with music purchases. Chen et al. (2011) also look at MySpace data and find that music sales are positively related with bulletins and friend’s updates on the artist’s profile pages. These effects are amplified by the number of friends that the artist has on MySpace. Dewan and Ramaprasad (2012) shift the focus from sales to a different form of music consumption, which is full-track online sampling, a form of free consumption enabled by the ability of users to upload and share digital versions of songs (see also Peitz and Waelbroeck 2006). Based on data from one of the largest music blog aggregators, and motivated by theories of observational learning, Dewan and Ramaprasad (2012) document robust empirical results showing that music sampling is positively associated with music and blog popu- larity, and these effects are stronger for niche music as com- pared to mainstream music, raising some intriguing questions about the potential long-tailing of music sampling and sales. Dewan and Ramaprasad (2008) is similar in spirit to the MIS Quarterly Vol. 38 No. 1/March 2014 103
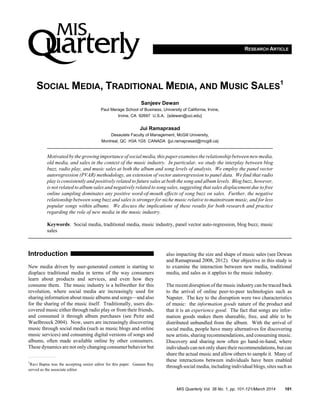
  • 4. Dewan and Ramaprasad/Social Media, Traditional Media, and Music Sales present study, but the research design is limited to albums (not songs) and social media alone (not radio play). Theoretical Background The objective of this paper, as illustrated in the conceptual framework of Figure 1, is to understand the interactions between new media (blog buzz), traditional media (radio play), and music sales at both the album and song levels. We are also interested in understanding how these interactions are moderated by music characteristics such as niche versus mainstream music, as indicated by the type of record label (major or independent) and artist reputation. Within this broad framework, we are most interested in the effect of buzz on music sales, which is where we start our discussion. We can posit both a positive and a negative association between social media buzz and music sales. The positive effect of buzz on sales is due to the WOM effect, whereby social interactions and influence between consumers affect consumer decision making. The blogging and sharing of a piece of music implicitly conveys a positive opinion about the piece, potentially influencing other consumers to not only sample the music, usually through full-track streaming (Dewan and Ramaprasad 2012), but to purchase it as well (Dhar and Chang 2009). Indeed, a recent music consumer survey (Nielsen 2012) indicates that positive recommen- dations from a friend and positive feedback from a blog or chat room are among the most likely factors to influence music purchase decisions, which is consistent with King and Balasubramanian’s (1994) argument that other-based prefer- ence formation is particularly important for experience goods. In the aggregate, the higher the buzz about a piece of music, the greater the potential influence on consumers, which should ultimately translate into higher sales of the music that is blogged about. We turn now to the potential negative effect of buzz on sales, which on the face of it appears quite counterintuitive. It arises from the information goods nature of music and the dual nature of social media, not only as a disseminator of infor- mation about music (i.e., a source of WOM) but as a platform for sharing the music as well. Here, music is typically con- sumed through the use of full-track streaming, which we have referred to as sampling in prior work (see Dewan and Rama- prasad 2012). In other words, social media such as music blogs can be used by consumers not only to share music consumption choices and opinions, but also to share the actual music itself. Indeed, the typical music blog post includes a discussion of songs, albums, or artists along with mp3 links for the streaming of specific songs that the blogger chooses to share. It is not uncommon for an entire blog post to consist of a listing of mp3 links for all of the songs from an album. Thus, a spike in buzz about a piece of music increases the volume of information about it, and at the same time the spike in buzz also results in a jump in the supply of free music that is easily accessible by interested consumers. Indeed, music consumption through full-track streaming is a free substitute for consumption through sales, and this sampling-driven sales displacement leads to the negative effect of buzz on sales. Whether or not this negative effect dominates the afore- mentioned positive WOM effect is ultimately an empirical question, which we hope to answer through our analysis. The next question of theoretical interest is how the rela- tionship between buzz and sales is different across different categories of music characteristics. The key characteristics that we focus on are music preference (mainstream or niche) and consumption preference (albums or songs). Table 1 sum- marizes how these characteristics interact to affect the modes of music discovery (traditional media or social media) and consumption (CDs or digital downloads). Mainstream music is that music preferred by the mass market, and thus more likely to be publicized and discovered through traditional media, while niche music has an inherently smaller market of interested consumers. Niche music is almost exclusively discovered through social media, not only through blog posts, but also through videos on YouTube or recommendations through online music sites. This is because niche music does not get the attention of traditional media unless it becomes wildly popular (see Stephen and Galak 2012). In terms of consumption, albums tend to be consumed in the form of CDs—60 percent of purchased albums are physical CDs― although digital downloads of entire albums is catching up because it is seen as a better value than physical CDs (Nielsen 2012). Songs, on the other hand, are almost exclusively consumed via digital downloads (Nielsen 2012). Thus, given that songs are discovered and consumed online, whereas the majority of this process is offline for albums, and since free sampling is a closer substitute for digital down- loads, we expect that the sales displacement effect will be stronger at the song level as compared to the album level. On the other hand, these differences between albums and songs do not affect the impact of positive WOM, and therefore the WOM effect would be comparable for albums and songs. Together, we can predict a positive association between buzz and sales for albums, but the corresponding prediction at the song level is ambiguous, due to the countervailing positive WOM effect and negative free online consumption effect. 104 MIS Quarterly Vol. 38 No. 1/March 2014
  • 5. Dewan and Ramaprasad/Social Media, Traditional Media, and Music Sales Song Buzz Album Buzz Song Sales Album Sales Radio Play Music Characteristics Figure 1. Conceptual Framework Table 1. Primary Modes of Music Discovery and Consumption Consumption Preference Music Preference Albums Songs Mainstream Traditional Media Social and Traditional Media CD’s Digital Downloads Niche Social Media Social Media CD’s Digital Downloads Note: In each quadrant, the top and bottom cells indicate the modes of music discovery and consumption, respectively. The scenario at the song level may become less ambiguous when distinguishing between mainstream versus niche songs. Indeed, as Table 1 shows, the difference between the two types of songs is that whereas the most popular mainstream songs might be discovered via traditional media, niche songs are almost always discovered via social media. Thus, for niche songs, music discovery and consumption are both online (usually separated by a single click), but for main- stream songs, discovery and consumption are less synchro- nized and typically occur on different media. Therefore, it is reasonable to conclude that the sales displacement effect of free sampling would be stronger for niche songs as compared to mainstream songs, and we can more confidently predict a negative relationship between buzz and sales for niche songs relative to mainstream songs. The different effect of social media versus traditional media on market outcomes is also one that has been recently ex- plored. Trusov et al. (2009) find that the WOM effect lasts longer than the effects of traditional marketing when looking at the impact on sign-ups to a social networking site. Stephen and Galak (2012) find that social media activity does impact sales (loans on Kiva.org), but only through the effect that social media has on traditional media. In the case of music, while the effect of social media on song sales is uncertain, as discussed above, we would expect a positive relationship between traditional media (radio play) and sales, due to the tremendous exposure enjoyed by the select few songs singled out to be played on radio, TV, cable, or other traditional media. Accordingly, we expect differences in the impact of traditional and social media on music consumption, which we hope to tease out in our analysis. Our study is more comprehensive in scope than prior studies in at least three ways. First, we look at the relationship be- tween buzz and sales at both the album and song levels, while MIS Quarterly Vol. 38 No. 1/March 2014 105
  • 6. Dewan and Ramaprasad/Social Media, Traditional Media, and Music Sales allowing for interactions across the levels. This is clearly important given the dramatic shift in music sales from albums to songs. Second, our research design incorporates both new media (social media) and traditional media (radio play), and thereby isolates the effect of social media beyond the effects of mainstream media. Finally, while prior work has been focused solely on the role of social media as a word of mouth platform, our study brings out the dual role of social media as both a disseminator of music information, and as a mechanism for sharing music in digital form. We employ the PVAR method for our empirical analysis. The PVAR model is suitable for studying the relationships between a system of interdependent variables without im- posing ad hoc model restrictions; for example, assuming exogeneity of some of the variables, which other econometric modeling techniques require (Adomavicius et al. 2012). In other words, this method allows us to treat all of the key variables as jointly endogenous, and to explicate dynamic effects, such as the impact of a shock in one variable on other variables over time. While the use of PVAR is fairly nascent, it has recently been employed in the management literature, particularly in Finance and Marketing. In Finance, Love and Zicchino (2006) examine the relationships between a coun- try’s financial development and its dynamic investment behavior, and Stanca and Gallegati (1999) study the link be- tween firms’ financial decisions and their investment deci- sions. In Marketing, PVAR has been used to study the per- sistent effects of marketing investments on sales (Dekimpe and Hanssens 1995), the differential impact of marketing- induced versus WOM-induced customer acquisition (Villa- nueva et al. 2008), and the effects of WOM versus traditional marketing (Trusov et al. 2009). Chen et al. (2011) also use the PVAR approach to examine artists’ MySpace broadcasts on music sales as imputed from Amazon Sales Rank. The following section provides a detailed discussion of how we use the PVAR method for the problem at hand. Empirical Methodology We examinetheinteractions between social media, traditional media, and sales (see Figure 1) at both the song and album levels. To do this, we first conduct Granger causality tests to examine the potential endogeneity between pairs of each of our three key variables, first at the song level and then at the album level. Next, we conduct the PVAR analysis, which allows us to understand the dynamic relationships between all variables. In examining the results of the PVAR analysis, we estimate and interpret the regression coefficients, create and analyze impulse response functions, and calculate elasticities between our key variables. As in traditional VAR, PVAR allows us to treat all variables as endogenous, but PVAR also allows estimation for multiple cross sections of data—some- thing not possible in traditional VAR. The panel nature of the data allows us to handle unobserved individual heterogeneity, while treating all variables as endogenous (Love and Zicchino 2006). Our PVAR model is specified (for each song or album) as follows: (1) S B R S B R t t t j J t j t j t j r j t j t j t j t j t j t j t j t j S t B t R t           =                     +           = − − − − − − − − − − − −  1 11 12 13 21 22 23 31 32 33 π π π π π π π π π ε ε ε , , , where St, Bt, and Rt denote weekly song sales, weekly song buzz, and weekly radio play, in week t(t = 1, 3, …, T), respectively. J is the order of the model, which may be determined using Akaike’s information criterion (AIC). For the analysis at the album level, the variables St and Bt are replaced by their album-level counterparts. Thus, in the song- level (album-level) analysis, song (album) sales is a function of past song (album) sales, past song (album) buzz, past radio play, and an error term. In the PVAR model, the coefficients represent the relationship between the lagged values of each of the variables (song sales, radio play, and buzz) and the variable on the left-hand side. When looking at the impact on song sales, for example, the coefficient on the first lag of radio play indicates the percentage increase in song sales in the following week corresponding to a 1 percent increase in radio play in the current week. Details of the variable opera- tionalization are provided in the “Data” section. We determine the appropriate lag length J using Akaike’s information criterion (AIC), following the standard approach in the VAR literature (see Holtz-Eakin et al. 1988; Love and Zicchino 2006). Specifically, we calculate AIC for each cross section and take the modal value of the optimal lag length among all cross sections. We performed two transformations to the main variables. First, we took the natural log of the buzz, sales, and radio play variables. In order to remove indi- vidual fixed effects that might affect our relationship of interest (such as song or album quality and advertising budgets), we performed the Helmert transformation on the song buzz, album buzz, song sales, and radio play variables following Arellano and Bover (1995) and Love and Zicchino (2006). The Helmert transformation involves the forward mean-differencing of the variables; that is, fixed effects are removed by subtracting the mean of all future observations available for each song-week. This transformation ensures 106 MIS Quarterly Vol. 38 No. 1/March 2014
  • 7. Dewan and Ramaprasad/Social Media, Traditional Media, and Music Sales orthogonality between the forward-differenced variables and their lagged values (see Love and Zicchino 2006). Therefore, to address the issue of simultaneity, the lagged regressors are used as instruments for the forward-differenced variables and the system GMM estimator is used to allow for error correlation across equations. The PVAR analysis is supplemented with the analysis of impulse response functions (IRFs) to elucidate the dynamics in the relationships of interest. IRFs show the response of one variable to an exogenous shock (i.e., a one standard deviation shock) to another variable in the system, while holding all other shocks at zero. Using IRFs, we are able to visualize the dynamics of the pairwise relationships. In other words, we can isolate the reaction of song (album) sales to an orthogonal shock in the song (album) buzz while holding radio play con- stant; similarly, we can isolate the reaction of song (album) sales to an orthogonal shock in radio play, while holding buzz constant. Together, PVAR and impulse response functions allow us to gain a comprehensive understanding of the rela- tionships between traditional media, social media, and sales. In addition to the full-sample analysis described above, we conducted a set of subsample analyses in order to understand the nuances in the set of the relationships represented in the conceptual model of Figure 1. That is, we are interested in understanding whether the relationships we observe are con- sistent for different types of music—music that is considered more and less niche. To do this, we conduct subsample analyses based on record label (major versus independent) and artist reputation (high and low). Data To conduct the PVAR analysis, we use two panel datasets. At the song level, we have a dataset including approximately 1,000 cross sections across 24 time periods (weeks). That is, for a set of approximately 1,000 songs, we have obtained weekly data on the volume of song-level blog buzz from Google Blog search (used also in Stephen and Galak), song- level unit sales, and radio play (measured by the number of “spins”) from Nielsen SoundScan, for a period of 24 weeks in 2006. Specifically, the data covers the period of June 19, 2006, to December 3, 2006. At the album level, we have created a panel of 594 albums across 24 weeks, using the albums that correspond to the songs in the song-level dataset. To construct this dataset, we obtained weekly data on the volume of album-level blog buzz using Google Blog Search as well as album unit sales from Nielsen SoundScan. To create the album-level radio play variable, we aggregated the song radio play data in the song-level dataset to the album level. We have supplemented these datasets to include infor- mation on record label and release date from allmusic.com and Amazon.com. The blog buzz data was collected through Google Blog Search, and is measured by the number of blogs that men- tioned both the exact artist name along with the exact song name (for song level) or the exact artist name and the exact album name (for album level) in a given week.3 This weekly blog buzz data is matched with corresponding weekly song and album sales from Nielsen SoundScan. This data includes both offline and online sales and is used to create the Billboard music charts. In doing this analysis, we included only songs and albums that have both sales and buzz obser- vations different from zero for at least one week during the span of the 24 weeks we are analyzing. We supplement this data with additional variables including record label (independent versus major label) and artist repu- tation; these variables do not vary over time. Artist reputation is a dummy variable, indicating whether the artist was on the Billboard “Top Artists of the Year” in any of the years between 2002 and 2006 or if the artist was on the “All-Time Hot 100 Artists” list. If the artist was on either one of these charts in the years mentioned, the “artist reputation” variable is set to one; otherwise, it is zero. Summary statistics are pre- sented in Tables 2 and 3, at the song and album levels, respec- tively. At the song level, we see that the average number of radio spins and the average song sales are higher for songs released by independent labels, although average song buzz is higher for songs and albums that are released by major labels. Radio play and song sales are higher for songs re- leased by artists who have a high artist reputation, while song buzz is higher for songs released by artists who have a lower artist reputation. At the album level, we see that radio play is higherforindependentlyreleasedmusic,althoughalbumsales are lower. Album buzz is marginally higher for independent music. Turning to artist reputation, we see that radio play, album buzz, and album sales are all higher for albums released by high reputation artists as compared to albums released by artists who have not established themselves. Results At the outset, we tested our data for stationarity: to conduct both Granger causalityandPVARanalysis, the variables must be stationary. We use the Harris-Tzavalis test (Harris and 3 Song-level posts occasionally mention the corresponding album, and vice- versa, but this overlap is small and does not affect the qualitative nature of our results (more on this in the subsection “Robustness Checks”). MIS Quarterly Vol. 38 No. 1/March 2014 107
  • 8. Dewan and Ramaprasad/Social Media, Traditional Media, and Music Sales Table 2. Summary Statistics—Song Level Full Sample Major Label Independent Label High Artist Reputation Low Artist Reputation Radio Play (# spins) 60.197 (487.843) 55.553 (323.731) 70.238 (725.193) 226.512 (1157.973) 37.552 (289.138) Song Buzz (# blog posts) 768.327 (7724.130) 934.972 (9251.646) 407.970 (1844.706) 311.3789 (1512.064) 830.543 (8212.332) Song Sales (# units) 359.402 (3295.174) 322.685 (2092.771) 439.075 (4986.696) 1227.048 (8004.678) 241.324 (1870.009) No. of observations 23832 (993 songs) 16296 (679 songs) 7536 (314 songs) 2856 (119 songs) 20976 (874 songs) Table 3. Summary Statistics—Album Level Full Sample Major Label Independent Label High Artist Reputation Low Artist Reputation Album Radio Play 100.759 (832.314) 88.724 (412.519) 131.278 (1420.182) 441.883 (2325.136) 61.719 (372.610) Album Buzz (# blog posts) 27.685 (142.795) 26.666 (114.647) 29.207 (196.899) 45.830 (106.970) 25.274 (146.192) Album Sales (# units) 985.931 (4594.503) 1145.933 (5049.051) 580.213 (3130.61) 2139.344 (7634.342) 853.927 (4086.542) No. of observations 14256 (594 albums) 10224 (426 albums) 4032 (168 albums) 1464 (61 albums) 12792 (533 albums) Table 4. Harris-Tzavalis Unit Root Test Rho Statistic Z p-value Song Sales 0.674 -48.789 0.000 Song Buzz 0.101 -1.9e02 0.000 Song Airplay 0.421 -1.1e02 0.000 Album Sales 0.784 -17.029 0.000 Album Buzz 0.084 -1.5e02 0.000 Album Airplay 0.468 -76.377 0.000 Notes: The Harris-Tzavalis unit root test is appropriate for samples with a large number of cross-sections and comparatively fewer panels. The test here is conducted on logged, Helmert transformed variables. The null hypothesis that the panels contain unit roots is rejected for all variables. Table 5. Granger Causality Tests (Song-Level) Dependent Variable Song Sales Airplay Song Buzz Song Sales — 17.32 (0.00) 9.15 (0.00) Airplay 16.84 (0.00) — 3.35 (0.00) Song Buzz 5.73(0.00) 4.60 (0.00) — Notes: The results reported are the F-statistic with the p-value in parentheses. Granger Causality tests are performed with six lags for consistency with the PVAR models (as selected by AIC). 108 MIS Quarterly Vol. 38 No. 1/March 2014
  • 9. Dewan and Ramaprasad/Social Media, Traditional Media, and Music Sales Table 6. Granger Causality Tests (Album-Level) Dependent Variable Album Sales Album Buzz Album Airplay Album Sales — 9.75 (0.00) 12.81 (0.00) Album Buzz 11.97 (0.00) — 2.66 (0.01) Album Airplay 27.80 (0.00) 1.78 (0.10) — Notes: The results reported are the F-statistic with the p-value in parentheses. Granger Causality tests are performed with 6 lags for consistency with the PVAR models (as selected by AIC). Tzavalis 1999) for panel data. Results of this test are reported in Table 4 and indicate that all of the variables are stationary. Next, we conducted Granger causality tests. The results for these tests are reported in Tables 5 and 6 and show clear evidence of bidirectional causality in each pair of variables, at both the song level and the album level. This supports our approach of analyzing the variables as a full dynamic system (Trusov et al. 2009) through PVAR analysis. The results of this analysis are reported below. Main Results The results from our PVAR analysis (Equation 1) are reported in Tables 7 and 8, for the song and album levels, respectively. We first examine the results for the regressions with sales as the dependent variable. Looking at the coeffi- cient estimates on the radio play variables, we see that the results are fairly consistent at the song and album level: radio play has a short-term positive relationship with sales, as shown by the positive and significant coefficient on the first lag (album level) or two (song level) and insignificant coefficients for the subsequent lags. However, looking at the coefficient estimates on the lagged buzz variables shows different relationships at the song and album levels. At the album level, we see that the coefficient estimates are insignificant across all lags, indicating that buzz at the album level does not have any discernible asso- ciation with sales, possibly because the positive and negative effects of buzz on sales balance each other out. At the song level, however, we see that the coefficient estimates on all of the lags are negative and significant suggesting that at the song level buzz is negatively related to sales. These con- trasting results are interesting and suggest that blog buzz potentially plays different roles in terms of predicting song versus album sales, as we discussed in the subsection “Theoretical Background.” To further quantify the relative predictive power of each of the covariates for explaining the variance of sales, we con- duct a variance decomposition analysis, reported in Table 9. The table shows the decomposition for different number of weeks ahead. What we see is that past sales are obviously the best predictor of future sales. However, the predictive power of buzz increases over time at the song level, so that about 10 percent of the variance in sales is explained by buzz at Week 6 and almost 20 percent in Week 10. By com- parison, the explanatory power of album buzz is very weak. The predictive power of airplay is limited due to the fact that most songs do not get any air time, and therefore there is very little variation in the airplay variable across songs (i.e., most values are 0). Nonetheless, the predictive value of airplay is higher for albums as compared to songs, and rises to a little over 5 percent by Week 10. Now we turn to the analysis of the relationships between sales, airplay, and buzz. When buzz is the dependent vari- able (Tables 7 and 8), we see fairly consistent results. That is, at the song level, the coefficients on the sales variables are largely negative and significant although at the album level there is no discernible pattern. Together, we see that the song-level results differ from the album-level results and that, contrary to expectations given our knowledge of the positive impact of positive word-of-mouth, buzz may not always drive consumption. An explanation for the negative association between song buzz and song sales, based on our earlier theoretical discus- sion, is that the positive WOM effect of buzz on sales is dominated by the negative sales displacement effect of free sampling. Given this, one might wonder if the sales dis- placement effect varies across songs in an album as a func- tion of song popularity. This is a pertinent question since consumers’ relative preference for buying versus freely sampling might depend on the popularity of the song. Speci- fically, consumers might be more willing to buy popular songs, but would rather freely sample (rather than buy) the less popular songs. To address this question, we characterized song popularity on the basis of Last.fm listens.4 We put every song in our 4 We used Last.fm listens to rank song popularity because we do not have sales numbers for all songs from an album. Further Last.fm listens is highly correlated with Amazon Sales rank, so it seems a valid measure of popularity. MIS Quarterly Vol. 38 No. 1/March 2014 109
  • 10. Dewan and Ramaprasad/Social Media, Traditional Media, and Music Sales Table 7. Song-Level PVAR Regression Results Dependent Variable Song Sales Song Buzz Airplay SongSalest-1 0.575*** (0.026) -0.002 (0.018) 0.052*** (0.015) SongSalest-2 0.065*** (0.011) -0.016* (0.010) -0.000 (0.008) SongSalest-3 0.037*** (0.009) -0.017** (0.008) -0.018** (0.008) SongSalest-4 0.002 (0.008) -0.017** (0.008) -0.011 (0.007) SongSalest-5 -0.011 (0.008) 0.002 (0.008) 0.000 (0.007) SongSalest-6 -0.024*** (0.009) -0.017** (0.007) -0.0182*** (0.006) SongBuzzt-1 -0.101** (0.045) 0.186** (0.036) -0.069** (0.029) SongBuzzt-2 -0.087*** (0.032) 0.107*** (0.026) -0.047** (0.021) SongBuzzt-3 -0.616*** (0.023) 0.075*** (0.020) -0.041** (0.016) SongBuzzt-4 -0.048*** (0.018) 0.041** (0.016) -0.032** (0.013) SongBuzzt-5 -0.046*** (0.019) 0.079*** (0.016) -0.031** (0.013) SongBuzzt-6 -0.054*** (0.015) 0.130*** (0.014) -0.019* (0.011) Airplayt-1 0.069*** (0.020) 0.022 (0.022) 0.390*** (0.014) Airplayt-2 0.047*** (0.014) 0.010 (0.014) 0.201*** (0.011) Airplayt-3 -0.007 (0.012) 0.013 (0.011) 0.116*** (0.011) Airplayt-4 -0.006 (0.011) 0.005 (0.010) 0.046*** (0.010) Airplayt-5 0.003 (0.011) -0.003 (0.010) 0.042*** (0.010) Airplayt-6 0.004 (0.010) -0.017** (0.007) 0.024*** (0.009) Notes: Variables are as defined in Table 1 and are logged and forward mean-differences. **, **, * denote significance at 1%, 5%, and 10%, respectively. 110 MIS Quarterly Vol. 38 No. 1/March 2014
  • 11. Dewan and Ramaprasad/Social Media, Traditional Media, and Music Sales Table 8. Album-Level PVAR Regression Results Dependent Variable Album Sales Album Buzz Airplay AlbumSalest-1 0.729*** (0.037) 0.136** (0.055) 0.065** (0.030) AlbumSalest-2 -0.012 (0.029) -0.060** (0.025) 0.006 (0.013) AlbumSalest-3 -0.009 (0.016) 0.007 (0.019) -0.013 (0.011) AlbumSalest-4 -0.009 (0.013) -0.010 (0.017) 0.006 (0.010) AlbumSalest-5 -0.009 (0.012) 0.005 (0.016) -0.014 (0.010) AlbumSalest-6 -0.018** (0.008) -0.004 (0.013) -0.006 (0.008) AlbumBuzt-1 0.003 (0.011) 0.192*** (0.021) 0.006 (0.009) AlbumBuzzt-2 0.005 (0.009) 0.139*** (0.019) 0.010 (0.007) AlbumBuzzt-3 -0.007 (0.008) 0.104*** (0.017) 0.013* (0.007) AlbumBuzzt-4 -0.005 (0.007) 0.083*** (0.016) 0.011 (0.007) AlbumBuzzt-5 0.011 (0.006) 0.050*** (0.016) 0.005 (0.006) AlbumBuzzt-6 0.010) (0.007) 0.056 (0.015) -0.001 (0.006) Airplayt-1 0.097*** (0.031) 0.007 (0.046) 0.416*** (0.022) Airplayt-2 0.030 (0.020) -0.024 (0.030) 0.186*** (0.016) Airplayt-3 -0.014 (0.016) -0.032 (0.022) 0.110*** (0.015) Airplayt-4 0.014 (0.013) 0.030 (0.020) 0.041*** (0.013) Airplayt-5 0.003 (0.011) 0.014 (0.018) 0.032** (0.013) Airplayt-6 -0.003 (0.012) -0.028 (0.017) 0.003 (0.012) Notes: Variables are as defined in Table 1 and are logged and forward mean-differences. **, **, * denote significance at 1%, 5%, and 10%, respectively. Table 9. Variance Decomposition of Sales Weeks Ahead Past Sales Buzz Airplay Song Level 2 99.03% 0.70% 0.02% 4 94.33% 4.67% 1.01% 6 88.60% 9.99% 1.44% 8 82.32% 15.95% 1.73% 10 78.23% 19.89% 1.87% Album Level 2 99.52% 0.00% 0.48% 4 98.12% 0.00% 1.86% 6 96.59% 0.05% 3.36% 8 95.22% 0.20% 4.59% 10 94.28% 0.33% 5.39% MIS Quarterly Vol. 38 No. 1/March 2014 111
  • 12. Dewan and Ramaprasad/Social Media, Traditional Media, and Music Sales Table 10. PVAR Regression Results for Different Song Subsamples Dependent Variable: Song Sales All Songs Top Three Songs Top Song SongSalest-1 0.575*** (0.026) 0.603*** (0.035) 0.635*** (0.040) SongSalest-2 0.065*** (0.011) 0.064*** (0.015) 0.080*** (0.025) SongSalest-3 0.037*** (0.009) 0.042** (0.019) 0.058*** (0.019) SongSalest-4 0.002 (0.008) 0.014 (0.011) 0.018 (0.017) SongSalest-5 -0.011 (0.008) -0.017 (0.011) -0.023 (0.015) SongSalest-6 -0.024*** (0.009) -0.010 (0.10) 0.028*** (0.012) SongBuzzt-1 -0.101** (0.045) -0.056 (0.045) 0.014 (0.055) SongBuzzt-2 -0.087*** (0.032) -0.056* (0.031) -0.012 (0.038) SongBuzzt-3 -0.616*** (0.023) -0.037 (0.024) -0.015 (0.030) SongBuzzt-4 -0.048*** (0.018) -0.015 (0.017) 0.010 (0.023) SongBuzzt-5 -0.046*** (0.019) -0.024 (0.018) -0.0001 (0.024) SongBuzzt-6 -0.054*** (0.015) -0.032** (0.014) -0.016 (0.018) Airplayt-1 0.069*** (0.020) 0.070** (0.028) 0.096*** (0.037) Airplayt-2 0.047*** (0.014) 0.043 (0.019) 0.027 (0.025) Airplayt-3 -0.007 (0.012) -0.009 (0.017) -0.027 (0.022) Airplayt-4 -0.006 (0.011) -0.021 (0.014) -0.014 (0.018) Airplayt-5 0.003 (0.011) -0.004 (0.014) -0.001 (0.016) Airplayt-6 0.004 (0.010) -0.005 (0.013) -0.027* (0.016) Notes: Variables are as defined in Table 1 and are logged and forward mean-differenced. **, **, * denote significance at 1%, 5% and 10%, respectively. data set into one of four categories, corresponding to whether the song was the first, second, third, or lower than third rank in terms of Last.fm listens across all songs in the album. Based on this classification, we conducted a comparative analysis of three subsamples of songs, as reported in Table 10: all songs, top three songs, and the top song. We focus on just song sales as the dependent variable, since that is what resulted in the most surprising result so far. Comparing the results in the three columns of Table 10, we see that while all of the song buzz variables are negative and significant for the full sample of songs, only two of the coeffi- cients are negative and significant for the top three songs sub- sample, and none of the coefficients are significant for the top song subsample. This is consistent with the notion that, in- deed, consumers do have a greater willingness to pay for the more popular songs in the album, to the point where, for the most popular song in the album, the negative sales displace- ment effect is weak enough, so as to be counter-balanced by the positive WOM effects. Thus, song popularity does ex- plain some of the variation in the effect of buzz on sales. Next, we consider the moderating role of other music characteristics. 112 MIS Quarterly Vol. 38 No. 1/March 2014
  • 13. Dewan and Ramaprasad/Social Media, Traditional Media, and Music Sales Sample Split Analysis We continue our analysis by exploring how the nature of relationships in Figure 1 vary based on the type of music (mainstream versus niche) using sample split analyses of record label (independent versus major) and artist reputation (high versus low).5 The results are reported in Tables 11 and 12. Looking first at the record-label sample split (Table 11), we find some interesting patterns. The radio play coefficients for both major label and independently released music at the song level are consistent with our main results, in that radio play has a short-term positive relationship with sales. At the album level, we note that this relationship is significant for independently released music, but not for major labels. For songs, both sets of radio play coefficients are significant, although the magnitude of the coefficients for independent- label music is larger than the corresponding coefficients for major-label music. That is, radio play has a stronger effect on sales of independent music, as compared to major label music, at both the song and album levels. However, the sales boost appears to be short term, as the coefficients older than the second lag are insignificant. There are also interesting differences in the estimates for the buzz variables depending on the record label. For major-label music, the relationship between song buzz and sales is insig- nificant throughout. For independent music, all of the buzz coefficients are negative and significant. So the sales displacement effect due to a spike in song buzz is long-lived, lasting at least 6 weeks. At the album-level, the insignificant relationship that we found in the main results persists here. Looking at the results of the sample split on artist reputation (Table 12), we see similar results for the relationship between buzz and sales as we did with the sample split on record label. Here, it is clear that the relationship between song buzz and song sales that we saw in the main results at both the song and album levels are driven by music released by artists who have not yet established a high reputation. Again, airplay has a short-term positive effect on sales, but in this sample split we see these results for low reputation artists only; there is no significant relationship between radio play and sales for high reputation artists at either the song level or the album level. Taken together, the record label and artist reputation sample splits provide evidence that it is perhaps less well-known music and artists whose sales are most impacted by the sales displacement effect of free sampling. Impulse Response Functions We supplement the regression estimates with the analysis of the corresponding impulse response functions (IRFs). The IRFs allow us to examine the response of one variable to a shock in another variable, and to check whether the impact is transitory or longer term. Figures 2 through 5 highlight selec- tive IRFs so we can examine the response of song sales and album sales to a shock in airplay (Figures 2 and 3) and to a shock in buzz (Figures 4 and 5), respectively. Looking at Figure 2, we see that the reaction of song sales to a shock in radio play is positive, although the effect attenuates quickly over time. In contrast, the reaction of song sales to a shock in song buzz (Figure 4) is initially close to zero and becomes more negative over time. At the album level, we see that there does not seem to be an immediate reaction of album sales to a shock in radio play (Figure 3), although after one time period the reaction increases and stays positive over time; it only marginally decreases by the sixth time period. Additionally, we see the insignificant relationship between album buzz and album sales reflected again in the corre- sponding IRFs (Figure 5)—the reaction of album sales to a shock in album buzz hovers around 0 for the six periods. Overall, comparing song versus album level reaction of sales to buzz, it is evident that while album sales have virtually no reaction to a shock in album buzz, song sales have a negative and increasingly negative reaction to a shock in song buzz. Further, the reaction of sales to radio play is positive at both the song level and the album level, peaking quickly and then declining over time. From the results of the IRFs, we are able to calculate the elasticity of sales with respect to buzz and airplay. These elasticities are presented in Tables 13 (song-level) and Table 14 (album-level). We see that overall, the elasticity of song sales with respect to airplay is positive and fairly consistent over time, while the elasticity of song sales with respect to song buzz is negative and increases in magnitude over time. This indicates that as time progresses, song sales become more sensitive to a shift in song buzz. At the album-level we find that the elasticity of album sales with respect to airplay is positive and increases in magnitude over time, while the elasticity of album sales with respect to album buzz is almost zero. Both the results presented in the IRFs and the elasticity results are consistent with the original PVAR regression results reported earlier. Robustness Checks Our basic specifications so far did not include the cross effects of album buzz and sales on song sales, and vice versa.6 5 We also conduct a sample split analysis based on genre, although our results here indicate that the relationships do not vary based on genre alone. 6 We thank an anonymous reviewer for suggesting this point. MIS Quarterly Vol. 38 No. 1/March 2014 113
  • 14. Dewan and Ramaprasad/Social Media, Traditional Media, and Music Sales Table 11. PVAR Regression Results (Sample Split on Label) Dependent Variable Song Sales Album Sales Major Independent Major Independent Buzzt-1 -0.010 (0.040) -0.385*** (0.166) -0.004 (0.013) 0.033 (0.025) Buzzt-2 -0.016 (0.027) -0.322*** (0.127) 0.007 (0.010) 0.014 (0.021) Buzzt-3 -0.010 (0.195) -.240*** (0.095) -0.011 (0.009) 0.003 (0.019) Buzzt-4 -0.177 (0.154) -0.181*** (0.774) -0.005 (0.008) 0.000 (0.018) Buzzt-5 -0.003 (0.153) -0.209*** (0.809) 0.013 (0.008) 0.006 (0.016) Buzzt-6 -0.022 (0.012) -0.183*** (0.066) 0.001 (0.007) 0.030* (0.016) Airplayt-1 0.082*** (0.031) 0.254*** (0.089) 0.073 (0.040) 0.153*** (0.044) Airplayt-2 0.050*** (0.019) 0.143*** (0.053) 0.002 (0.026) 0.086*** (0.031) Airplayt-3 -0.004 (0.014) 0.010 (0.307) -0.012 (0.020) -0.008 (0.027) Airplayt-4 0.006 (0.013) -0.023 (0.025) 0.007 (0.016) 0.036 (0.022) Airplayt-5 -0.014 (0.013) 0.049* (0.027) 0.027** (0.014) -0.032 (0.020) Airplayt-6 -0.011 (0.012) 0.048* (0.026) 0.002 (0.016) -0.008 (0.018) Notes: Variables are as defined in Table 1 and are logged and forward mean-differenced. **, **, * denote significance at 1%, 5% and 10%, respectively. Note that Buzz refers to Song Buzz when looking at the Song Sales results and refers to Album Buzz when looking at the Album Sales results. Table 12. PVAR Regression Results (Sample Split on Artist Reputation) Dependent Variable Song Sales Album Sales High Artist Reputation Low Artist Reputation High Artist Reputation Low Artist Reputation Buzzt-1 0.023 (0.119) -0.105*** (0.045) -0.141 (0.325) 0.007 (0.012) Buzzt-2 -0.009 (0.069) -0.089*** (0.033) -0.110 (0.240) 0.009 (0.010) Buzzt-3 -0.006 (0.040) -0.067*** (0.025) -0.095 (0.174) -0.005 (0.009) Buzzt-4 0.002 (0.030) -0.054*** (0.020) -0.085 (0.182) -0.003 (0.008) Buzzt-5 0.013 (0.033) -0.051*** (0.020) -0.061 (0.145) 0.013 (0.008) Buzzt-6 -0.039 (0.030) -0.053*** (0.016) -0.051 (0.083) 0.013* (0.008) Airplayt-1 0.075 (0.081) 0.070*** (0.021) 0.213 (0.345) 0.103*** (0.034) Airplayt-2 0.034 (0.048) 0.049*** (0.015) 0.137 (0.387) 0.035 (0.021) Airplayt-3 0.037 (0.052) -0.017 (0.013) 0.063 (0.192) -0.014 (0.017) Airplayt-4 -0.003 (0.041) -0.007 (0.012) 0.057 (0.134) 0.015 (0.014) Airplayt-5 -0.010 (0.036) 0.003 (0.012) 0.053 (0.160) 0.004 (0.012) Airplayt-6 0.031 (0.028) 0.002 (0.011) 0.065 (0.183) -0.002 (0.013) Notes: Variables are as defined in Table 1 and are logged and forward mean-differenced. **, **, * denote significance at 1%, 5% and 10%, respectively. 114 MIS Quarterly Vol. 38 No. 1/March 2014
  • 15. Dewan and Ramaprasad/Social Media, Traditional Media, and Music Sales Note: Errors are 5% on each side generated by Monte Carlo with 500 repetitions. Figure 2. Impulse Response Function: Response of Song Sales to Airplay Note: Errors are 5% on each side generated by Monte Carlo with 500 repetitions. Figure 3. Impulse Response Function: Response of Album Sales to Airplay Note: Errors are 5% on each side generated by Monte Carlo with 500 repetitions. Figure 4. Impulse Response Function: Response of Song Sales to Song Buzz MIS Quarterly Vol. 38 No. 1/March 2014 115
  • 16. Dewan and Ramaprasad/Social Media, Traditional Media, and Music Sales Note: Errors are 5% on each side generated by Monte Carlo with 500 repetitions. Figure 5. Impulse Response Function: Response of Song Sales to Album Buzz Table 13. Elasticity of Song Sales with Respect to Song Buzz and Airplay One Week Three Weeks Six Weeks Song Buzz -0.021 -0.044 -0.059 Airplay 0.006 0.009 0.008 Table 14. Elasticity of Album Sales with Respect to Album Buzz and Airplay One Week Three Weeks Six Weeks Album Buzz 0.001 0.001 0.000 Airplay 0.005 0.008 0.008 These cross effects could be important since blog posts that contain song names also contain album names, and thus influence album sales along with song sales—and vice versa. In other words, variation in the song (album) buzz variable to some extent captures variation in album (song) buzz as well. If these cross effects are significant, then ignoring them might lead to biased results. Accordingly, we expanded our song and albumspecifications to include albumand song variables, respectively. The PVAR estimation results for these ex- panded specifications are provided Table 15, where we focus just on song and album sales as the dependent variables. We see that the qualitative nature of our baseline results is unchanged. That is, airplay has a positive association with both album and song sales. Song buzz has a negative associa- tion with song sales, while the coefficients on album buzz in the album sales regression have mixed signs. In terms of the cross effects, album buzz appears to have a positive associa- tion with song sales, whereas the coefficients on song buzz in the album sales regression are negative and significant. The latter result reflects the fact that free sampling of songs hurts not just song sales, but corresponding album sales as well. The coefficients on album sales in the song sales regression have mixed signs, whereas song sales appear to have a nega- tive association with album sales (i.e., when people buy a song they tend not to buy the corresponding album). Next, we explore the idea that perhaps there is an “over-hype” effect that may explain the negative effect of song buzz on song sales. In other words, we explore whether the large volume of song buzz, particularly for some of the most buzzed about or “hyped” songs, is overwhelming the smaller volume of song sales, driving the negative relationship between the two. To see if this is the case, we divide the sample based on the ratio of song buzz to song sales, including the songs in the top 99th percentile mean buzz to sales ratio in the high hype group and the others in the low hype group. These results are reported in Table 16. It is clear that, even after excluding the most hyped songs, our results are consistent. We do the same exercise with the airplay to song sales ratio and, again, find that our results are consistent. 116 MIS Quarterly Vol. 38 No. 1/March 2014
  • 17. Dewan and Ramaprasad/Social Media, Traditional Media, and Music Sales Table 15. PVAR Regression Results (Both Song and Album Variables) Dependent Variable Song Sales Album Sales SongSalest-1 0.532*** (0.025) -0.059*** (0.020) SongSalest-2 0.099*** (0.013) 0.011 (0.013) SongSalest-3 0.039*** (0.010) 0.017 (0.011) SongSalest-4 -0.003 (0.009) 0.006 (0.011) SongSalest-5 0.005 (0.009) 0.001 (0.009) SongSalest-6 -0.016* (0.009) -0.031*** (0.009) SongBuzzt-1 -0.082* (0.049) -0.113*** (0.029) SongBuzzt-2 -0.067* (0.025) -0.069** (0.028) SongBuzzt-3 -0.049* (0.026) -0.046*** (0.016) SongBuzzt-4 -0.035* (0.020) -0.032* (0.017) SongBuzzt-5 -0.033 (0.021) -0.029** (0.013) SongBuzzt-6 -0.046*** (0.017) -0.029*** (0.013) SongAirplayt-1 0.051** (0.020) 0.084*** (0.021) SongAirplayt-2 0.035** (0.015) 0.021 (0.014) SongAirplayt-3 -0.008 (0.012) -0.009 (0.011) SongAirplayt-4 -0.007 (0.011) 0.014 (0.009) SongAirplayt-5 0.003 (0.011) 0.010 (0.009) SongAirplayt-6 0.007 (0.010) 0.007 (0.009) AlbumBuzzt-1 -0.007 (0.012) -0.005 (0.011) AlbumBuzzt-2 -0.009 (0.009) 0.005 (0.009) AlbumBuzzt-3 -0.012 (0.008) -0.017** (0.007) AlbumBuzzt-4 0.023*** (0.007) -0.005 (0.006) AlbumBuzzt-5 -0.001 (0.007) 0.014** (0.006) AlbumBuzzt-6 -0.001 (0.007) 0.012** (0.006) AlbumSalest-2 -0.128*** (0.019) -0.047* (0.025) AlbumSalest-3 -0.016 (0.013) -0.008 (0.015) AlbumSalest-4 0.035*** (0.013) -0.001 (0.012) AlbumSalest-5 -0.043*** (0.012) -0.019* (0.011) AlbumSalest-6 0.006 (0.009) -0.011 (0.007) Notes: Variables are as defined in Table 1 and are logged and forward mean-differenced. **, **, * denote significance at 1%, 5% and 10%, respectively. MIS Quarterly Vol. 38 No. 1/March 2014 117
  • 18. Dewan and Ramaprasad/Social Media, Traditional Media, and Music Sales Table 16. PVAR Regression Results (Robustness for the “Over-Hype” Effect) Song Sales Low Buzz: Sales High Buzz: Sales Low Airplay: Sales High Airplay: Sales Buzzt-1 -0.758* (0.040) 0.839 (0.736) -0.098** (0.043) 0.150*** (0.346) Buzzt-2 -0.692** (0.029) 0.382 (0.526) -0.086*** (0.031) 0.116 (0.257) Buzzt-3 -0.048** (0.021) -0.441 (0.568) -0.060*** (0.022) 0.045 (0.236) Buzzt-4 -0.038** (0.016) -0.661 (0.494) -0.047*** (0.018) 0.038 (0.163) Buzzt-5 -0.036** (0.017) -0.304 (0.504) -0.046** (0.018) 0.180 (0.125) Buzzt-6 -0.047*** (0.013) -0.594 (0.423) -0.055*** (0.015) 0.004 (0.120) Airplayt-2 0.074*** (0.019) 0.359 (0.416) 0.072*** (0.018) -0.053 (1.049) Airplayt-2 0.049*** (0.014) 0.132 (0.173) 0.048*** (0.013) -0.121 (0.462) Airplayt-3 -0.008 (0.012) -0.012 (0.179) -0.009 (0.012) 0.489 (0.702) Airplayt-4 -0.009 (0.011) -0.015 (0.249) -0.008 (0.010) 0.071 (0.517) Airplayt-5 -0.000 (0.010) 0.162 (0.167) 0.003 (0.010) -0.334 (0.568) Airplayt-6 0.0001 (0.009) 0.101 (0.176) 0.000 (0.009) 0.304 (0.391) Notes: Variables are as defined in Table 1 and are logged and forward mean-differenced. **, **, * denote significance at 1%, 5% and 10%, respectively. Finally, we conduct a robustness check on the number of lags included in the PVAR specification. The AIC criterion indi- cated that six or seven lags might be best, although the difference in the AIC magnitudes was small. We decided to include six lags for the sake of parsimony. Table 17 shows the main results when seven lags of all variables are included and, as can be, seen the qualitative nature of the results is unchanged. Discussion and Conclusions Our analysis of the dynamic relationships between social media, traditional media, and sales found interesting differ- ences at the song and album level and within different music subsamples. We find that at the song level, the impact of radio play on sales is positive and declines rapidly over time, and the impact of song buzz is negative and becomes more negative over time. By contrast, at the album level, both radio play and buzz have a moderate and consistent positive relationship with sales. This analysis suggests that the impact of social media, and the buzz therein, is different at the song level and at the album level, and for mainstream versus niche music. As mentioned earlier, it is important to note that our results reflect short-term dynamics between buzz and sales, and they do not rule out the possibility of positive impacts of song/album buzz on sales in the long term. A potential explanation for the contrasting effects of buzz on album versus song sales highlights the dual role of social media as a platform for sharing not just information and opinions about music, but for sharing the music itself—which has not been addressed in prior research. A shock in blog buzz is typically accompanied by a contemporaneous shock in the supply of free, shareable music in the form of streaming mp3 links. Indeed, in a majority of blog posts at the song level, we find that the bloggers provide a mechanism for users to sample the music via streaming. As a result, any potential positive effects of blog buzz on song sales appears to be swamped by the negative effect of free sampling on sales. Interestingly, we find this net negative result at the song level and not at the album level. This might be due to the fact that with the trend in unbundling of albums, this media sharing happens largely at the song level, not at the album level. In addition, it is also possible that individuals who consume albums are different from those who consume songs in their propensity to sample versus purchase music. Anecdotal evi- dence suggests that those who consume albums are most likely to purchase physical albums (Nielsen 2012), while those interested in songs are digital consumers, who are more likely to sample music online. 118 MIS Quarterly Vol. 38 No. 1/March 2014
  • 19. Dewan and Ramaprasad/Social Media, Traditional Media, and Music Sales Table 17. PVAR Regression Results (Seven Lags) Dependent Variable Song Sales Album Sales Salest-1 0.520*** (0.032) 0.700*** (0.044) Salest-2 0.066*** (0.012) -0.010 (0.031) Salest-3 0.031*** (0.009) -0.004 (0.017) Salest-4 0.007 (0.008) -0.011 (0.013) Salest-5 -0.013 (0.009) -0.010 0.012) Salest-6 -0.002 (0.008) -0.005 (0.011) Salest-7 -0.038*** (0.010) -0.017** (0.009) Buzzt-1 -0.136*** (0.050) 0.001 (0.011) Buzzt-2 -0.115*** (0.036) 0.003 (0.009) Buzzt-3 -0.092*** (0.028) -0.011 (0.008) Buzzt-4 -0.059*** (0.020 -0.005 (0.007) Buzzt-5 -0.047*** (0.017) 0.007 (0.007) Buzzt-6 -0.063*** (0.016) 0.009 (0.007) Buzzt-7 -0.006 (0.010) 0.002 (0.006) Airplayt-1 0.067*** (0.021) 0.089** (0.031) Airplayt-2 0.044*** (0.014) 0.028 (0.021) Airplayt-3 -0.010 (0.013) -0.021 (0.016) Airplayt-4 -0.010 (0.011) 0.006 (0.014) Airplayt-5 0.010 (0.011) 0.003 (0.011) Airplayt-6 0.009 (0.010) -0.001 (0.066) Airplayt-7 0.004 (0.010) 0.003 (0.011) Our analysis has a number of implications for both research and practice. The evidence of bidirectional causality calls for caution when analyzing buzz and sales data. Unless proper models are used to explicitly allow for two-way causal effects, estimates of the impact of buzz on sales might be biased and therefore misleading. With respect to the impact of buzz on sales, our results highlight the multifaceted role of social media in the music context. These media are used to share information about music items—but also to share the music itself. Any positive effects of the first type of sharing might be cancelled and reversed by the negative effects of the second type of sharing (i.e., the music itself) on sales. There- fore, a study of the word-of-mouth effects of social media must also account for the use of this media for sharing digital goods. From a practical standpoint, our findings suggest that buzz marketing campaigns might have different results when targeted at the album versus song level. Further the design of the campaigns must account for the confounding effects of word-of-mouth social influence versus the sharing of music. It is clear that the results we found here are unlikely if music were not an information good. The digitization of products has made them more accessible to consumers, through both legitimate and illegitimate means. The online music land- MIS Quarterly Vol. 38 No. 1/March 2014 119
  • 20. Dewan and Ramaprasad/Social Media, Traditional Media, and Music Sales scape is continually growing, with a large variety of sites available to stream and download music, including sites such as Last.fm and Spotify. As individuals begin to have access to music through such sites, which enable consumption with- out purchase, the relationship between sampling and sales becomes even more important. Our results demonstrate that creating awareness of such goods, through online venues such as social media, may not have a direct, positive effect on sales; in fact, it may lead people to access the good for free. While this may be concerning for those operating and seeking to make money from digital goods, it is important to note that this ability to consume the good for free (i.e., sample it) may provide incentive for consumers to purchase complementary products. The insights that are generated from our analysis are applicable to other information goods, where sampling and sales are both viable mechanisms for consumption. Thus our overall framework and insights are applicable to software, print, and film, although the distinction between an albumand single songs may not be relevant in these contexts. This study does have some limitations. We have data on only one type of social media—blog posts—and not Facebook, MySpace, and other media. Also, we have data on only volume of word-of-mouth, not valence. However, we believe this is not very limiting in the music blog context, due to the fact that almost all music blog posts implicitly represent a positive opinion so that there is no variation in valence here. Another issue with the measurement of buzz is that it just counts album and song mentions, which combines word-of- mouth effects with media sharing effects. Thus, we are only able to observe the net impact of the two factors; it may be interesting for future research to separately measure the two effects, so their individual contributions can be distinguished from one another. Another limitation is that our research design includes just one traditional media, namely radio play. However, Peitz and Waelbroeck (2004) note that radio play is the single most important traditional channel through which users discover music. Overcoming these limitations can provide fruitful directions for further research. Overall, this study sheds new light on the impact of new versus traditional media on music album and song sales, and the results have implications for the design of both academic studies and buzz marketing campaigns in practice. Acknowledgments The order of authors is alphabetical and they contributed equally. The authors thank Debbie Schwartz at Nielsen SoundScan for facilitating the access to essential data for this project. They also thank the editorial team and seminar participants at the University of Minnesota, New York University, Hong Kong University of Science and Technology, Beijing University, and SCECR 2011 for their helpful comments and suggestions. References Abel, F., Diaz-Aviles, E., Henze, N., Krause, D. and Siehndel, P. 2010. “Analyzing the Blogosphere for Predicting the Success of Music and Movie Products,” in Proceedings of the 2010 Inter- national Conference on Advances in Social Networks Analysis and Mining, Odense, Denmark, August 9-11. Adomavicius, G., Bockstedt, J., and Gupta, A. 2012. “Modeling Supply-Side Dynamics of IT Components, Products, and Infrastructure: An Empirical Analysis Using Vector Auto- regression,” Information Systems Research (23:2), pp. 397- 417. Arellano, M., and Bover, O. 1995. “Another Look at the Instru- mental Variable Estimation of Error Component Models,” Journal of Econometrics (68:1), pp. 29-51. Chellappa, R., and Chen, C. 2009. “MySpace Killed the Radio Star? The Impact of Online Sampling on Song Sales,” in Proceedings of the 13th International Conference on Information Systems, Phoenix, AZ, December 15-18. Chen, H., De, P., and Hu Yu. 2011. “IT-Enabled Broadcasting in Social Media: An Empirical Study of Artists’ Activities and Music Sales,” paper presented at the Workshop on Information Systems and Economics, Shanghai, China. Chen, Y., Wang, Q., and Xie, J. 2010. “Online Social Interactions: A Natural Experiment on Word of Mouth Versus Observational Learning,” Working Paper, University of Arizona. Chevalier, J. A., and Mayzlin, D. 2006. “The Effect of Word of Mouth on Sales: Online Book Reviews,” Journal of Marketing Research (43:3), pp. 345-354. Chintagunta, P. K., Gopinath, S., and Venkataraman, S. 2010. “The Effects of Online User Reviews on Movie Box Office Perfor- mance: Accounting for Sequential Rollout and Aggregation Across Local Markets,” Marketing Science (29:5), pp. 944-957. Dekimpe, M. G., and Hanssens, D. M. 1995. “The Persistence of Marketing Effects on Sales,” Marketing Science (14:1), pp. 1-21. Dellarocas, C., Awad, N., and Zhang, X. 2007. “Exploring the Value of Online Product Reviews in Forecasting Sales: The Case of Motion Pictures,” Journal of Interactive Marketing (21:4), pp. 23-45. Dewan, S., and Hsu, V. 2004. “Adverse Selection in Electronic Markets: Evidence from Online Stamp Auctions,” Journal of Industrial Economics (LII:4), pp. 497-516. Dewan, S., and Ramaprasad, J. 2008. “Chicken and Egg? Interplay Between Music Blog Buzz and Album Sales,” paper presented at Workshop on Information Systems Economics, Paris, France. Dewan, S., and Ramaprasad, J. 2012. “Music Blogging, Online Sampling, and the Long Tail,” Information Systems Research (23:3), pp. 1056-1067. Dhar, V., and Chang, E. A. 2009. “Does Chatter Matter? The Impact of User-Generated Content on Music Sales,” Journal of Interactive Marketing (23), pp. 300-307. Duan, W., Gu, B., and Whinston, A. B. 2008. “The Dynamics of Online Word of Mouth and Product Sales—An Empirical Investigation of the Movie Industry,” Decision Support Systems (84:2), pp. 233-242. 120 MIS Quarterly Vol. 38 No. 1/March 2014
  • 21. Dewan and Ramaprasad/Social Media, Traditional Media, and Music Sales Ehlrich, B. 2011. “What Would the Music Industry Look Like if Napster Never Existed?,” Mashable.com, April 8 (http://mashable.com/2011/04/08/napster-never-existed/). Forman, C., Ghose, A., and Weisenfeld, B. 2008. “Examining the Relationship Between Reviews and Sales: The Role of Reviewer Identity Disclosure in Electronic Markets,” Information Systems Research (19:3), pp. 291-313. Ghose, A., and Ipeirotis, P. G. 2011. “Estimating the Helpfulness and Economic Impact of Product Reviews: Mining Text and ReviewerCharacteristics,”IEEETransactionsonKnowledgeand Data Engineering (23:10), pp. 1498-1512. Godes, D., and Mayzlin, D. 2004. “Using Online Conversations to Study Word of Mouth Communication,” Marketing Science (23:4), pp. 545-560. Harris, R. D. F., and Tzavalis, E. 1999. “Inference for Unit Roots in Dynamic Panels Where the Time Dimension is Fixed” Journal of Econometrics (91:2), pp. 201-226. Holtz-Eakin, D., Newey, W., and Rosen, H. S. 1988. “Estimating Vector Autoregressions with Panel Data,” Econometrica (56:6), pp. 1371-1395. King, M. F., and Balasubramanian, S. K. 1994. “The Effects of Expertise, End Goal, and Product Type on Adoption of Prefer- ence Formation Strategy,” Journal of the Academy of Marketing Science (22:2), pp. 146-159. Liebowitz, S. 2004. “Will MP3 Downloads Annihilate the Record Industry? The Evidence so Far,” Advances in the Study of Entre- preneurship, Innovation and Economic Growth (15), pp. 229-260. Liu, Y. 2006. “Word of Mouth for Movies: It’s Dynamics and Impact on Box Office Revenues,” Journal of Marketing (70:7), pp. 74-89. Love, I., and Zicchino, L. 2006. “Financial Development and Dynamic Investment Behavior: EvidencefromPanelVAR,”The Quarterly Review of Economics and Finance (46:2), May, pp. 190-210. Moon, S, Bergey, P. K., and Iacobucci, D. 2010. “Dynamic Effects Among Movie Ratings, Movie Revenues, and Viewer Satis- faction” Journal of Marketing (74:1), pp. 108-121. Morales-Arroyo, M., and Pandey, T. 2010. “Identification of Critical eWOM Dimensions for Music Albums,” in Proceedings of the 5th IEEE International Conference on Management of Innovation and Technology, Singapore, June 2-5. Nielsen Company. 2012. “Nielsen Music 3600 ,” partial report available upon request and full report available upon license retrieval from The Nielsen Company. Onishi, H., and Manchanda, P. 2012. “Marketing Activity, Blogging and Sales,” International Journal of Research in Marketing, (29:3), pp. 221-234. Peitz, M., and Waelbroeck, P. 2004. “An Economist’s Guide to Digital Music,” CESifo Working Paper 1333, CESIfo Group Munich. Peitz, M., and Waelbroeck, P. 2006. “Why the Music Industry May Gain from Free Downloading—The Role of Sampling,” International Journal of Industrial Organization (24:5), pp. 907-913. Rob, R., and Waldfogel, J. 2006. “Piracy on the High C’s: Music Downloading, Sales Displacement, and Social Welfare in a Sample of CollegeStudents,” The Journal of Law and Economics (49:1), pp. 29-62. Rui, H., Liu, Y., and Whinston, A. B. 2011. “Whose and What Chatter Matters? The Impact of Tweets on Music Sales,” Working Paper No. 8, Zwick Center for Food and Resource Policy, University of Connecticut, Storrs, CT. Siwek, S. E. 2007. “The True Cost of Sound Recording Piracy to the U.S. Economy,” Policy Report 188, Institute for Policy Innovation, Lewisville, TX. Stanca, L., and Gallegati, M. 1999. “The Dynamic Relation Between Financial Positions and Investment: Evidence from Company Account Data,” Industrial and Corporate Change (8:3), pp. 551-572. Stephen, A. T., and Galak, J. 2012. “The Effects of Traditional and Social Earned Media on Sales: A Study of a Microlending Mar- ketplace,” Journal of Marketing Research (49:5), pp. 624-639. Trusov, M., Bucklin, R. E., and Pauwels, K. 2009. “Effects of Word-of-MouthVersusTraditionalMarketing: Findingsfroman Internet Social Networking Site,” Journal of Marketing (73:9), pp. 90-102. Villanueva, J., Yoo, S., and Hanssens, D. M. 2008. “The Impact of Marketing-Induced Versus Word-of-Mouth Consumer Acquisi- tion on Customer Equity Growth,” Journal of Marketing Research (45:1), pp. 48-59. Waldfogel, J. 2010. “Music File Sharing and Sales Displacement in the iTunes Era,” Information Economics and Policy (22:4), pp. 306-314. Zentner, A. 2006. “Piracy and File Sharing: Measuring the Effect of Music Downloads on Music Purchases,” The Journal of Law and Economics (49:1), pp. 63-90. About the Authors Sanjeev Dewan is a professor at the the Paul Merage School of Business, University of California, Irvine. Prior to joining UC Irvine in 2001, he served on the faculties of the business schools at the University of Washington, Seattle, and George Mason Univer- sity. He received his Ph.D. in Business Administration in 1991 from the Simon School at the University of Rochester, in the area of Information Systems. His current research interests are in the areas of the impact of online social media, business value of IT invest- ments, and electronic commerce. He has served as a senior editor at Information Systems Research and associate editor at Manage- ment Science. Jui Ramaprasad is currently an assistant professor at the Desautels Faculty of Management at McGill University. She received her doctorate in information systems from the Paul Merage School of Business at the University of California, Irvine, and holds a B.S. from the University of Southern California. Her main research interests lie in the impacts of online social media, the music industry, and electronic markets. She cochaired the 2012 Statistical Challenges in eCommerce Research (SCECR) conference held at McGill University in Montreal, Canada, and has served on a number of other conference program committees. MIS Quarterly Vol. 38 No. 1/March 2014 121
  • 22. 122 MIS Quarterly Vol. 38 No. 1/March 2014