Download to read offline
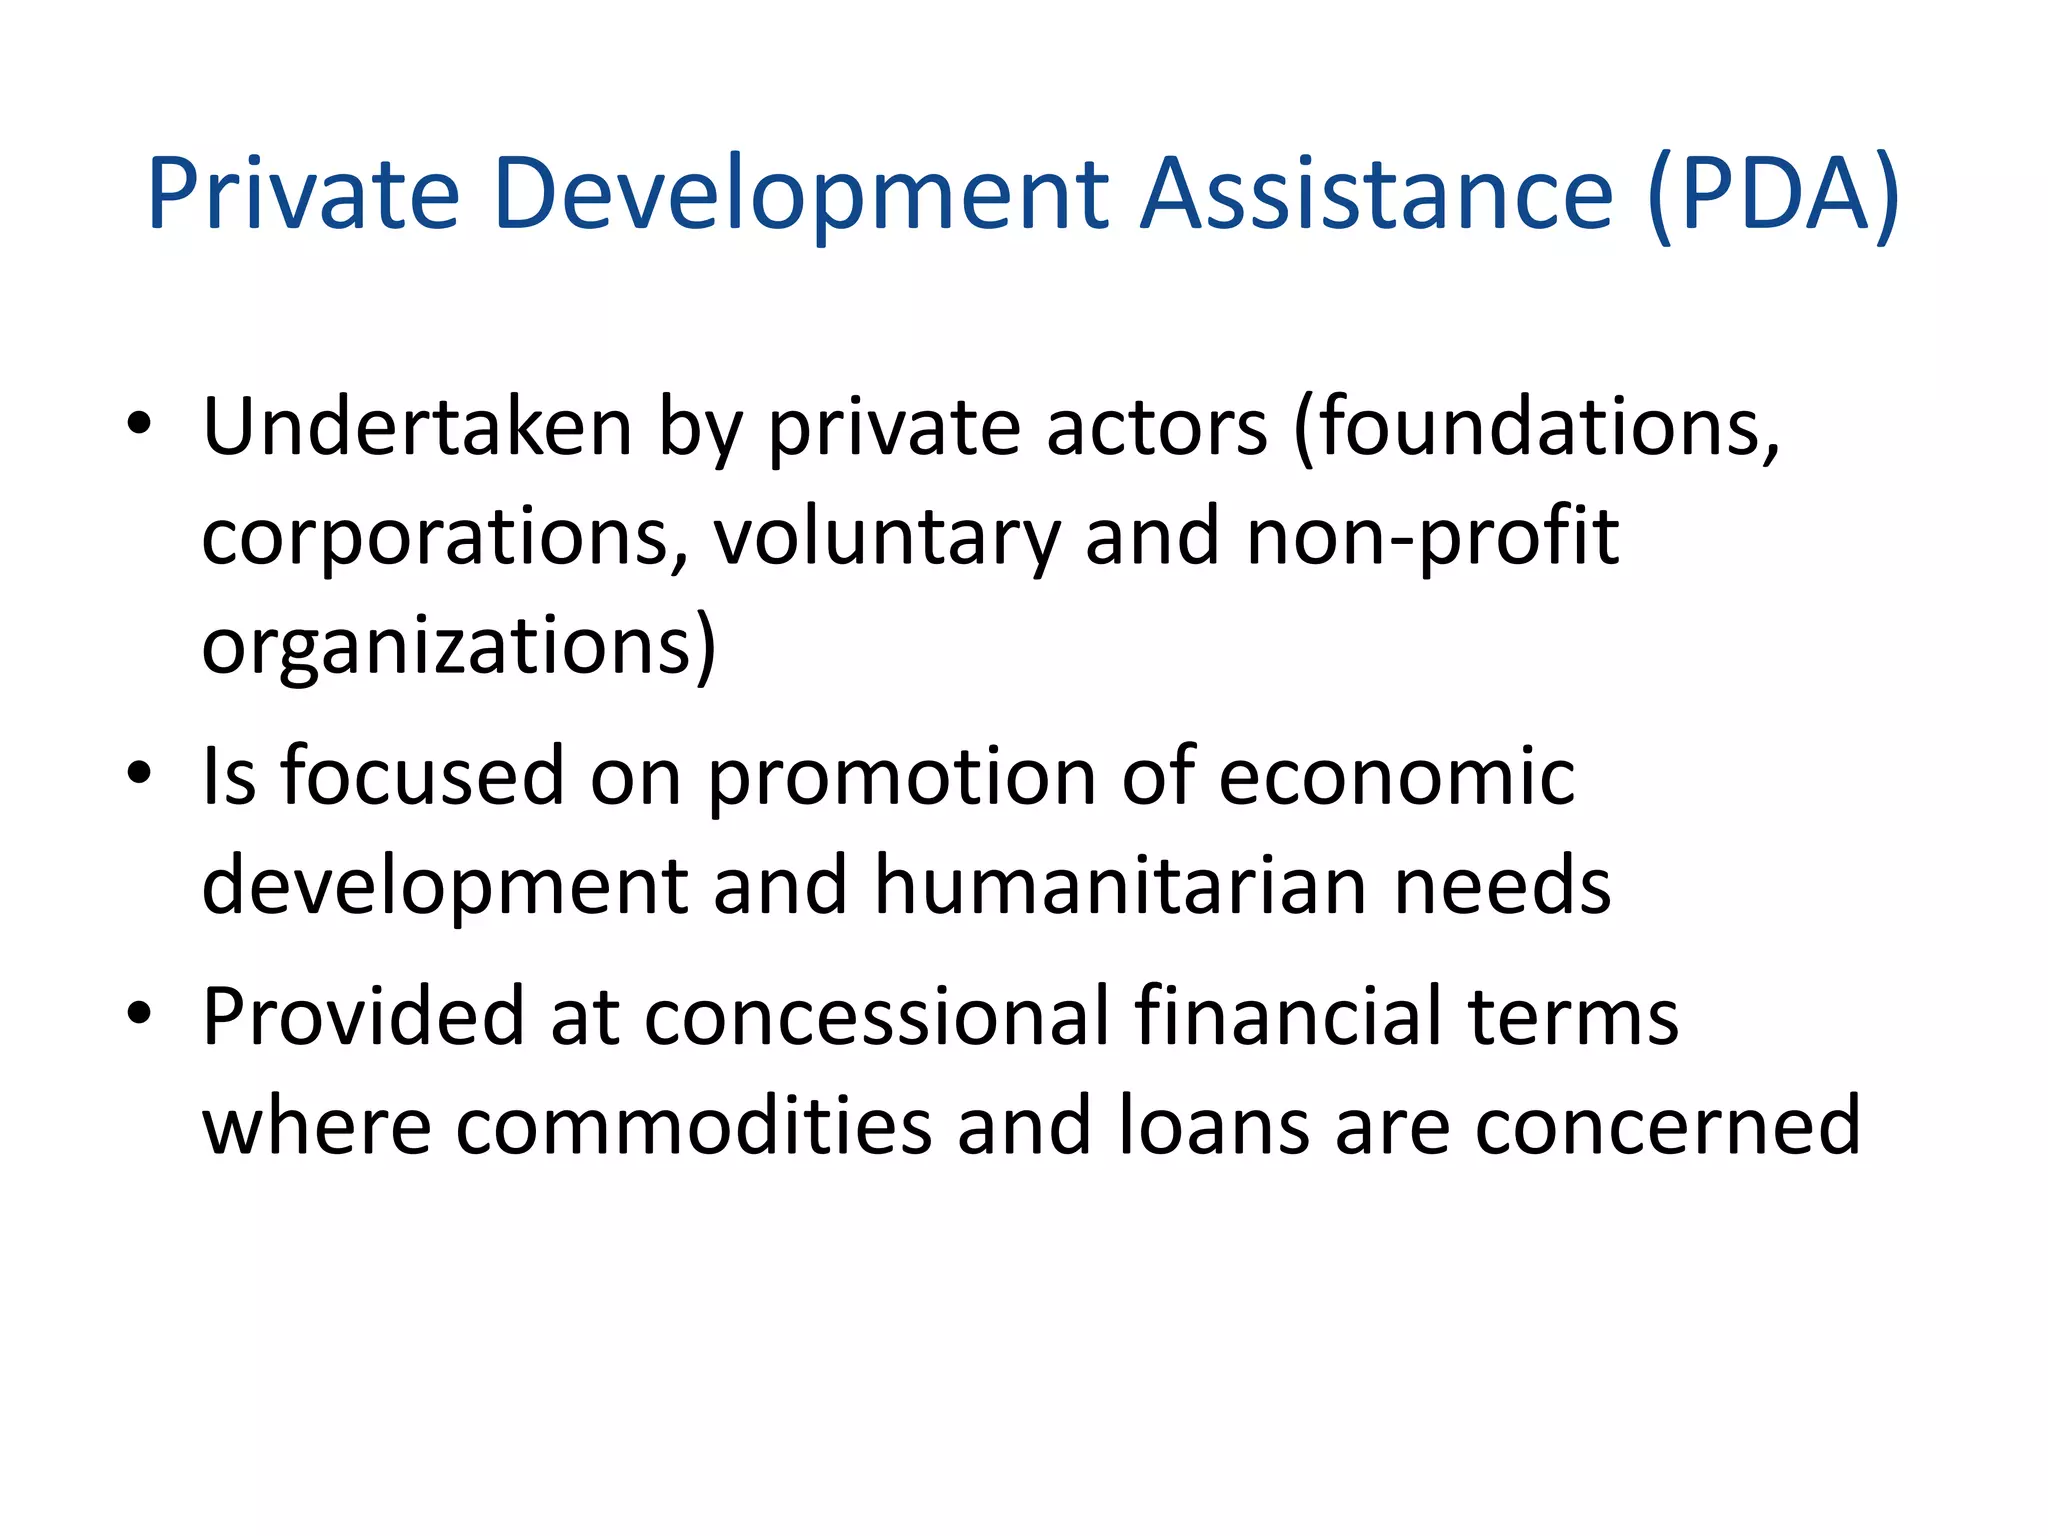
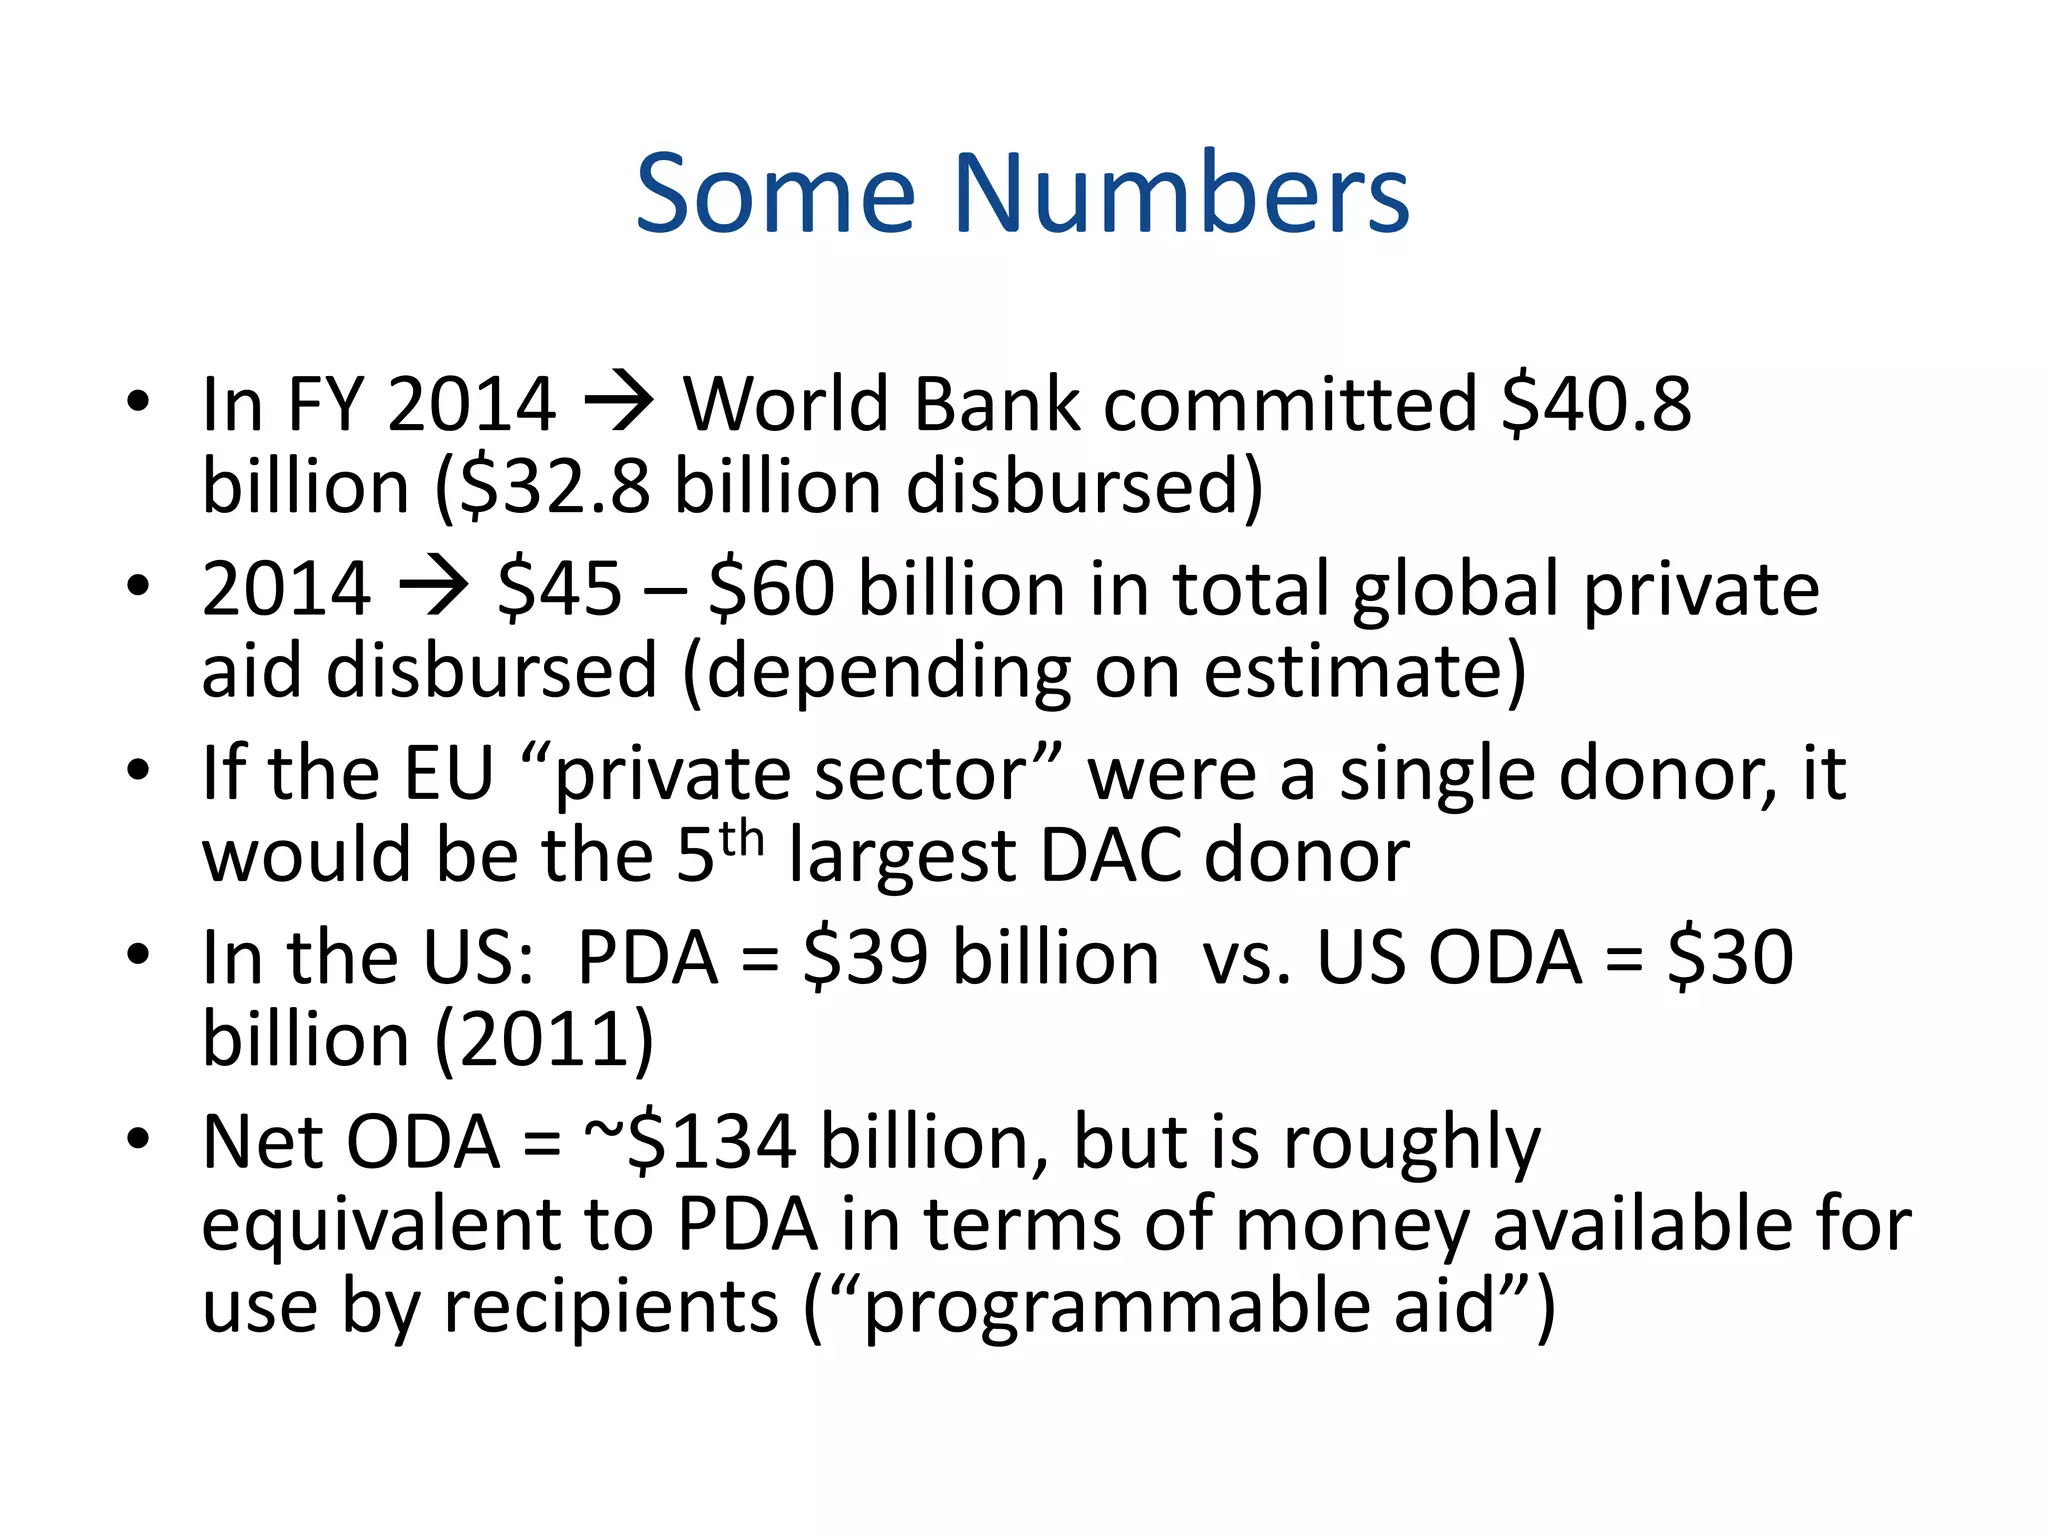
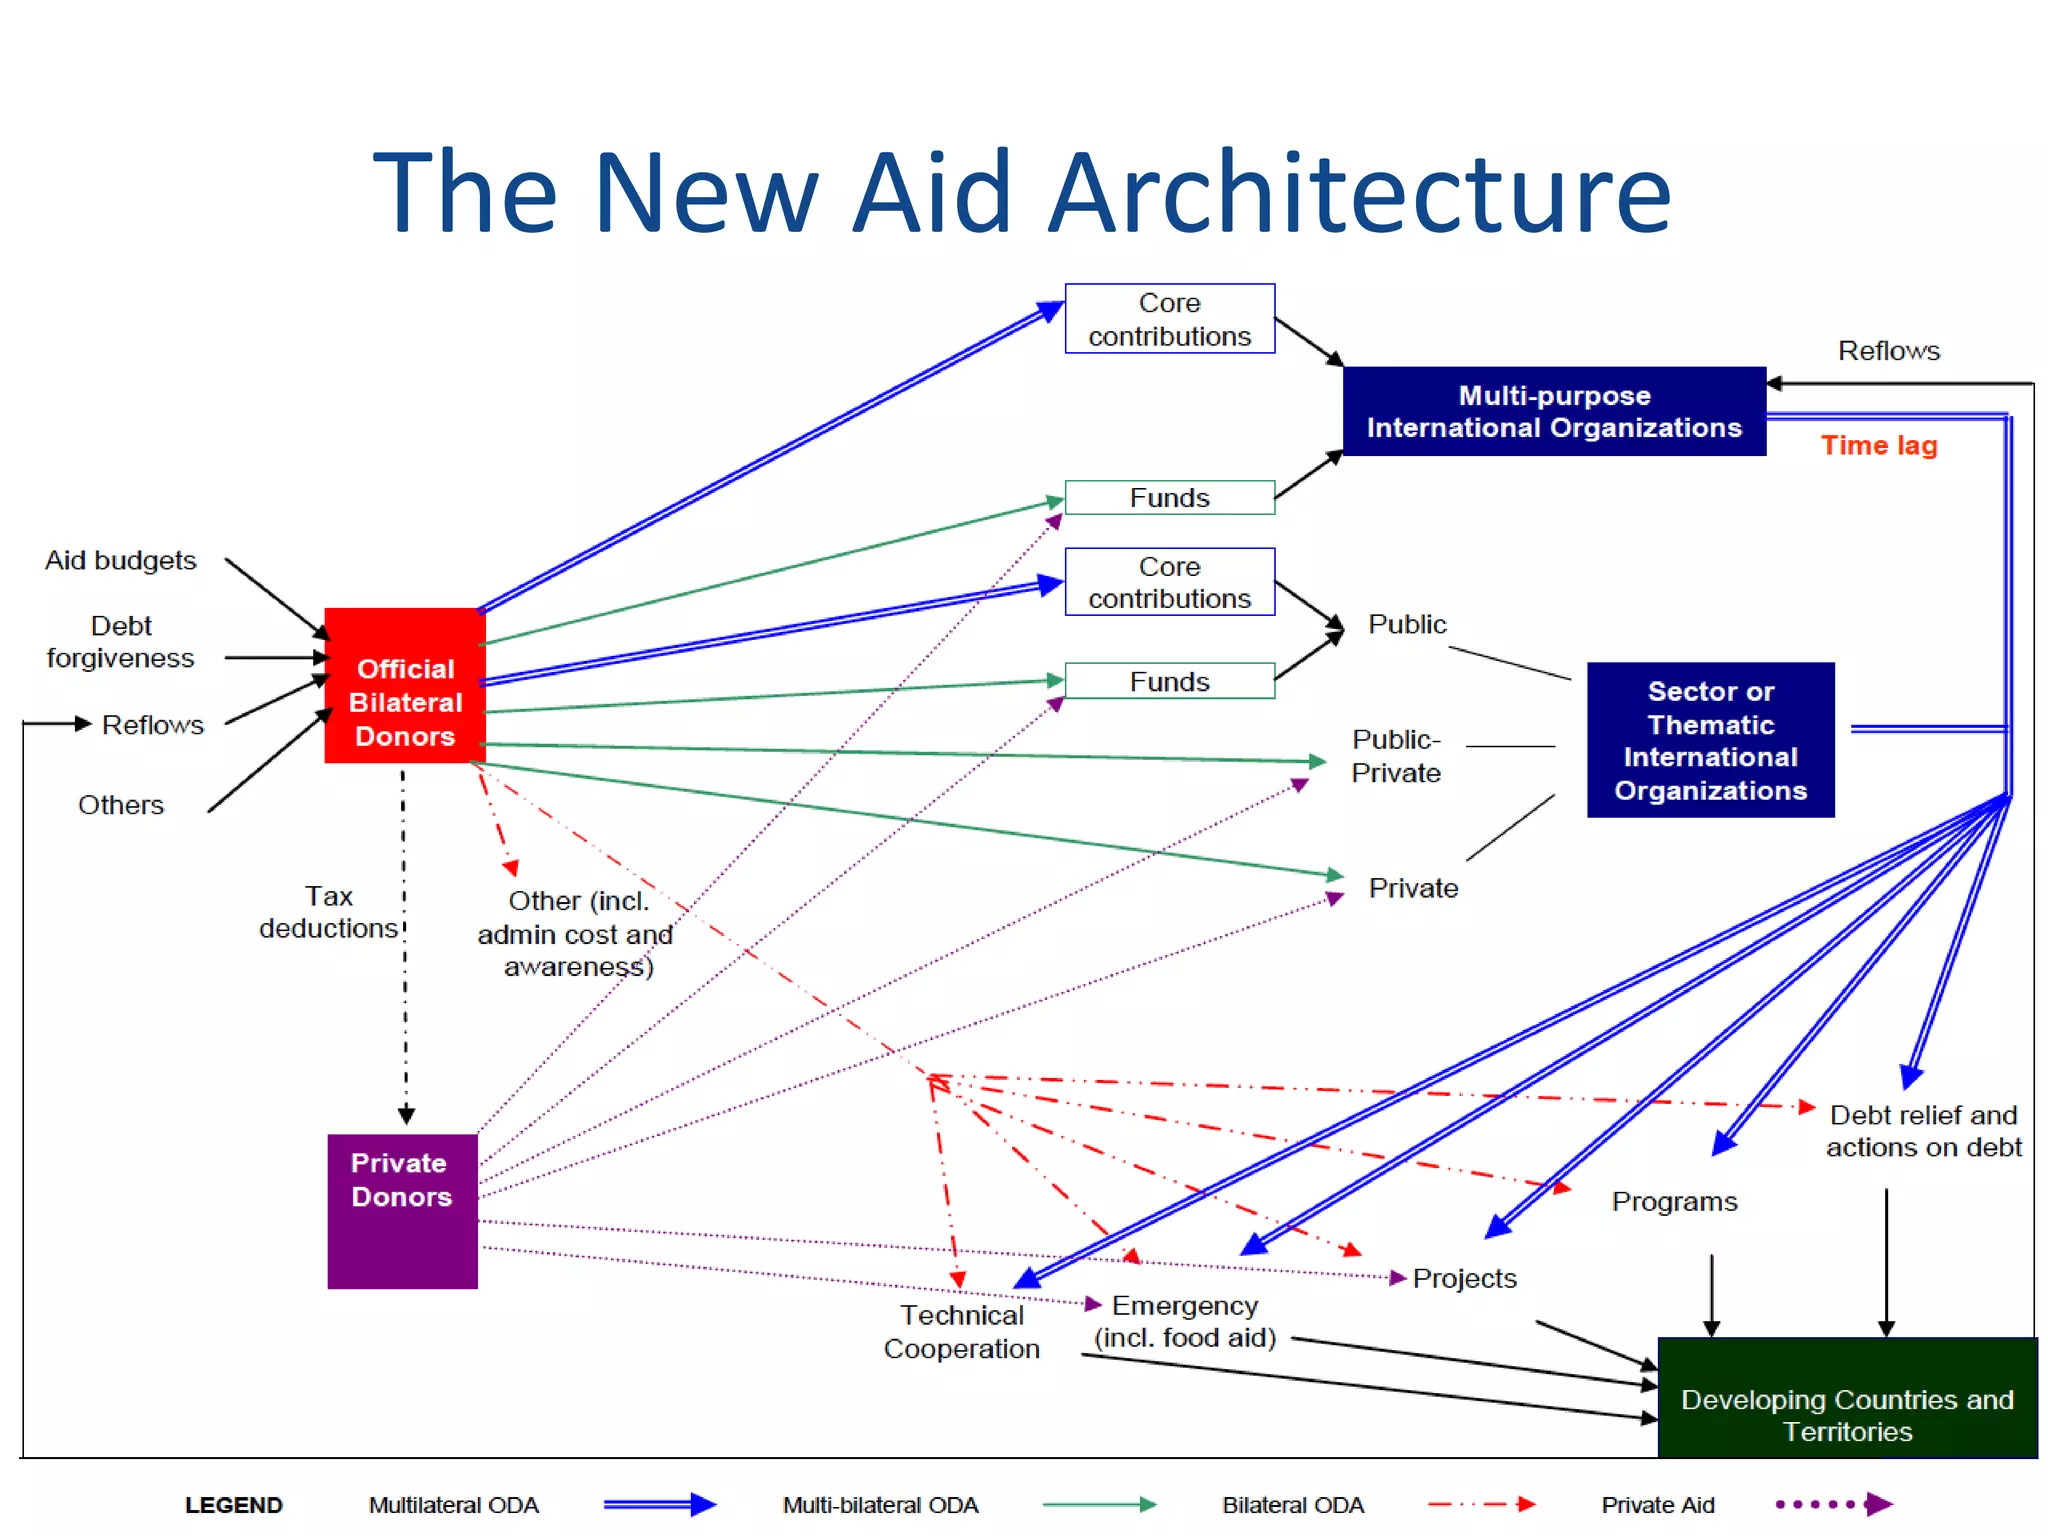
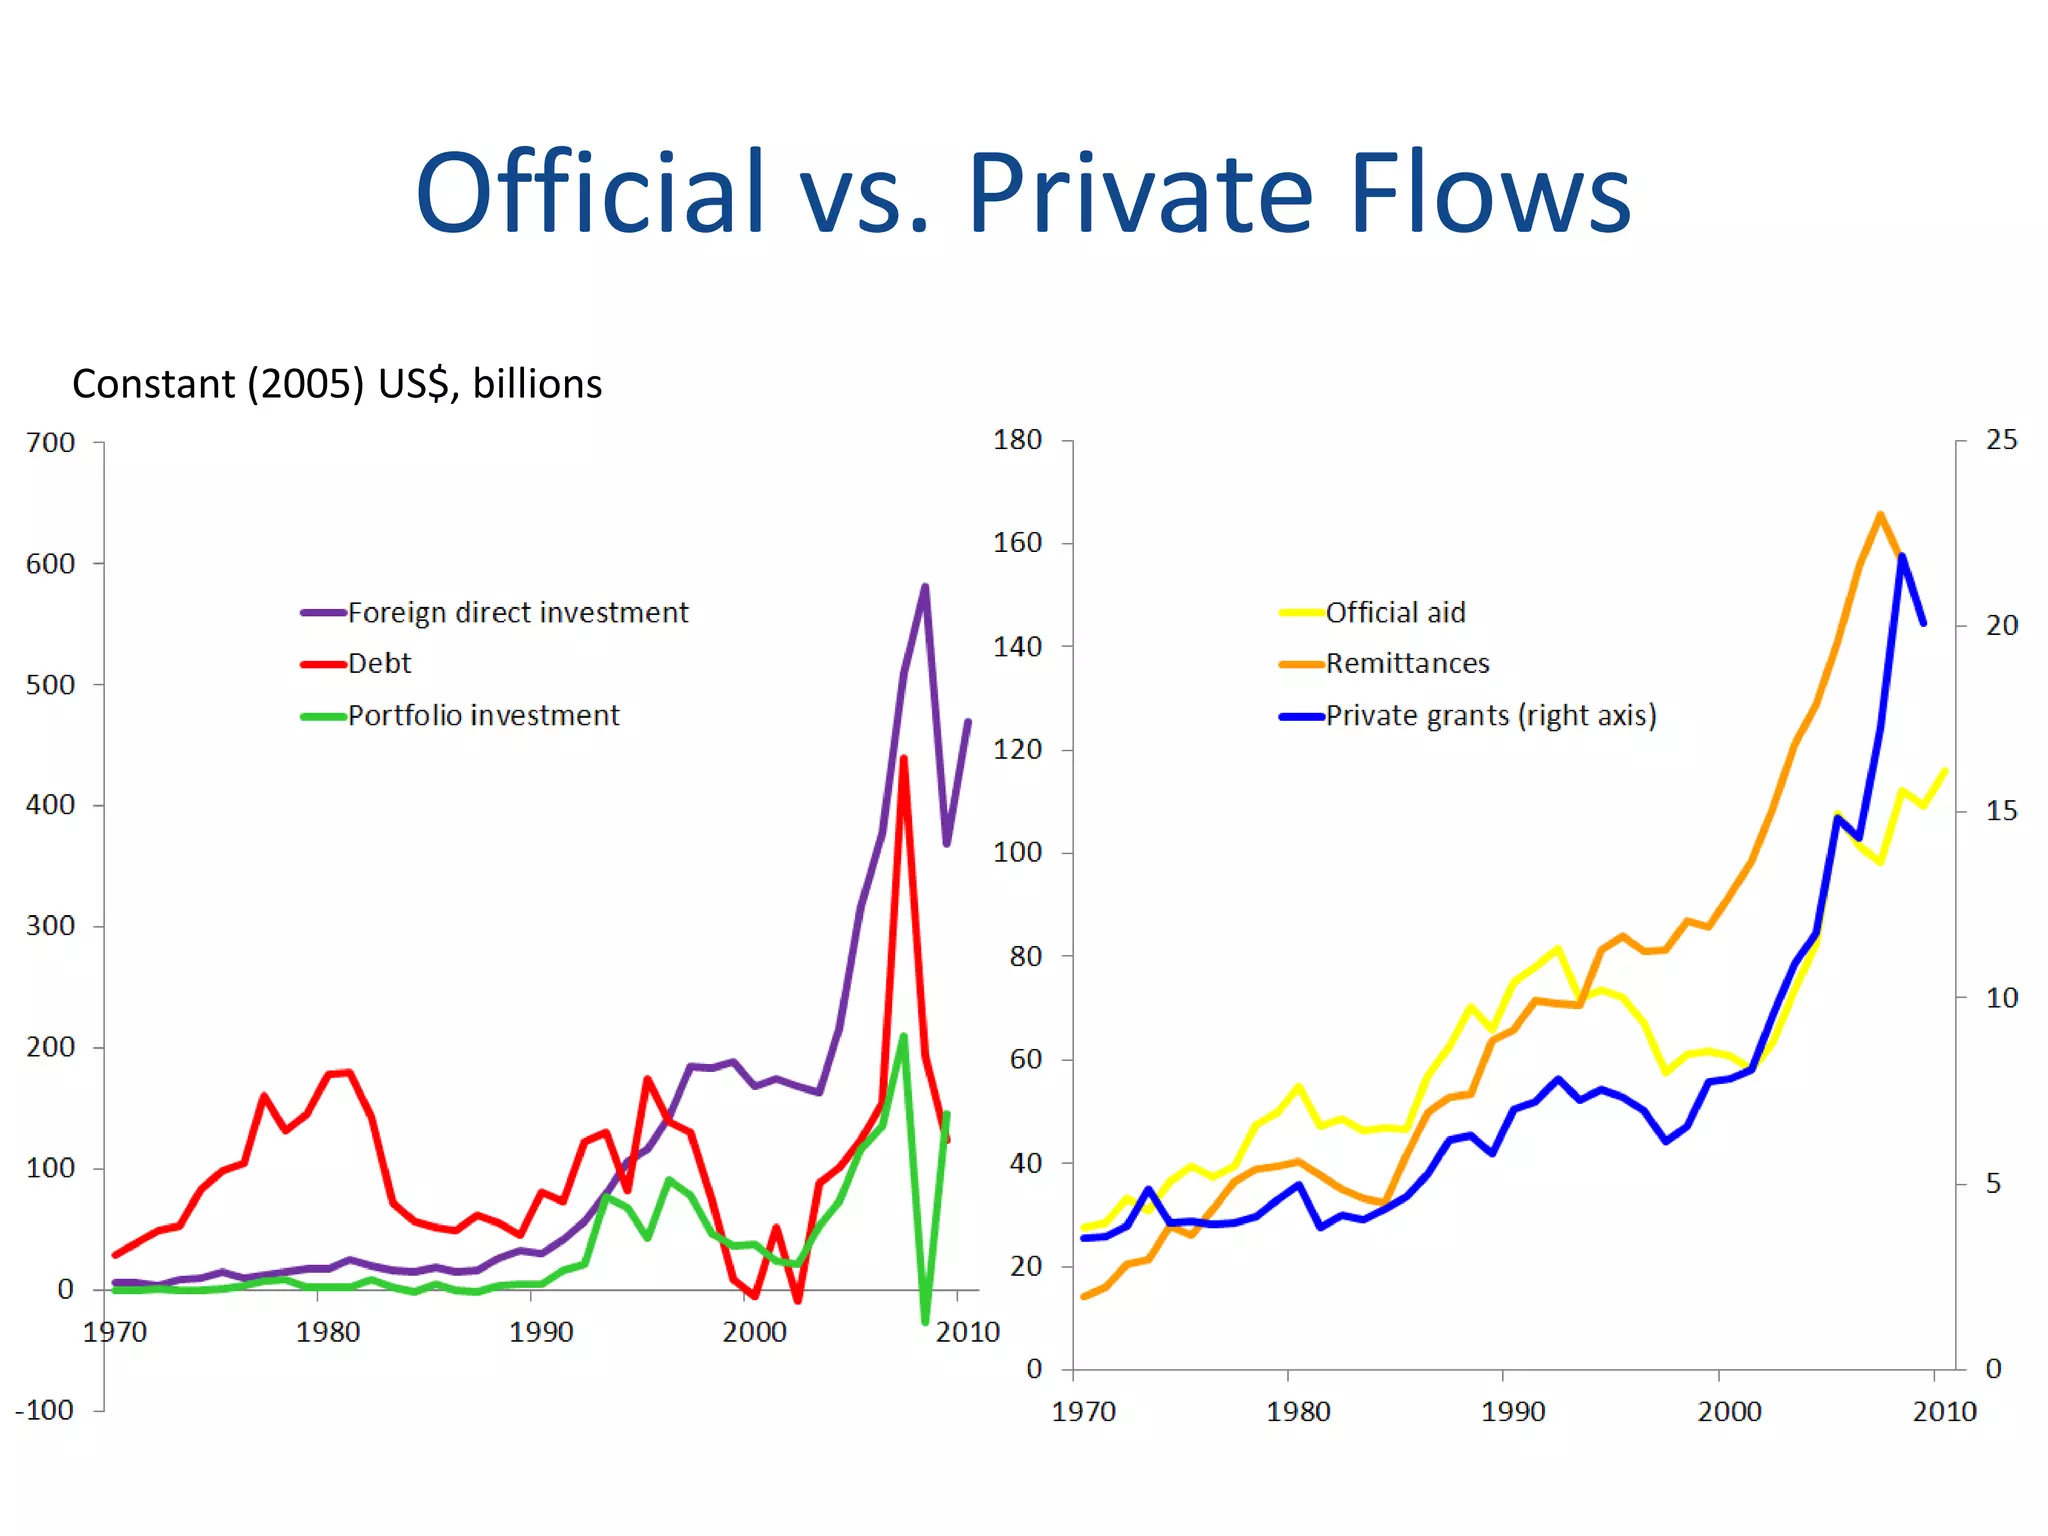
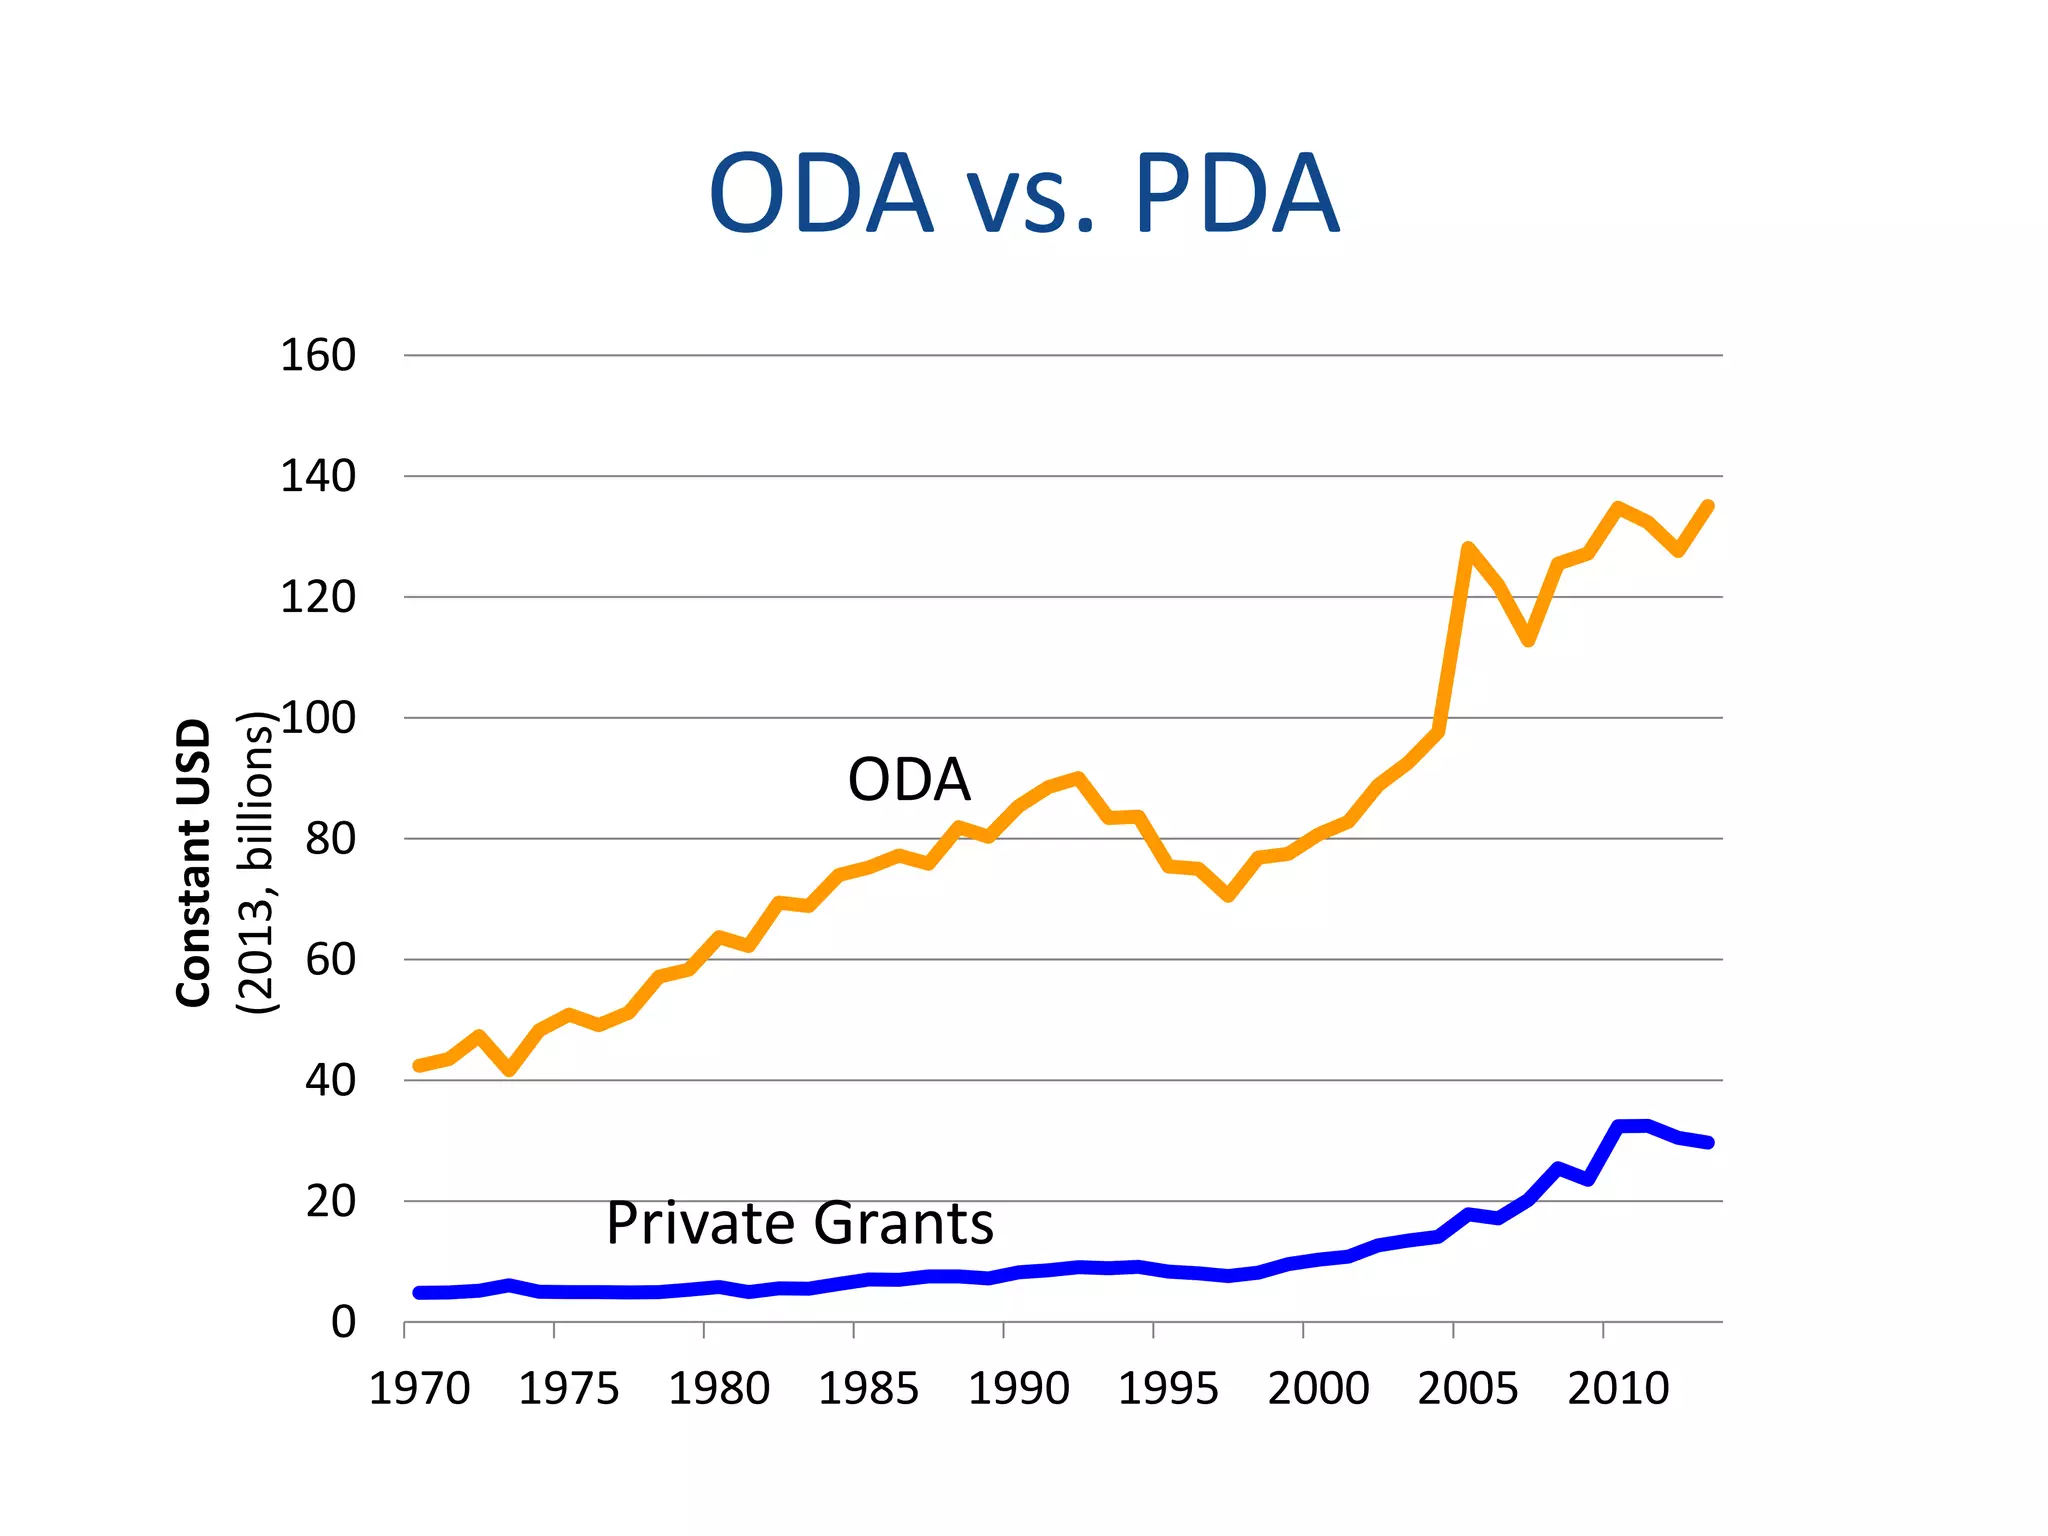
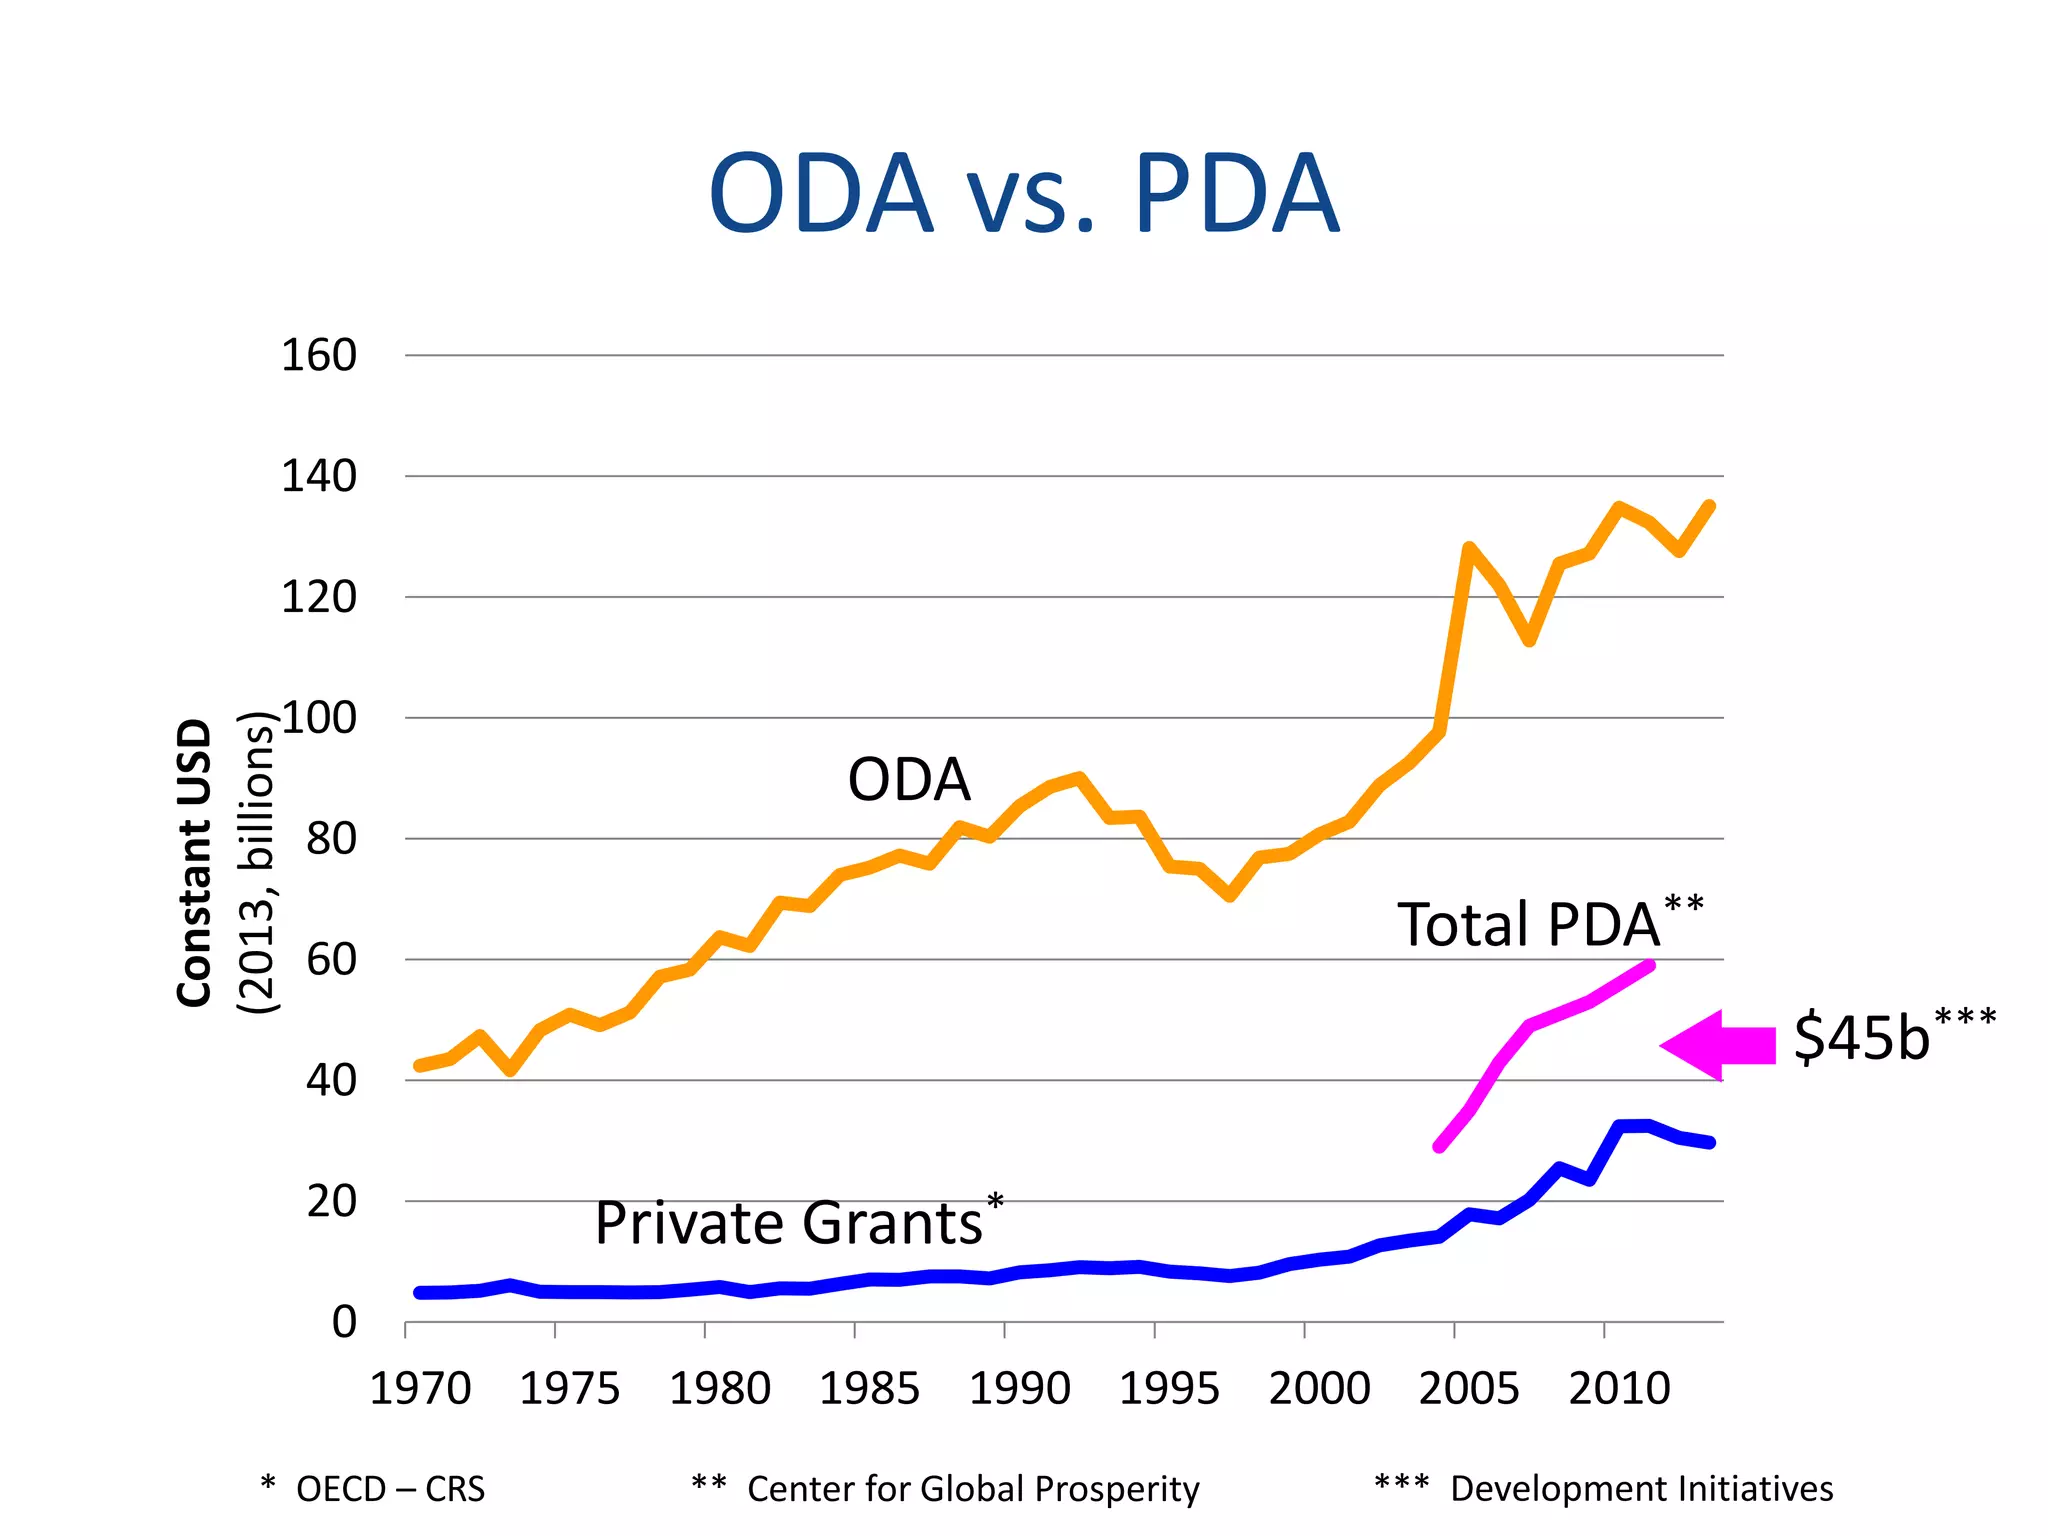
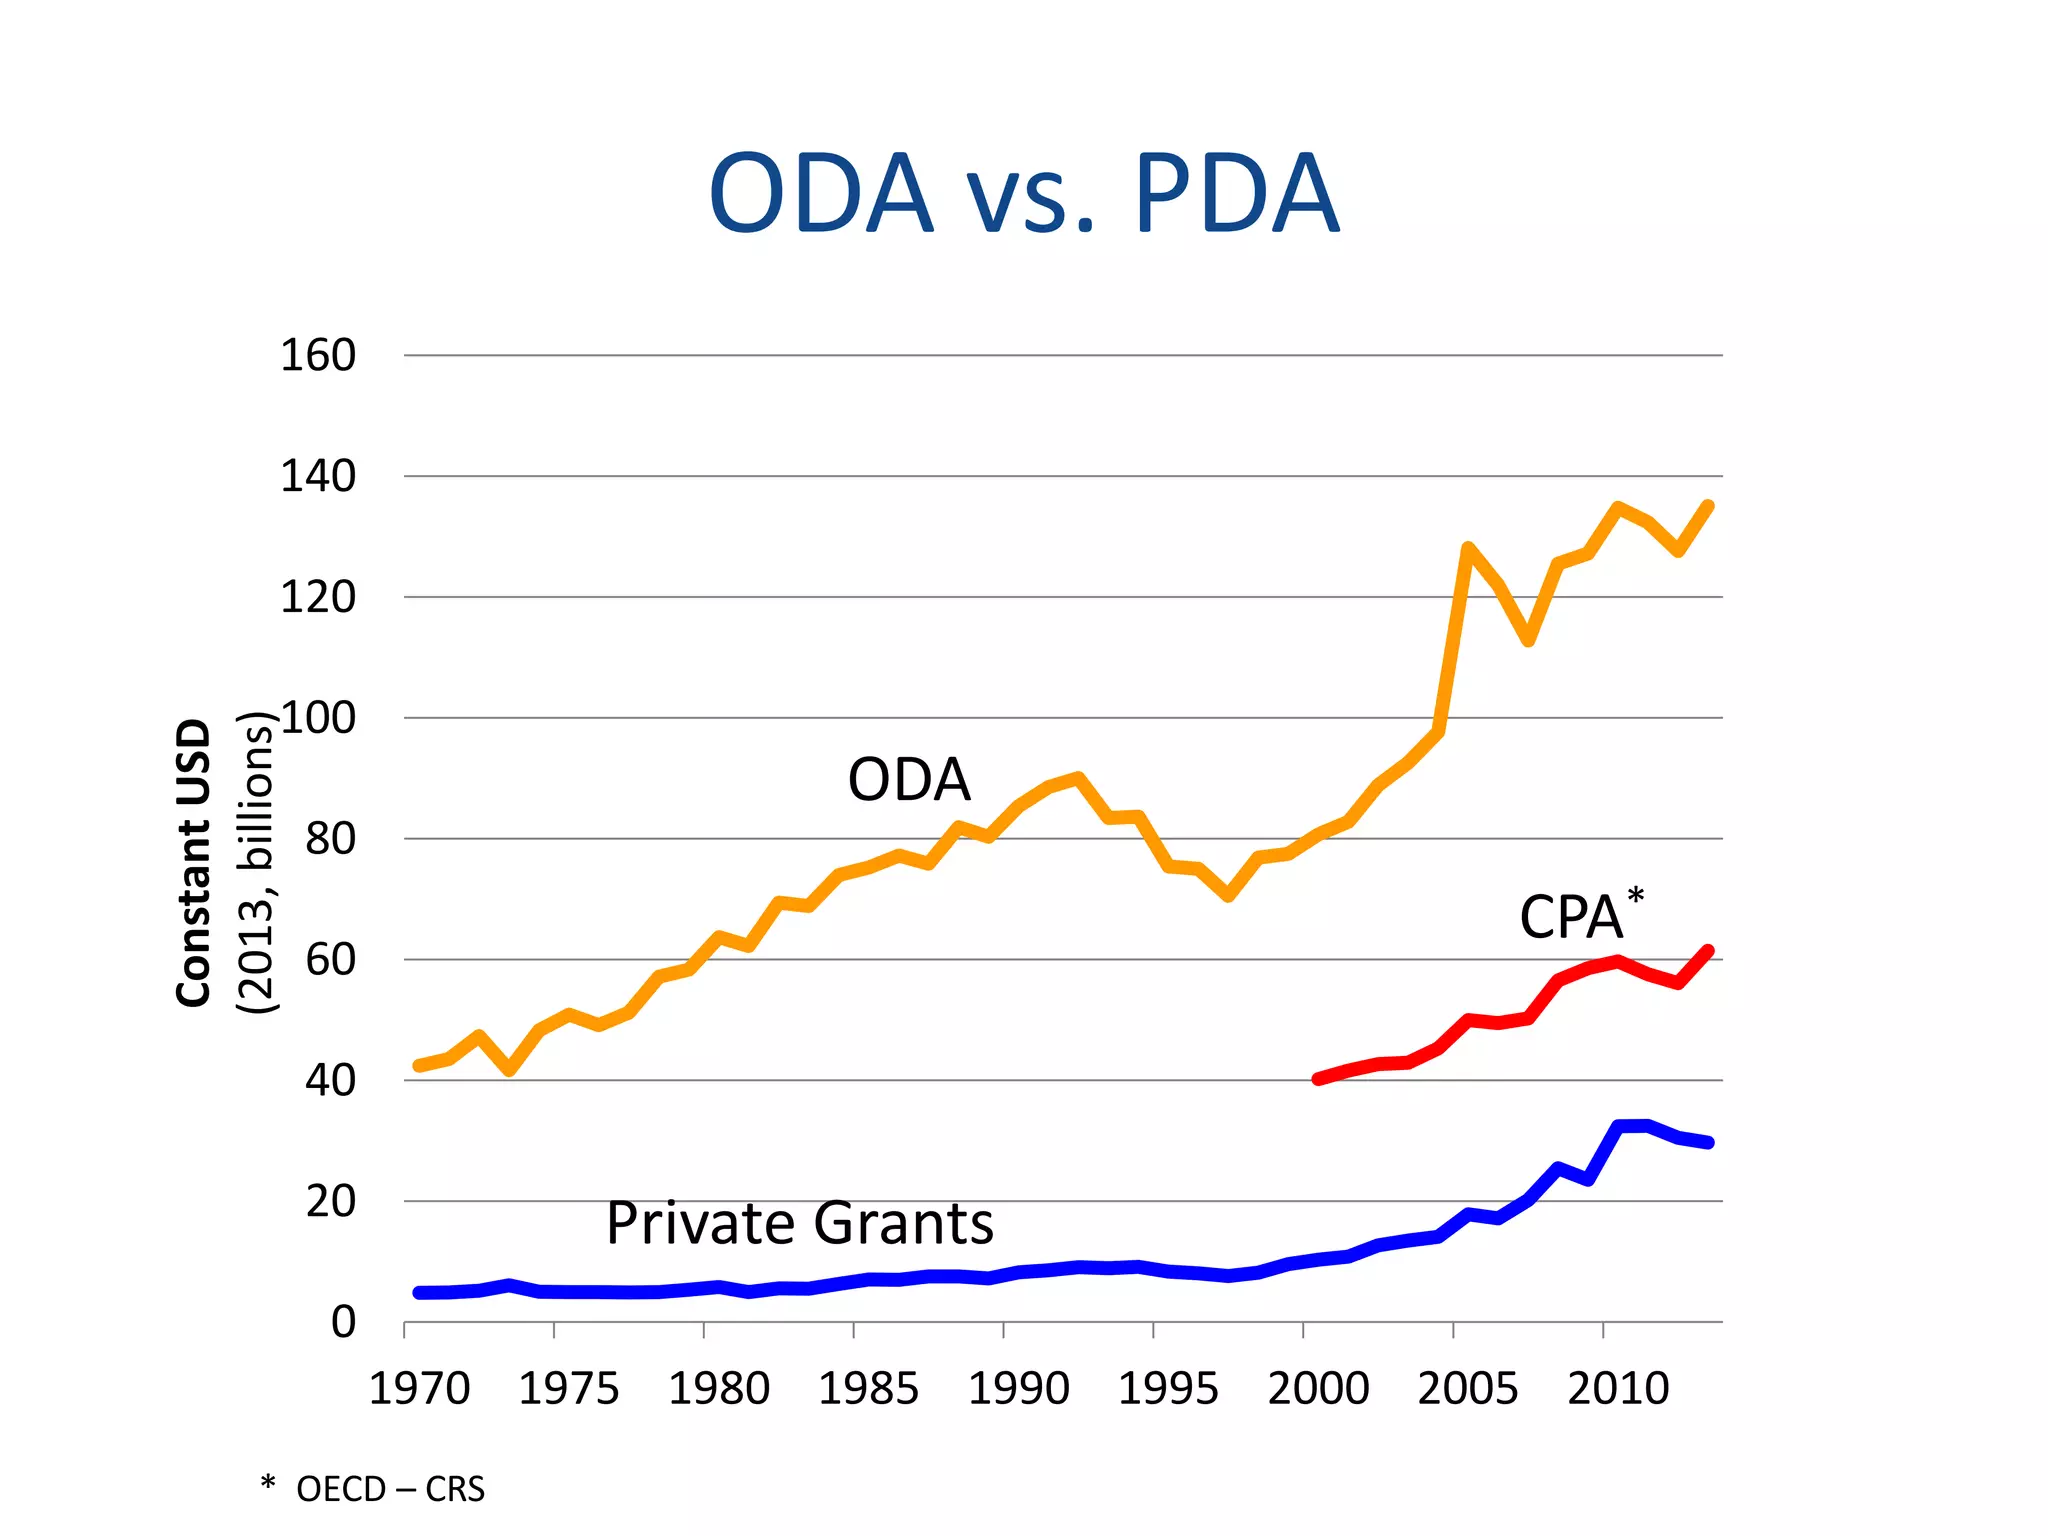
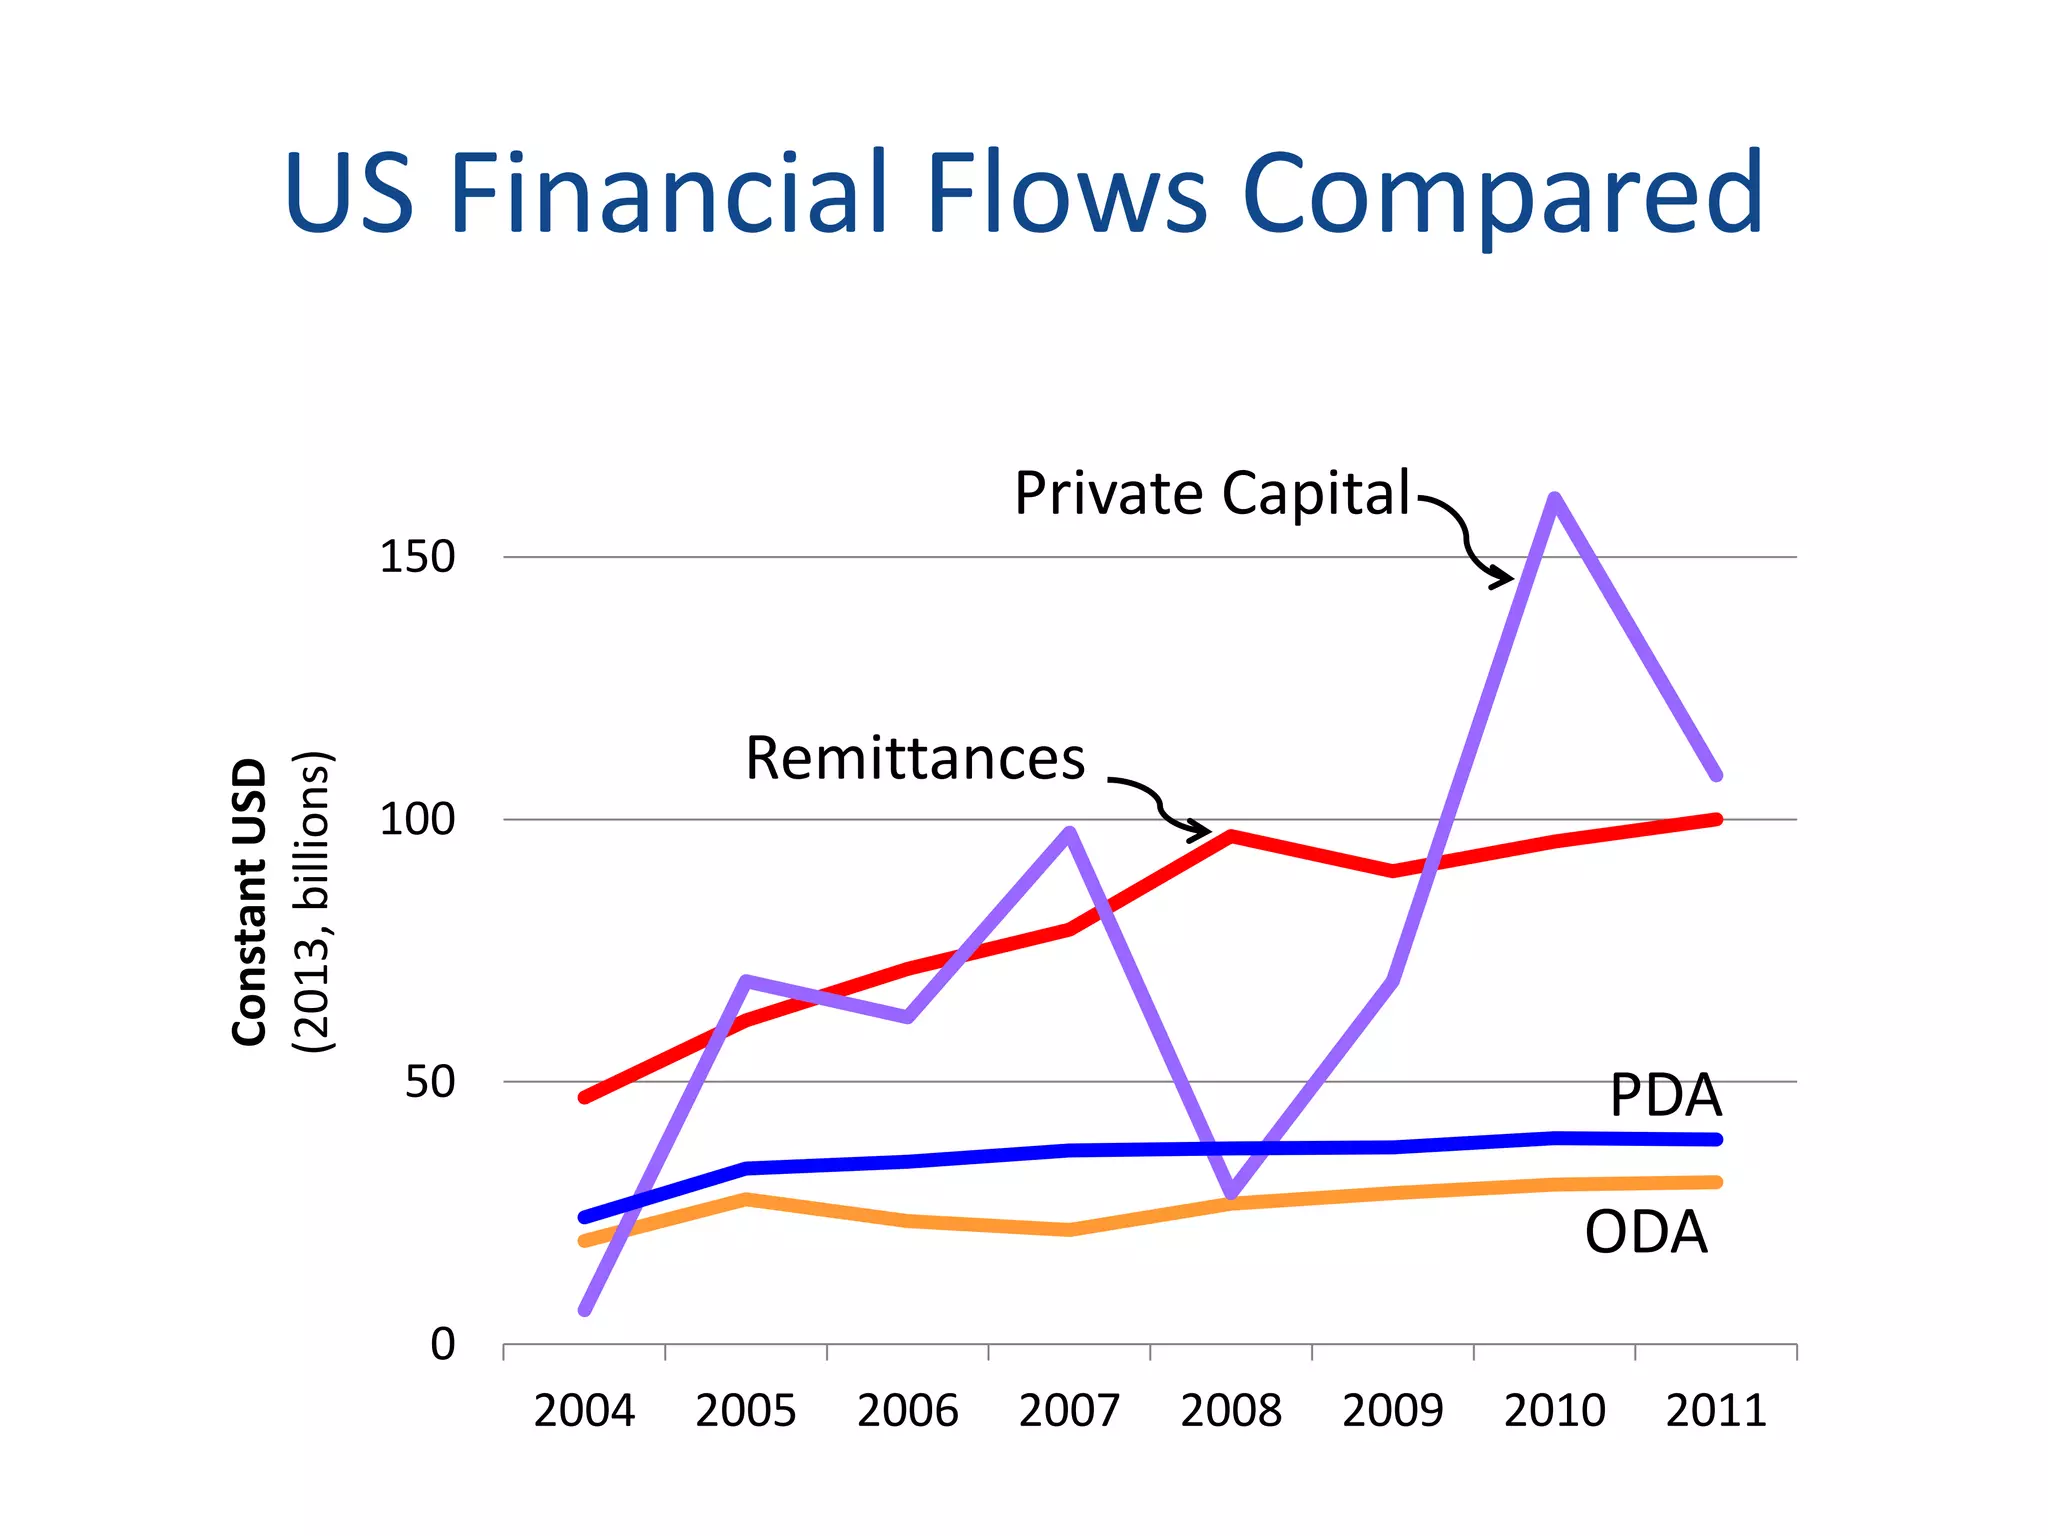
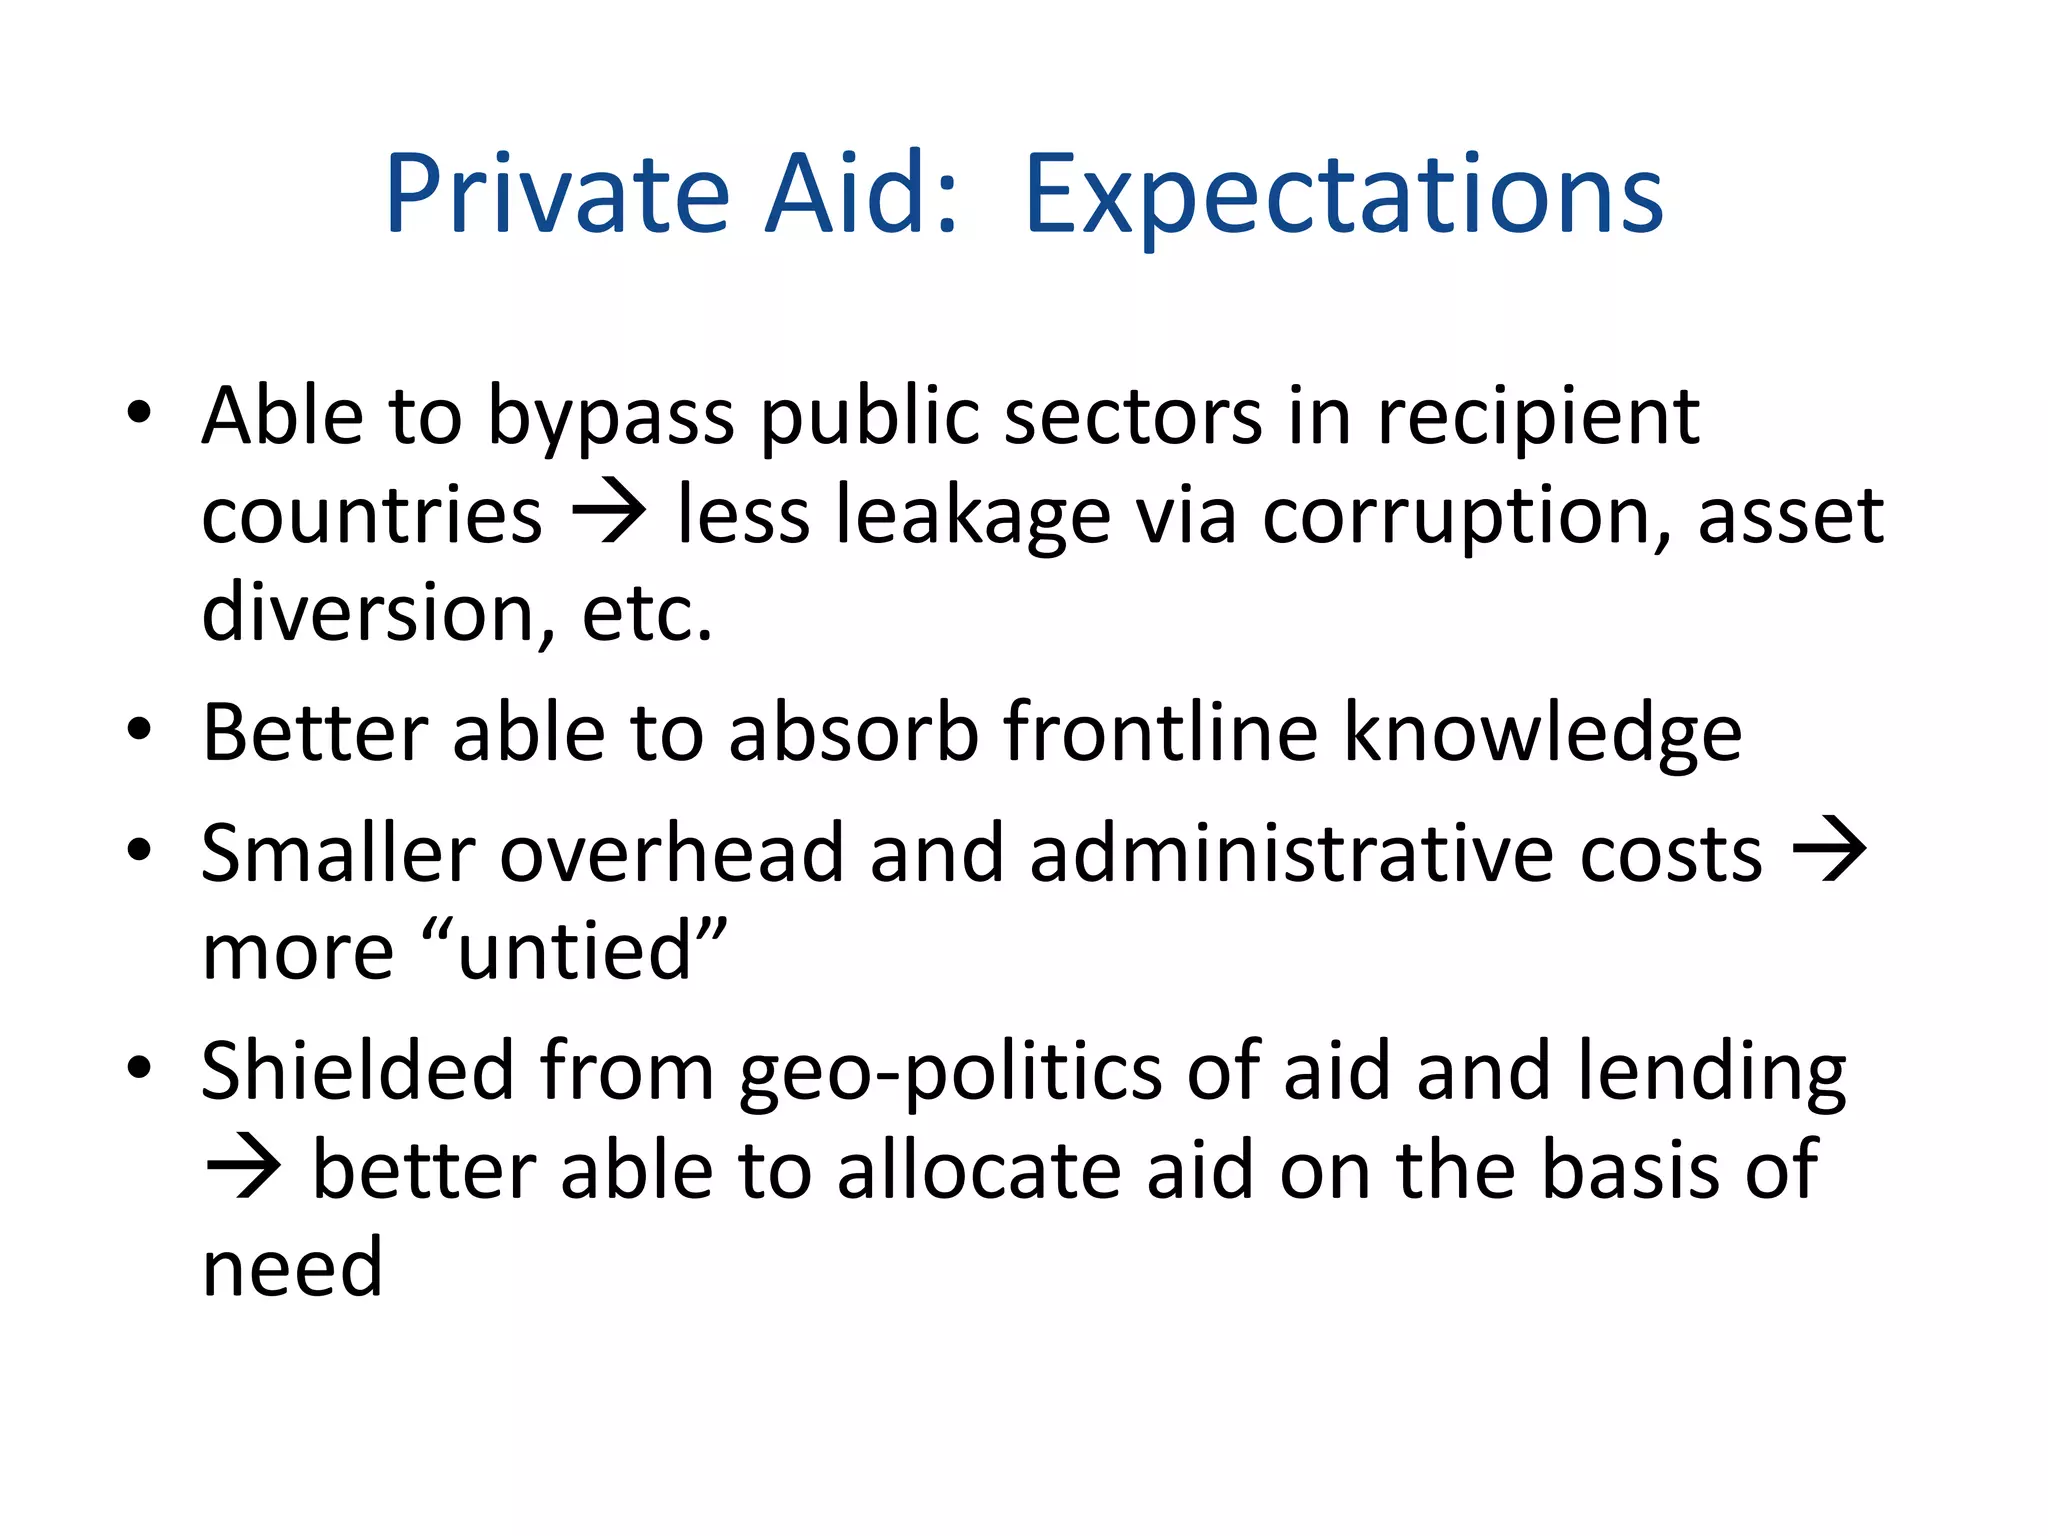
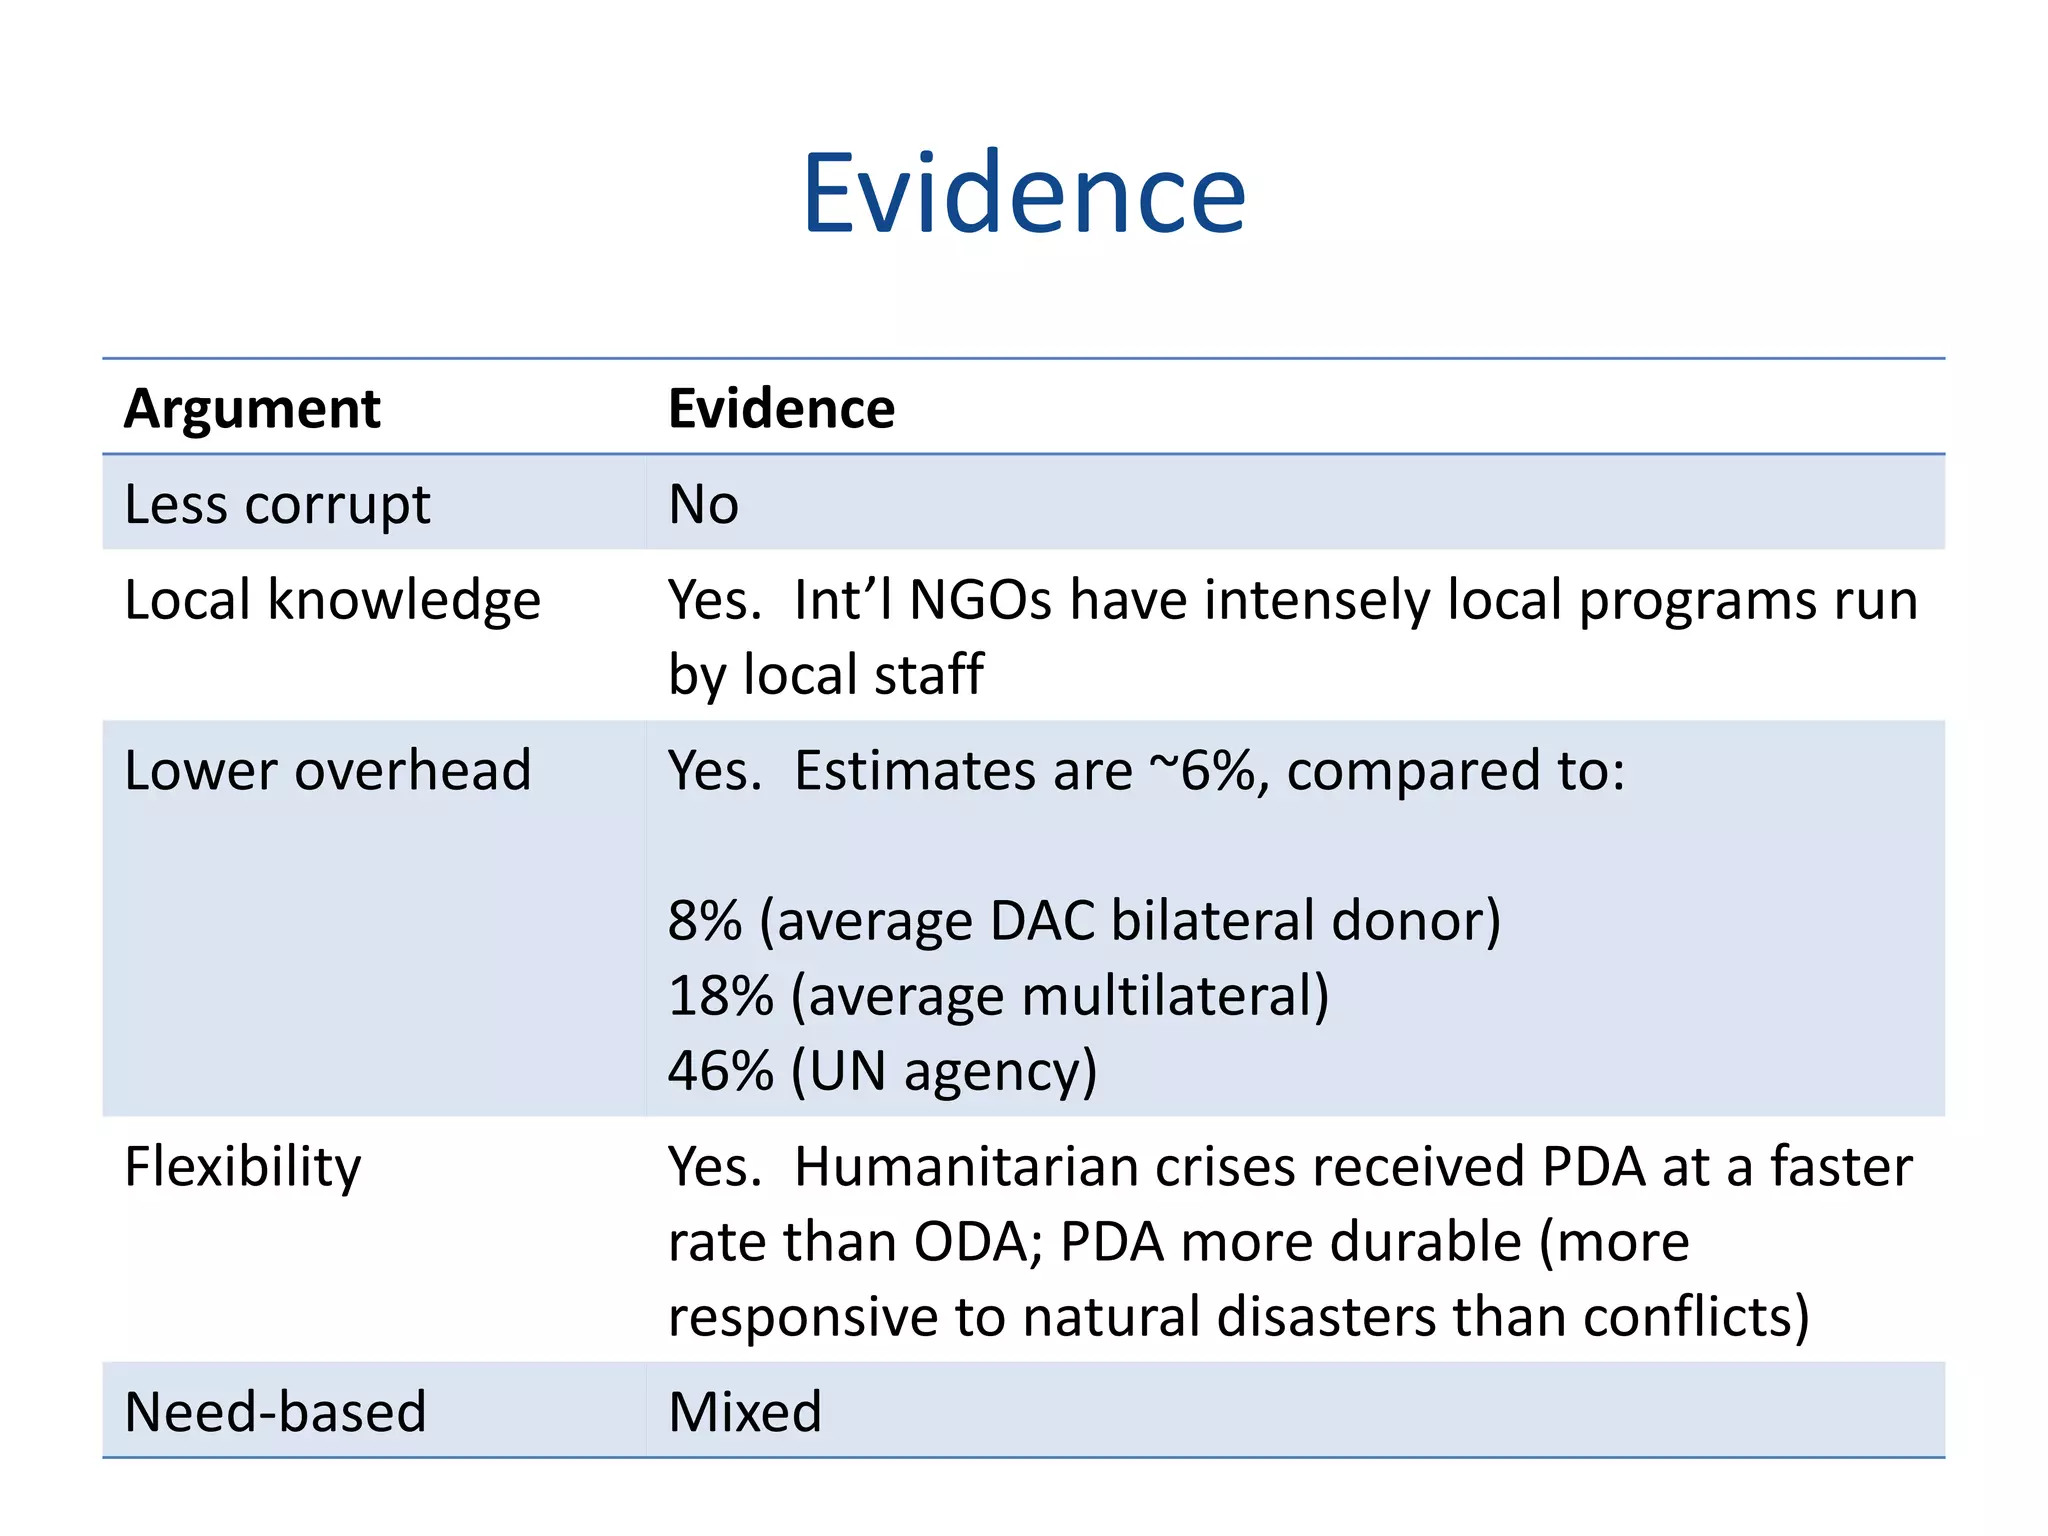
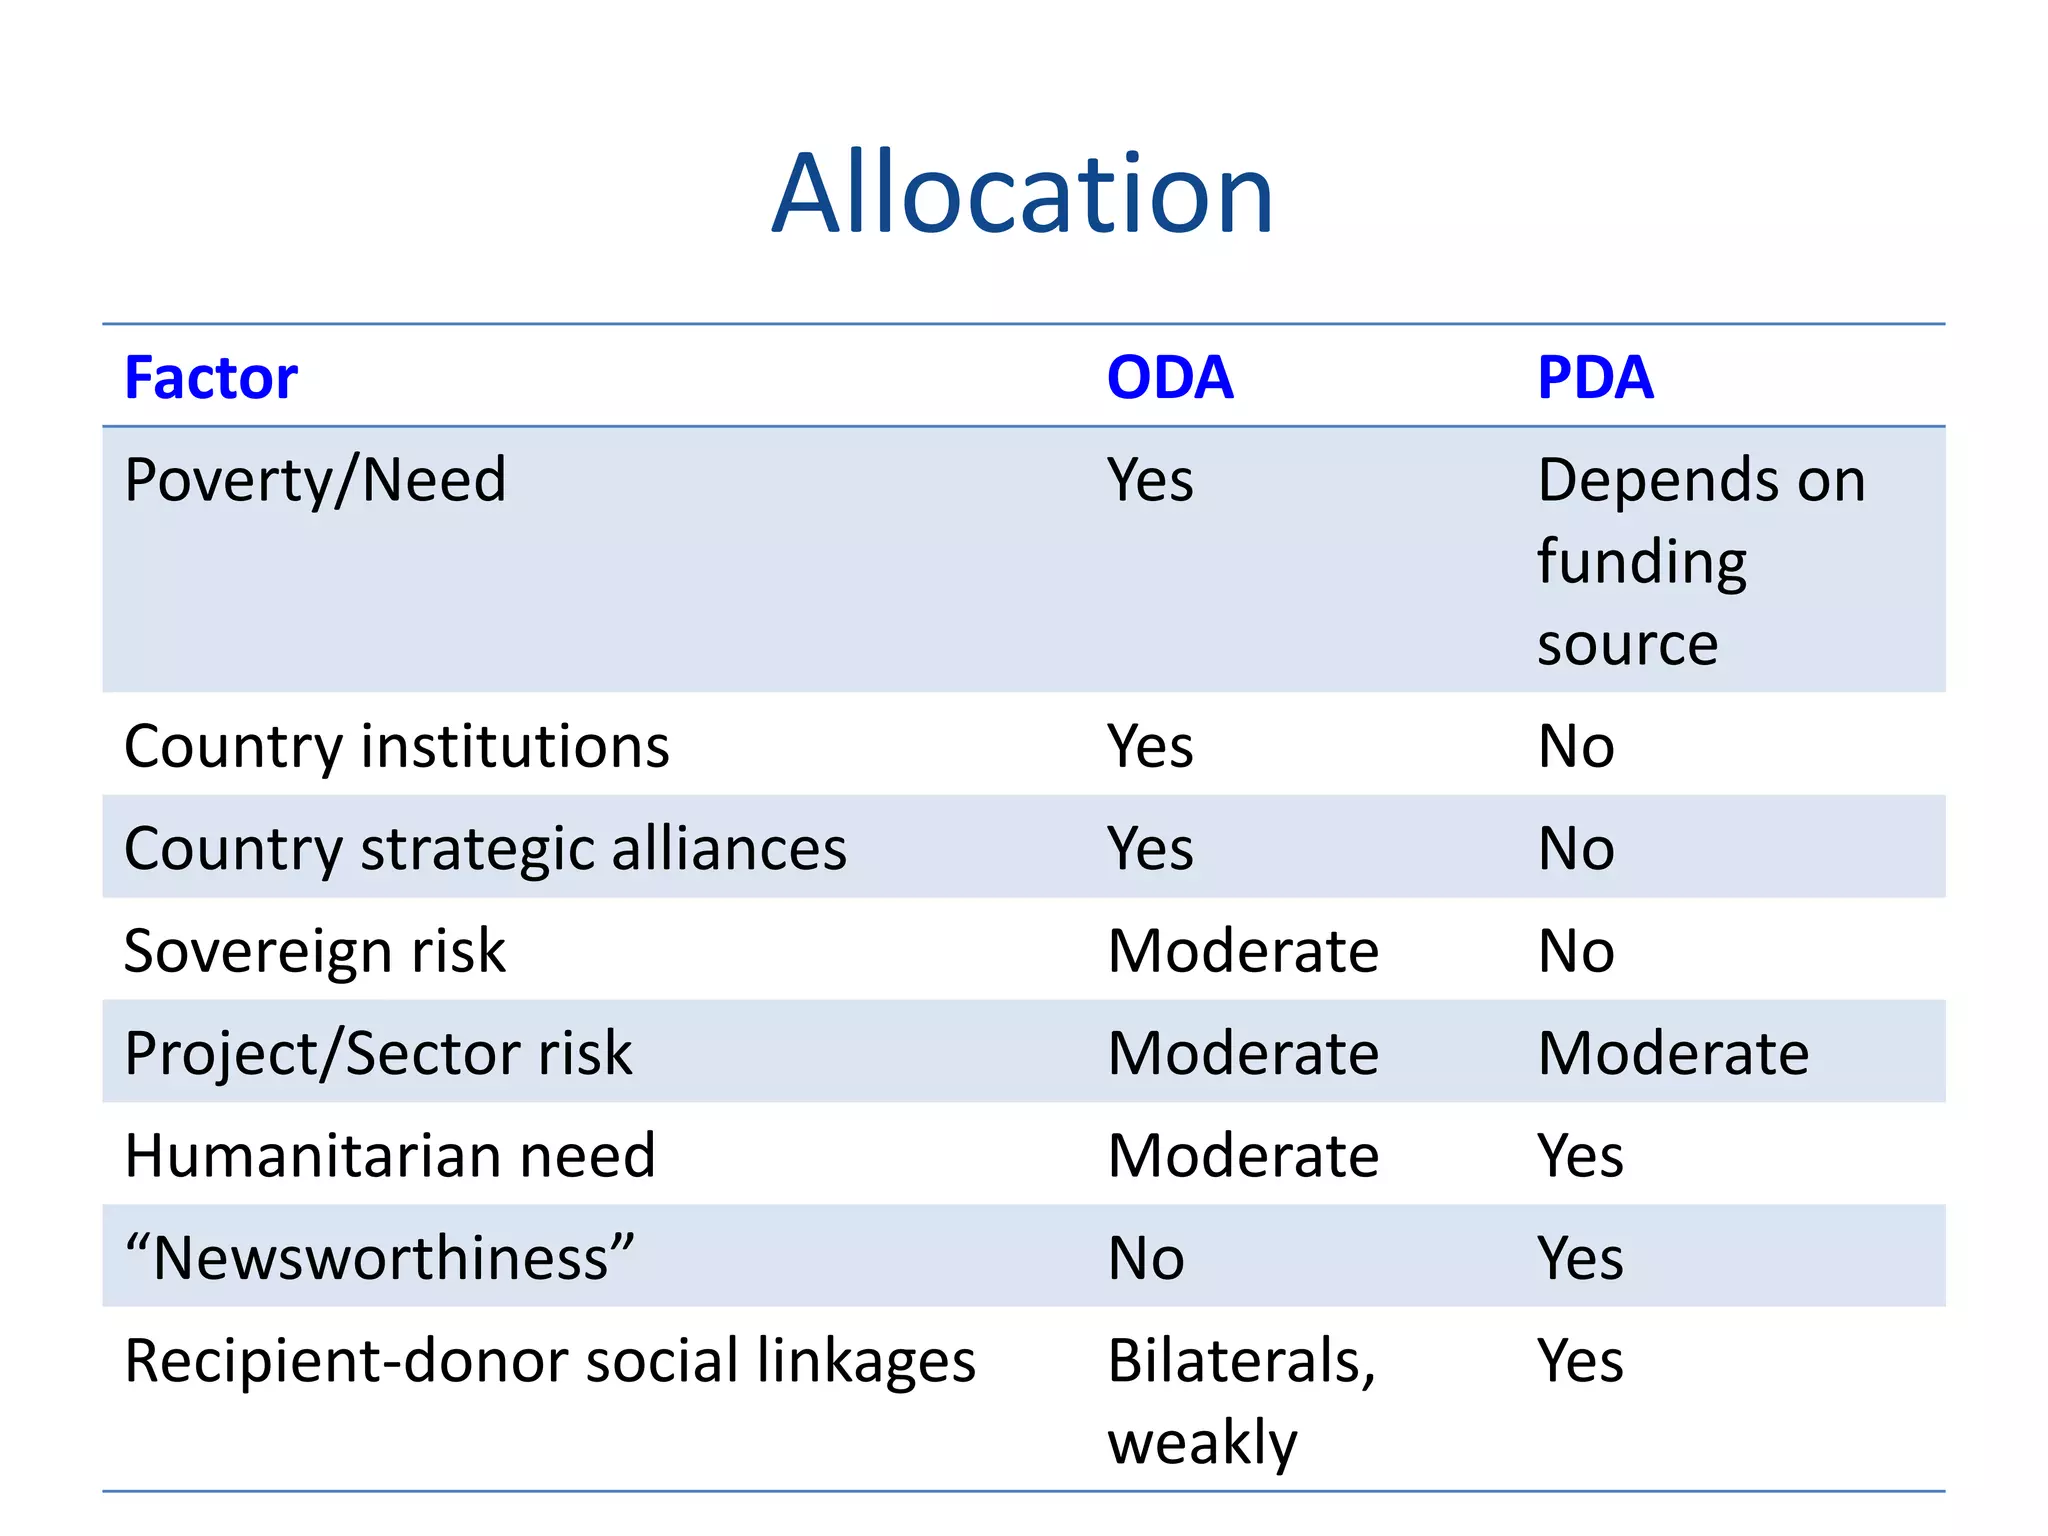
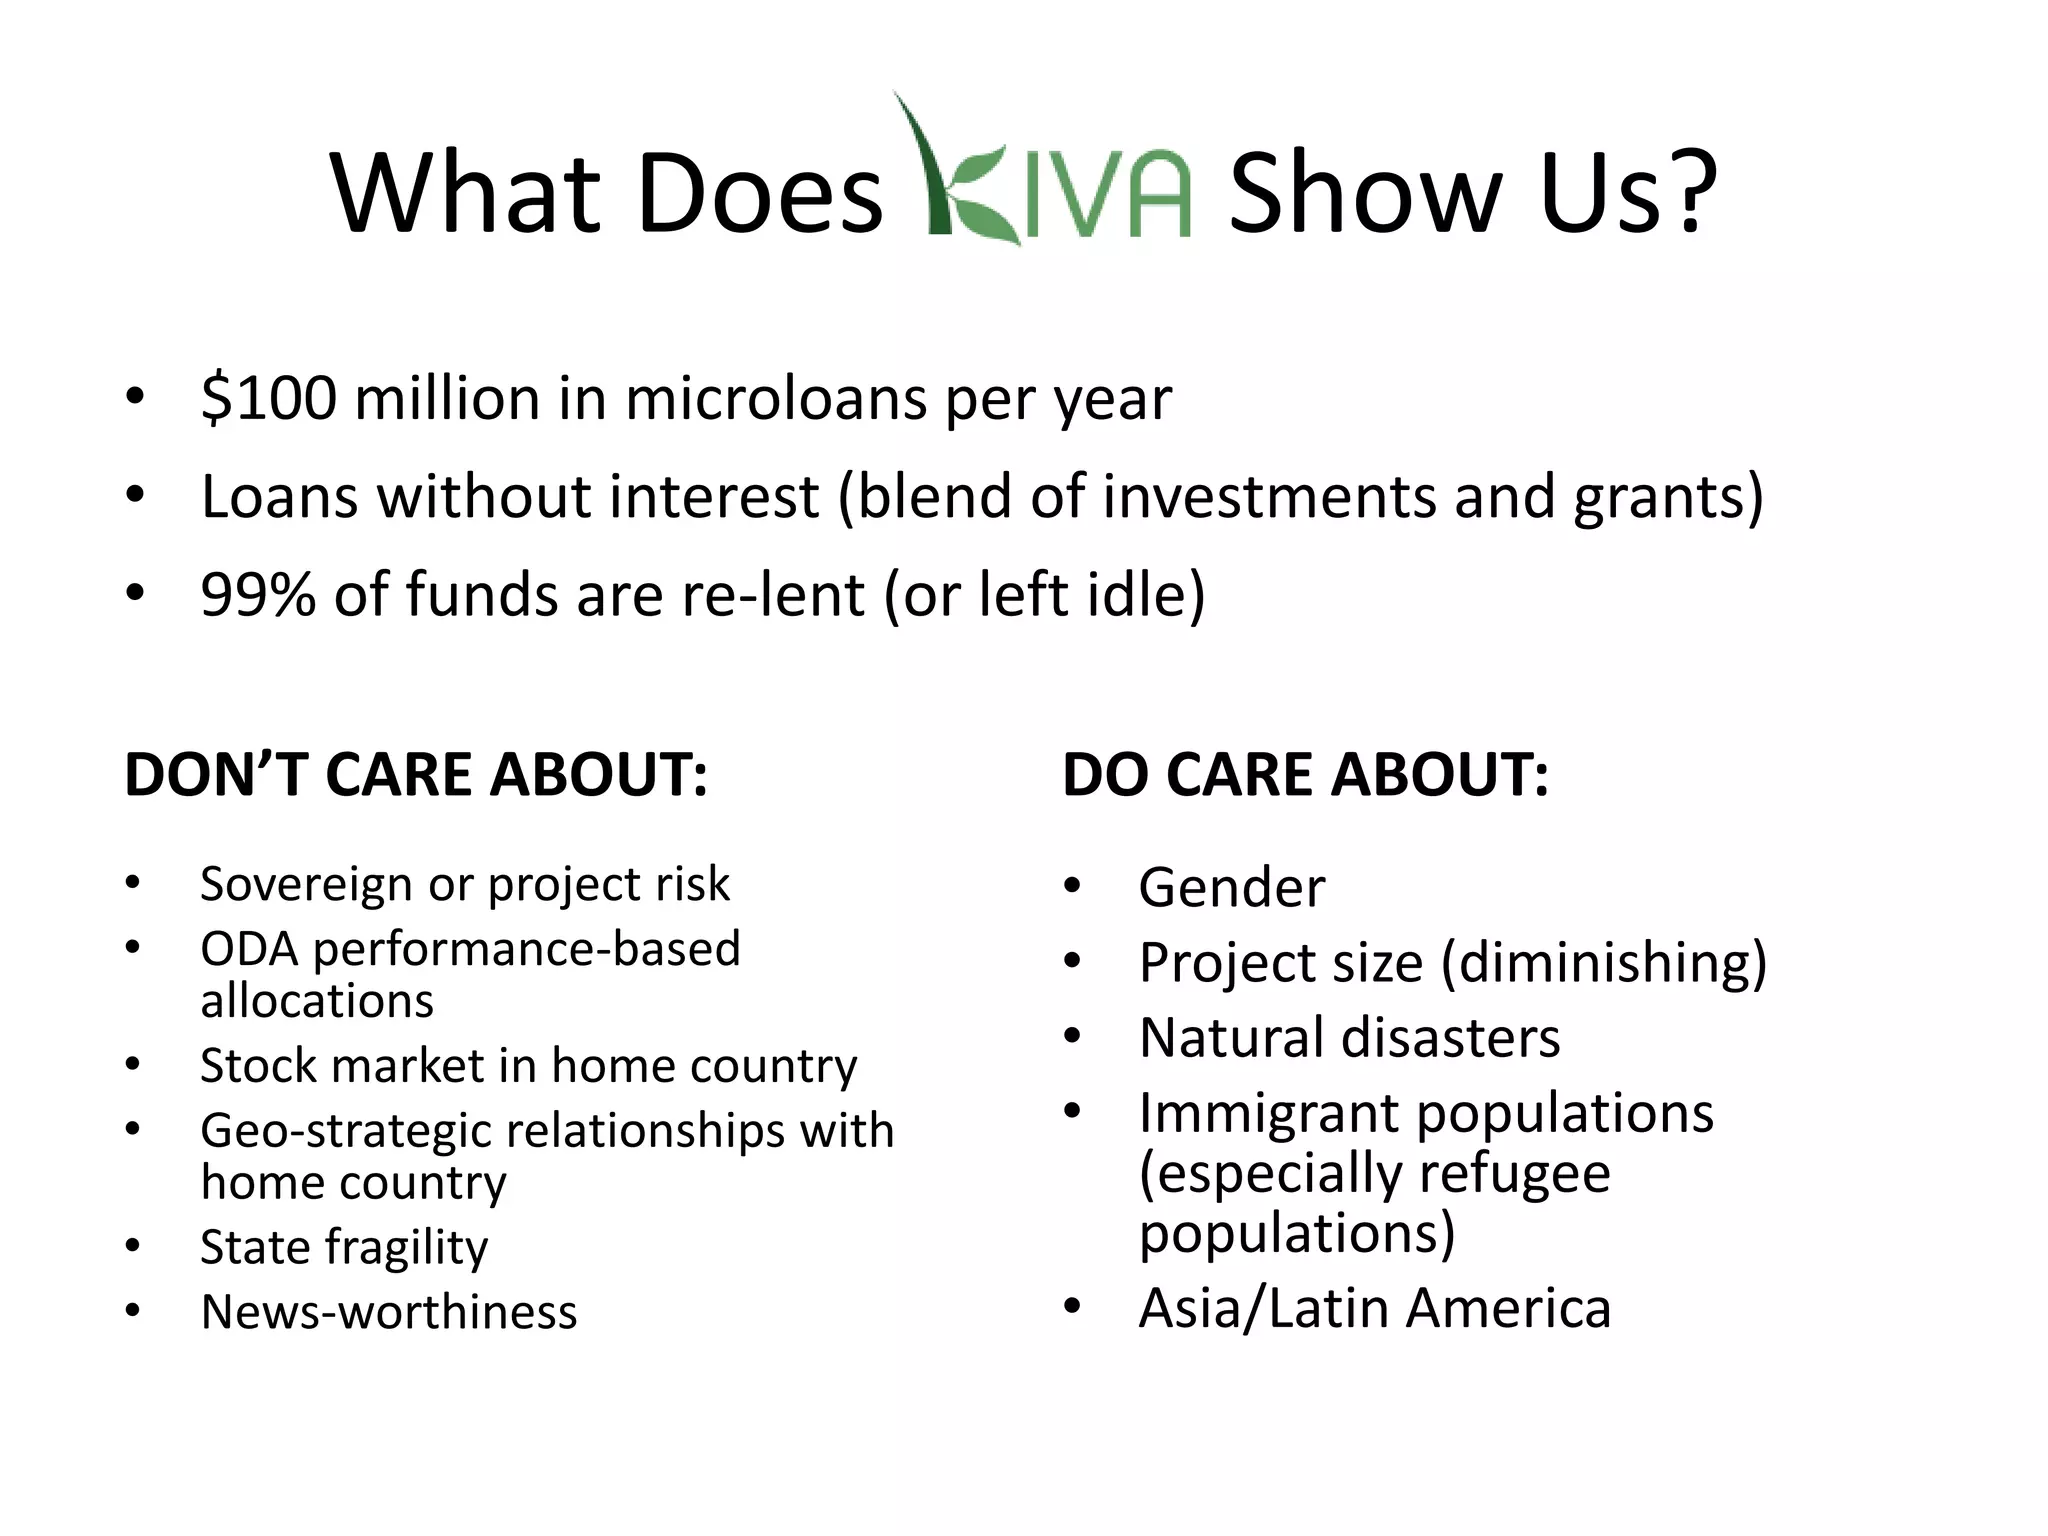

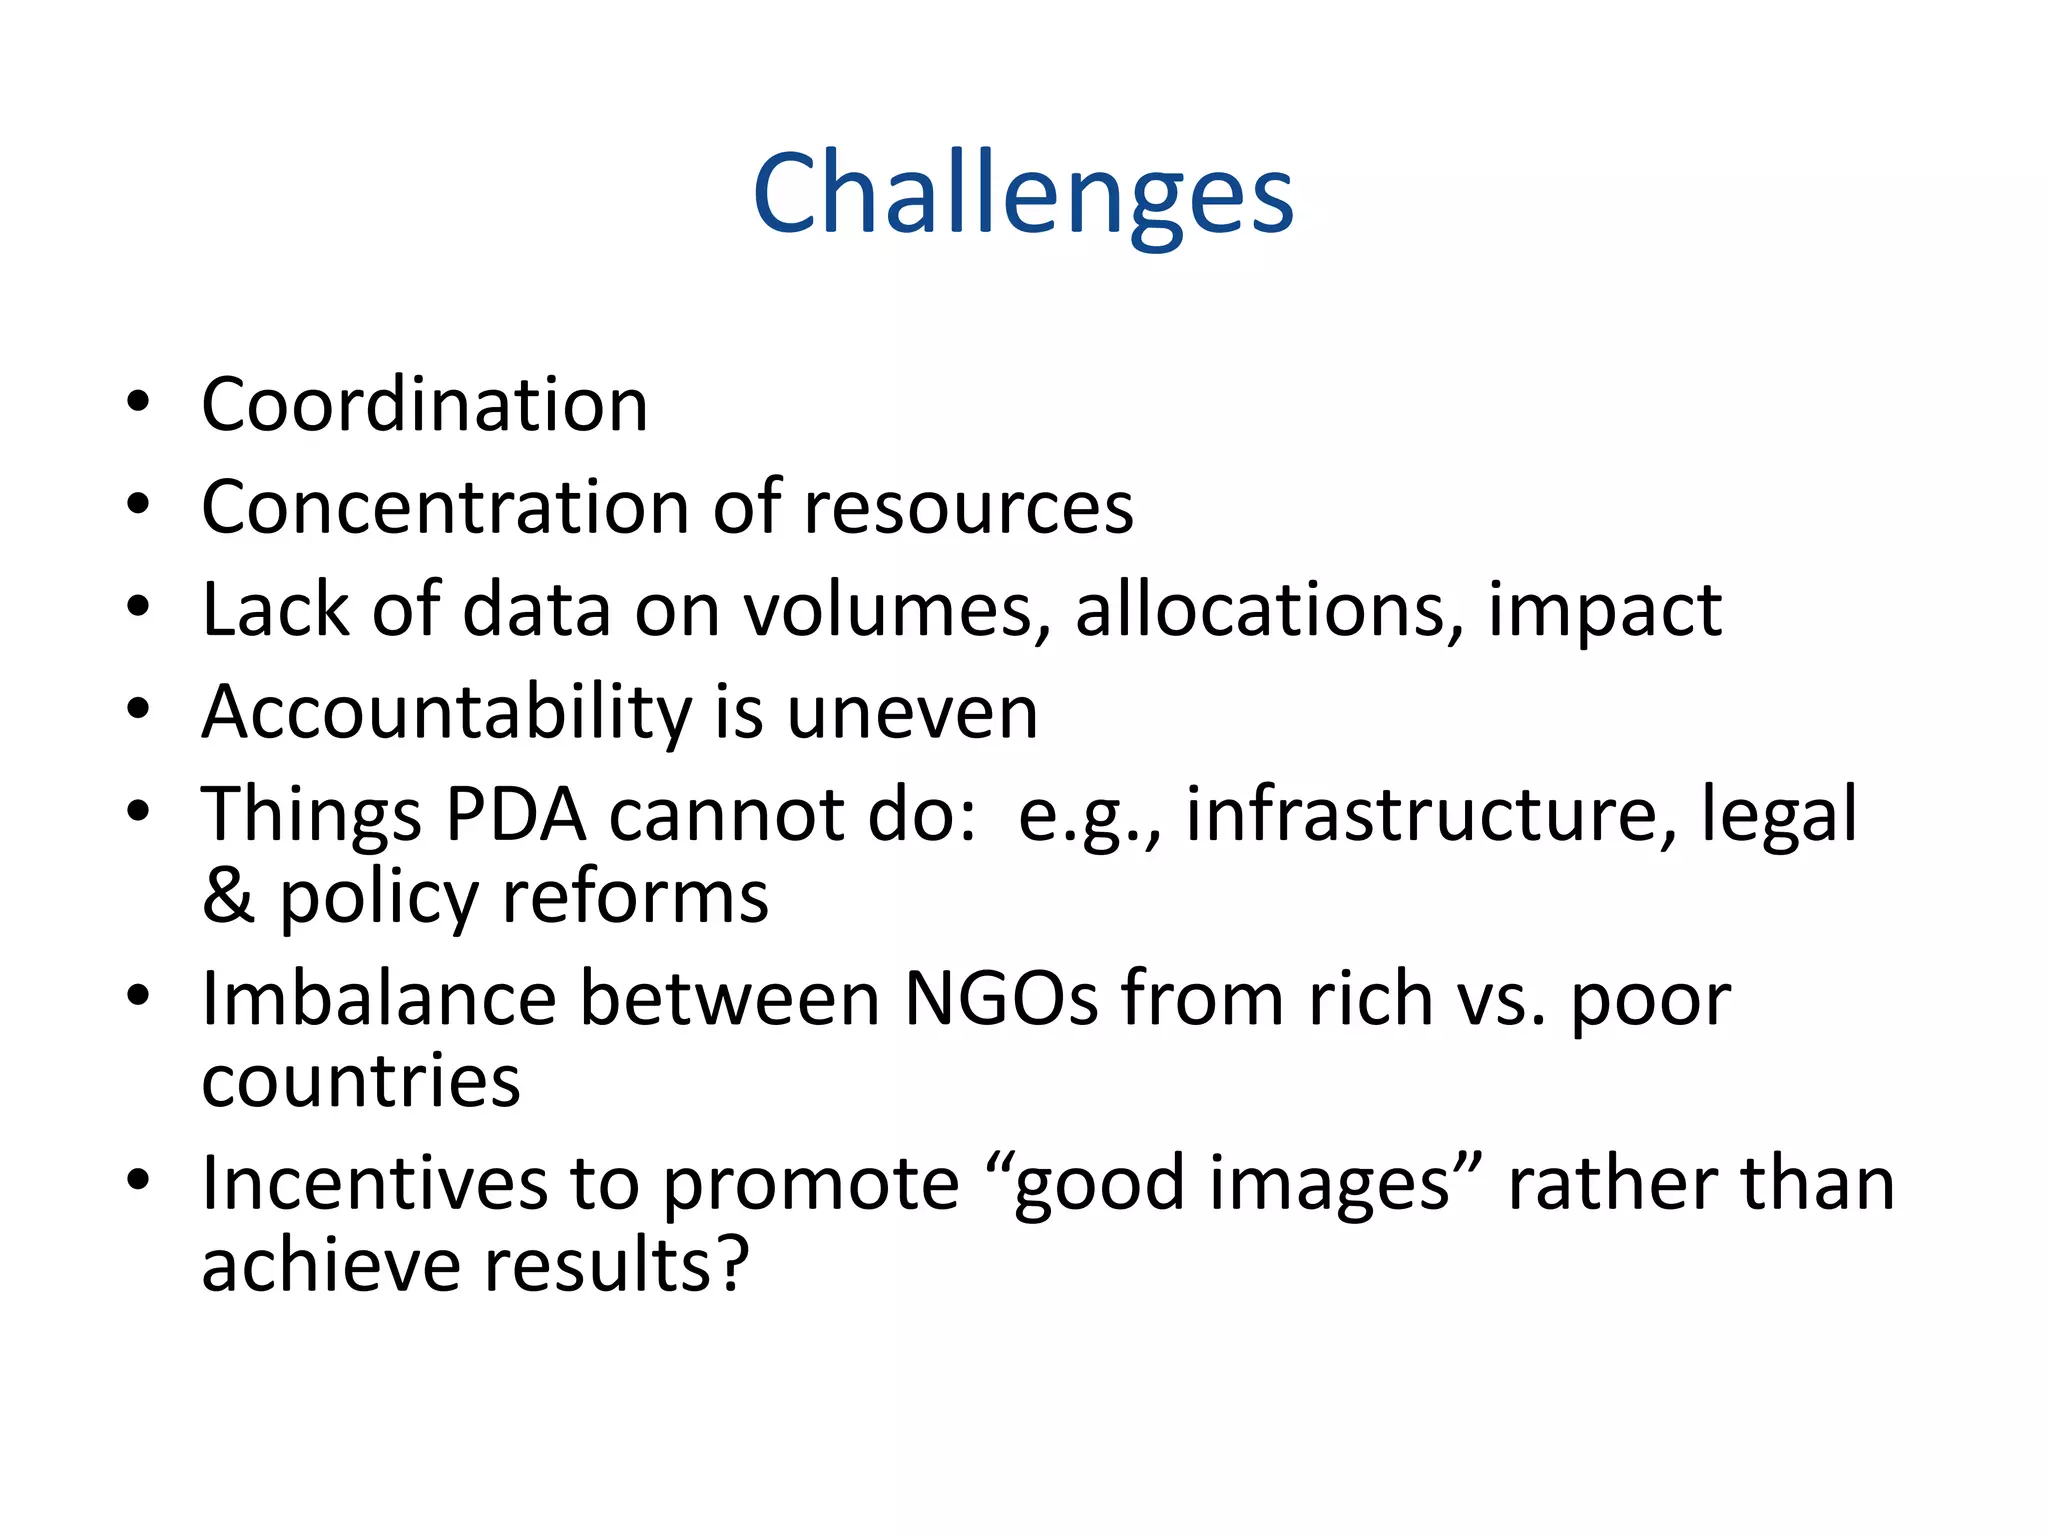

Private development assistance (PDA) from foundations, corporations, and non-profits totals around $45-60 billion annually, roughly equal to official development assistance (ODA). PDA focuses on economic development and humanitarian needs through concessional loans and grants. While PDA bypasses some issues with ODA like corruption and strategic interests, it also lacks coordination, data, and accountability. Moving forward, the PDA community aims to develop effectiveness standards and link more closely with ODA institutions to help shape the post-2015 development agenda.


