Excel Assignment part 2
This week you will continue to work with the scenario from last week. The owner thinks it will be easier to look at sales and profits if charts are used. The owner also wants to identify the Class which was not creating as much revenue as the others.
1. Use your spreadsheet from last week. If you did not calculate the sales in column E within the spreadsheet, fill in that column with numbers.
2. Create a column chart of the monthly sales based on class. Select the range A2:D5 to create the graph.
3. The months should display in the legend.
4. Give the chart a title of Monthly Sales.
5. Give the vertical, y-axis a title of Sales in $.
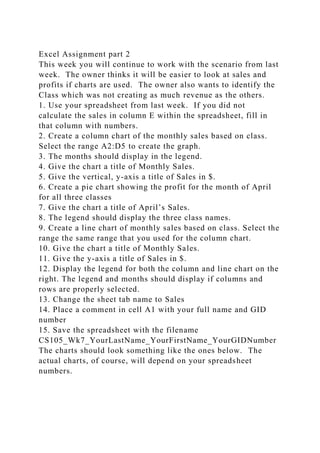
6. Create a pie chart showing the profit for the month of April for all three classes
7. Give the chart a title of April’s Sales.
8. The legend should display the three class names.
9. Create a line chart of monthly sales based on class. Select the range the same range that you used for the column chart.
10. Give the chart a title of Monthly Sales.
11. Give the y-axis a title of Sales in $.
12. Display the legend for both the column and line chart on the right. The legend and months should display if columns and rows are properly selected.
13. Change the sheet tab name to Sales
14. Place a comment in cell A1 with your full name and GID number
15. Save the spreadsheet with the filename CS105_Wk7_YourLastName_YourFirstName_YourGIDNumber
The charts should look something like the ones below. The actual charts, of course, will depend on your spreadsheet numbers.
Excel Assignment 1
In this assignment, you will create a spreadsheet for a business that is providing classes in
Microsoft Word, Excel and PowerPoint. The owner wants to look at sales by class and month
for the second quarter of the year and calculate monthly profit on the classes as well as by type
of class. Open a spreadsheet and do the following:
1. Merge cells B1 through D1 and type Software Sales in all caps. Center this in the merged
cells. Bold the text as well.
2. In cell B2, type Apr. In cell C2, type May. In cell D2, type Jun. Center these in their
cells and make them bold.
3. In A3, type Word. In A4, type Excel. In A5, type PowerPoint. These should all be bold
as well.
4. Type in some numbers to represent the sales of each class for each month. Each number
should be different. Make sure they all have a dollar sign. You need to do this by
formatting the cells as currency with no decimal places.
5. In A7, type Sales and make it bold and in italics. In cell E2 type Sales and make it bold
and in italics
6. Using the SUM function, calculate the total sales for each month. These results should ...
Influencing policy (training slides from Fast Track Impact)
Excel Assignment part 2This week you will continue to work with th.docx
1. Excel Assignment part 2
This week you will continue to work with the scenario from last
week. The owner thinks it will be easier to look at sales and
profits if charts are used. The owner also wants to identify the
Class which was not creating as much revenue as the others.
1. Use your spreadsheet from last week. If you did not
calculate the sales in column E within the spreadsheet, fill in
that column with numbers.
2. Create a column chart of the monthly sales based on class.
Select the range A2:D5 to create the graph.
3. The months should display in the legend.
4. Give the chart a title of Monthly Sales.
5. Give the vertical, y-axis a title of Sales in $.
6. Create a pie chart showing the profit for the month of April
for all three classes
7. Give the chart a title of April’s Sales.
8. The legend should display the three class names.
9. Create a line chart of monthly sales based on class. Select the
range the same range that you used for the column chart.
10. Give the chart a title of Monthly Sales.
11. Give the y-axis a title of Sales in $.
12. Display the legend for both the column and line chart on the
right. The legend and months should display if columns and
rows are properly selected.
13. Change the sheet tab name to Sales
14. Place a comment in cell A1 with your full name and GID
number
15. Save the spreadsheet with the filename
CS105_Wk7_YourLastName_YourFirstName_YourGIDNumber
The charts should look something like the ones below. The
actual charts, of course, will depend on your spreadsheet
numbers.
2. Excel Assignment 1
In this assignment, you will create a spreadsheet for a business
that is providing classes in
Microsoft Word, Excel and PowerPoint. The owner wants to
look at sales by class and month
for the second quarter of the year and calculate monthly profit
on the classes as well as by type
of class. Open a spreadsheet and do the following:
1. Merge cells B1 through D1 and type Software Sales in all
caps. Center this in the merged
cells. Bold the text as well.
2. In cell B2, type Apr. In cell C2, type May. In cell D2, type
Jun. Center these in their
cells and make them bold.
3. In A3, type Word. In A4, type Excel. In A5, type PowerPoint.
These should all be bold
as well.
4. Type in some numbers to represent the sales of each class for
each month. Each number
should be different. Make sure they all have a dollar sign. You
need to do this by
formatting the cells as currency with no decimal places.
5. In A7, type Sales and make it bold and in italics. In cell E2
type Sales and make it bold
and in italics
6. Using the SUM function, calculate the total sales for each
month. These results should
3. be in cells B7, C7, and D7.
7. Using the SUM function, calculate the total sales for each
class. These results should be
in cells E3, E4, and E5.
8. In A8, type Average Sales in bold and italics. Best fit column
A so the words PowerPoint
and Average Sales display fully.
9. Using the average function, find the average sales for each
month. These results should
be in cells B8, C8, and D8.
10. In A9, type Total Profit in bold and italics.
11.
In E9, determine the total profit. Fill this cell with a different c
olor so that it stands out.
12.
In cell A12 enter your first and last name. In cell A13 enter you
r GIDnumber.
13. Save your spreadsheet with the filename
LastNameWeek6_GIDnumber and upload it in
the assignment area.
Grading Criteria Assignments Maximum Points
Open a spreadsheet, enter text and numbers, and
save the spreadsheet – basic skills
4. 45
Use Merge and center 5
Use bold and italics 5
Center text 5
Best Fit column A if needed 3
Change the color of a cell (fill or background) 3
Format currency to have a $ 4
Use the SUM function 10
Use the Average function 5
Enter name and GID number in correct cells 5
Save a spreadsheet with a specific name 10
Total 100