1. ORIGINAL PAPER
Development of a core set of single-locus SSR markers
for allotetraploid rapeseed (Brassica napus L.)
Haitao Li • Muhammad Younas • Xiaofeng Wang • Xuemin Li • Lin Chen •
Bo Zhao • Xun Chen • Jinsong Xu • Fan Hou • Baohua Hong • Gang Liu •
Hongyang Zhao • Xueli Wu • Hongzhi Du • Jiangsheng Wu • Kede Liu
Received: 25 July 2012 / Accepted: 28 November 2012
Ó Springer-Verlag Berlin Heidelberg 2012
Abstract Brassica napus (AACC) is a recent allotetra-
ploid species evolved through hybridization between two
diploids, B. rapa (AA) and B. oleracea (CC). Due to
extensive genome duplication and homoeology within and
between the A and C genomes of B. napus, most SSR
markers display multiple fragments or loci, which limit
their application in genetics and breeding studies of this
economically important crop. In this study, we collected
3,890 SSR markers from previous studies and also devel-
oped 5,968 SSR markers from genomic sequences of
B. rapa, B. oleracea and B. napus. Of these, 2,701 markers
that produced single amplicons were putative single-locus
markers in the B. napus genome. Finally, a set of 230 high-
quality single-locus SSR markers were established and
assigned to the 19 linkage groups of B. napus using a
segregating population with 154 DH individuals. A subset
of 78 selected single-locus SSR markers was proved to be
highly stable and could successfully discriminate each of
the 45 inbred lines and hybrids. In addition, most of the
230 SSR markers showed the single-locus nature in at least
one of the Brassica species of the U’s triangle besides
B. napus. These results indicated that this set of single-
locus SSR markers has a wide range of coverage with
excellent stability and would be useful for gene tagging,
sequence scaffold assignment, comparative mapping,
diversity analysis, variety identification and association
mapping in Brassica species.
Introduction
Plants of the genus Brassica comprise an exceptionally
diverse group of crops grown for edible oil, vegetables,
condiment mustards and forages. The cytogenetic and
evolutionary relationships among the major oilseed and
vegetable species of the genus Brassica are commonly
depicted as the U’s triangle (U N 1935). In the U’s trian-
gle, B. rapa (AA, 2n = 20), B. nigra (BB, 2n = 16), and
B. oleracea (CC, 2n = 18) are three diploids, and
B. carinata (BBCC, 2n = 34), B. juncea (AABB, 2n = 36)
and B. napus (AACC, 2n = 38) are three allotetraploids
each formed through interspecific hybridization among the
three progenitor diploid species.
Comparative mapping using restriction fragment length
polymorphism (RFLP) markers derived from the A. thali-
ana genome indicated that there is extensive co-linearity
between the Brassica and A. thaliana genomes (Parkin
et al. 2005). Most markers are presented as a single copy in
the A. thaliana genome but as multiple copies, on average
three copies, in the Brassica genomes (Cavell et al. 1998;
Lagercrantz et al. 1996; Sadowski et al. 1996). Subsequent
comparative sequencing of chromosomal segments among
B. rapa, B. oleracea and B. napus confirmed the hypothesis
that the genomes of B. rapa and B. oleracea had been
Communicated by C. Quiros.
Electronic supplementary material The online version of this
article (doi:10.1007/s00122-012-2027-z) contains supplementary
material, which is available to authorized users.
H. Li Á M. Younas Á X. Wang Á X. Li Á L. Chen Á B. Zhao Á
X. Chen Á J. Xu Á F. Hou Á B. Hong Á G. Liu Á H. Zhao Á
X. Wu Á H. Du Á J. Wu Á K. Liu (&)
National Key Laboratory of Crop Genetic Improvement,
Huazhong Agricultural University, Wuhan 430070, China
e-mail: kdliu@mail.hzau.edu.cn
H. Li Á M. Younas Á X. Wang Á X. Li Á L. Chen Á B. Zhao Á
X. Chen Á J. Xu Á F. Hou Á B. Hong Á G. Liu Á H. Zhao Á
X. Wu Á H. Du Á J. Wu Á K. Liu
Key Laboratory of Rapeseed Genetic Improvement,
Ministry of Agriculture, Wuhan 430070, China
123
Theor Appl Genet
DOI 10.1007/s00122-012-2027-z
2. triplicated relative to A. thaliana (Cheung et al. 2009;
Town et al. 2006). Comparison of orthologous A and C
genome segments of B. rapa, B. oleracea and B. napus has
indicated that the majority of chromosomal segments could
be detected in 6–8 copies in B. napus genome (Parkin et al.
2005). Microsatellite markers or simple sequence repeats
(SSRs) are tandem DNA repeats from 1 to 6 bp that are
found throughout the coding and non-coding regions of
eukaryotic genomes. In B. napus, most SSR markers display
two or more loci due to the high level of homoeology
between the A and C genomes (Cheng et al. 2009; Li et al.
2011; Ling et al. 2007; Piquemal et al. 2005). The multi-
locus nature of most SSR markers makes it hard to integrate
previously constructed genetic linkage maps and compare
genes/QTLs detected using different genetic populations. In
gene mapping and marker-assisted selection (MAS), it is
necessary to distinguish which locus of the multi-locus
marker linked to the gene of interest.
Multiplexed fluorescent PCR is a technique to signifi-
cantly improve the throughput of SSR genotyping (Guichoux
et al. 2011). Nevertheless, the multi-locus nature of SSR
markers in B. napus limits the number of multiplexed
markers and increases genotyping errors due to reciprocal
overlapping fragments. Similarly, multi-locus SSR markers
bring many problems for population genetic studies. The
polymorphic alleles cannot be assigned precisely to spe-
cific genomic loci in diversity analyses (Chen et al. 2008).
As a consequence, the measurement parameters for diver-
sity including number of alleles, allele frequency and
polymorphism information content (PIC) cannot be esti-
mated correctly. It is widely accepted that single-locus SSR
markers are ideal for association analysis (Comadran et al.
2009; Jin et al. 2010; Stich et al. 2005). Contrastingly, SSR
markers with multiple loci usually bring ambiguous
genotyping in B. napus and make it unsuitable for under-
standing the population structure and linkage disequilib-
rium (LD).
Single-locus markers have advantages over multi-locus
markers in genetic studies and breeding programs since they
would remove all of the abovementioned experimental
problems and technical defects. Currently, more than
10,000 SSR markers are available in the Brassica com-
munity (Cheng et al. 2009; Choi et al. 2007; Iniguez-Luy
et al. 2008; Kaur et al. 2009; Kim et al. 2009; Li et al. 2011;
Parida et al. 2010; Wang et al. 2011a; Xu et al. 2010).
However, most of these publically available SSR markers
detect multiple loci in a panel of materials for polymor-
phism screening. Only a small proportion of SSR markers
were alleged single-locus in B. napus genetic maps, and
some of these were found to be accompanied by redundant
monomorphic amplicons (Kaur et al. 2009; Lowe et al.
2004; Piquemal et al. 2005). The mapped loci of these SSR
markers might not be polymorphic in other studies, whereas
the monomorphic amplicons may be polymorphic. Hence,
these alleged single-locus SSR markers can only be called
population specific single-locus. Although these markers
have been used widely in B. napus, a set of universal single-
locus SSR markers are preferred for B. napus genetic
research and breeding.
To overcome the difficulties of multi-locus markers and
deficiency of genuine single-locus markers, it is necessary
to develop a number of genuine universal single-locus SSR
markers in B. napus. In this study, we aimed to (1) develop
a set of high-quality single-locus SSR markers,(2) assign
the single-locus SSR markers to a B. napus linkage map,
(3) validate a subset of the single-locus markers across a
panel of inbred and hybrid rapeseed lines and (4) test the
universality of the single-locus markers across the other
Brassica ‘‘U’s triangle’’ species.
Materials and methods
Mapping population and DNA isolation
Six B. napus inbred lines (S1, S2, M201, M202, No2127
and ZY821) were used to screen polymorphism of micro-
satellite markers. These lines had previously been used as
the parents of three different mapping populations. A total
of 154 double-haploid (DH) lines (named as BnaNZDH
hereafter) derived from the cross between ‘No2127’ and
‘ZY821’ were used to assign all the single-locus SSR
markers to a B. napus genetic linkage map (Xiao et al.
2007). Of these DH lines, the first 88 lines had been pre-
viously used for construction of linkage maps (Cheng et al.
2009; Li et al. 2011; Wang et al. 2011a). In addition, to test
the universality of the single-locus SSR markers, two
accessions of inbred or DH lines with diverse genetic
background and geographical distribution were selected
from each of B. rapa, B. oleracea, B. nigra, B. juncea,
B. napus and B. carinata (Table 1). Fresh leaves were
collected from the inbred and DH lines for DNA isolation.
DNA samples were diluted to approximate 25 ng/ll and
used as template for PCR amplification.
Polymorphism screening and genetic localization
We collected 3,890 B. napus SSR markers from literature,
including 627 BnGMS markers, 1,398 BoGMS markers,
1,000 BnEMS markers and 865 BrGMS markers from
previous studies by our group (Cheng et al. 2009; Li et al.
2011; Wang et al. 2011a; Xu et al. 2010). Additionally, we
developed 3,493 SSR markers from B. rapa BACs, 2,150
from B. oleracea whole genome shotgun sequences and
325 from B. napus BAC-end sequences (Table 2). These
newly developed markers were also designated as BrGMS,
Theor Appl Genet
123
3. BoGMS and BnGMS, respectively, in the way reported
previously (Cheng et al. 2009; Li et al. 2011; Xu et al.
2010). Primer pairs of these markers were used to amplify
the genomic DNA of the six rapeseed inbred lines for
polymorphism screening. Primer design and synthesis,
PCR amplification, products separation and polyacryl-
amide gel staining were performed as previously described
(Cheng et al. 2009).
SSR markers that only produce a single amplicon in
each of the six inbred lines and showed polymorphisms
between ZY821 and No2127, the two parents of the
BnaNZDH population, were used for population survey.
Genotypes for each individual were scored as described
previously (Xu et al. 2010) and those markers that segre-
gated in the DH population in a bi-allele pattern were
thought to be single-locus. Genetic linkage map was con-
structed using JoinMap3.0 (Van Ooijen and Voorrips 2001)
with the following mapping parameters. The order of loci
was determined using recombination frequency 0.4 and
minimum logarithm of odds (LOD) scores of 2.0. A
‘‘ripple’’ was performed after adding each locus and the
threshold for removal of loci with respect to jumps in
goodness-fit was set to 5. Lastly, the markers were assigned
to linkage groups using logarithm of odds (LOD) of
4.0–10.0. All genetic distances were expressed in centi-
Morgan converted from recombination value using the
Kosambi function (Kosambi 1944). In order to assign the
single-locus SSR markers to specific linkage groups (LGs),
112 single-locus SSR markers were selected from previ-
ously published linkage maps and used as anchor markers,
which included 87 markers from linkage maps constructed
using the same BnaNZDH population (Cheng et al. 2009;
Li et al. 2011; Wang et al. 2011a; Xu et al. 2010) and 25
SSR markers from other linkage maps (Choi et al. 2007;
Kim et al. 2009; Lowe et al. 2004; Piquemal et al. 2005;
Suwabe et al. 2008).
Validation of single-locus markers in rapeseed
accessions
To confirm that the identified single-locus markers are
stable in different rapeseed varieties and test the marker
usage in DNA fingerprinting and diversity analysis, 41
markers that amplified only in B. rapa or B. oleracea
and 37 markers that were present in both B. rapa and
B. oleracea (see ‘‘Results’’) were selected to genotype 45
rapeseed inbred lines and 45 hybrid cultivars separately
(Supplemental Table 2). These inbred lines, which inclu-
ded 28 from China, 6 from Europe, 4 from Canada, 5 from
Australia, and 2 from Japan, were selected from four
diverse subgroups representing a collection of 192 inbred
lines from all over the world (Xiao et al. 2012). They had
been selfed for more than ten generations and are consid-
ered to be homozygous for most regions of the genome.
The hybrids were true F1 generation bred by research
institutes from nine provinces or cities. The observed het-
erozygosity (Ho), polymorphism information content (PIC)
Table 1 List of Brassica species used for evaluation of universality
of single-locus SSR markers
Accession Genome Species Origin
Kenshin AA B. rapa Korea
Yellow Sarson AA B. rapa India
Chi jie lan CC B. oleracea China
A12 CC B. oleracea Europe
B. nigra (L.)
Koch cv Giebra
BB B. nigra Europe
N BB B. nigra Europe
G37 AACC B. napus Australia
G38 AACC B. napus Canada
10H002-1 AABB B. juncea Hubei (China)
10H003-1 AABB B. juncea Shanxi (China)
CGN03995 BBCC B. carinata Europe
CGN03943 BBCC B. carinata Europe
Table 2 Amplification patterns of SSR markers collected from different sources
Marker type Sources Markers Amplifiede
Single amplicon (%) Two amplicons (%) C Three amplicons (%)
BnGMSa
B. napus GSSs 952 884 307 (34.7) 296 (33.5) 281 (31.8)
BnEMSb
B. napus ESTs 1,000 776 198 (25.5) 353 (45.5) 225 (29.0)
BrGMSc
B. rapa BACs 4,358 3,558 1,114 (31.3) 1,327 (37.3) 1,117 (31.4)
BoGMSd
B. oleracea GSSs 3,548 2,791 1,082 (38.8) 903 (32.4) 806 (28.8)
Total 9,858 8,009 2,701 (33.8) 2,879 (35.9) 2,429 (30.3)
a
The marker includes 627 from Cheng et al. (2009) and 325 developed newly in this study
b
The markers includes 1,000 from Wang et al. (2011a)
c
The marker includes 865 from Xu et al. (2010) and 3,493 developed newly in this study
d
The marker includes 1,398 from Li et al. (2011) and 2,150 developed newly in this study
e
The amplified markers with clear main band
Theor Appl Genet
123
4. value and pair-wise genetic distances between accessions
were calculated using Powermarker version V3.51 package
(Liu and Muse 2005). The Ho is the proportion of observed
heterozygous individuals in the population. At a single
locus it is estimated as:
HO ¼ 1 À
Xn
u¼1
puu
where puu is the frequency of individual with homozygous
allele u, and n is the number of alleles. The PIC value was
estimated using the standard equation (Botstein et al.
1980):
PIC ¼ 1 À
Xn
i¼1
p2
i À 2
XnÀ1
i¼1
Xn
j¼iþ1
p2
i
p2
j
" #
where pi is the frequency of the ith allele, and n is the
number of alleles. The neighbor-joining (N-J) tree based on
the Nei’s distance using MEGA 4.0 was employed to
display genetic relationship and reciprocal difference in the
45 inbred lines and 45 hybrids (Tamura et al. 2007).
Evaluation of single-locus markers across relative
Brassica species
In order to detect the universality of the single-locus
markers in the cultivated Brassica species, all the con-
firmed single-locus SSR markers in this study were used to
amplify the genomic DNA of two accessions from each of
the six species in the U’s triangle. Band patterns of all
markers in every species were visually observed on the
denaturing polyacrylamide gels. Those markers that dis-
played a single amplicon in both accessions of a species
were identified as putative single-locus, and ones that
displayed two or more amplicons in at least one accession
of a species were identified as putative multi-locus.
Meanwhile, those markers without any positive PCR
amplifications in both two accessions of a species were
considered as null-locus.
Results
Screening for single-locus SSR markers
All 9,858 SSR markers, including 4,358 BrGMS markers,
3,548 BoGMS markers, 952 BnGMS markers and 1,000
BnEMS markers, were used to amplify the genomic DNA
from six inbred lines to screen for polymorphisms. Of these
SSR markers, 8,009 produced clear fragments, of which,
2,701 (33.8 %) displayed single amplicons, 2,879 (35.9 %)
displayed two amplicons, and 2,429 (30.3 %) displayed
three or more amplicons (Table 2).
Of each marker type, 1,082 (38.8 %) BoGMS, 307
(34.7 %) BnGMS and 1,114 (31.3 %) BrGMS markers
detected single amplicons, where the BnEMS markers had
the lowest level of single amplicons (25.5 %). For the
markers with two amplicons, the rate of BnEMS (45.5 %)
was significantly higher than BrGMS (37.3 %), BnGMS
(33.5 %) and BoGMS (32.4 %) (P 0.05). This observa-
tion might suggest that the coding regions are more con-
served than intergenic and intron regions. Of the 2,701
putative single-locus SSR markers, 1,087 showed poly-
morphism between No2127 and ZY821, the two parents of
the BnaNZDH population.
Assignment of the single-locus SSR markers to linkage
map
A core set of clear and prominent putative single-locus
SSR markers covering the whole genome of B. napus were
sorted out from the 1,087 polymorphic markers with the
following criteria: (1) high-quality amplification excluding
strong stutter bands and background products; and (2) good
resolution with appropriate spacings between adjacent
alleles. Based on these criteria, a total of 283 high-quality
putative single-locus SSR markers with single amplicon
were selected, which included 25 single-locus SSR markers
from other maps as anchors (Lowe et al. 2004; Piquemal
et al. 2005; Suwabe et al. 2008).
To test whether these markers are truly inherited in a
single-locus mode and assign them to B. napus linkage
groups, the 283 selected markers were subjected to survey
the BnaNZDH population. Of these 283 markers, 241
displaying bi-allele pattern were identified to be true single-
locus and the remaining 42 were regarded as dominant
markers with two loci from homoeologous chromosome
regions. Finally, 230 high-quality single-locus markers
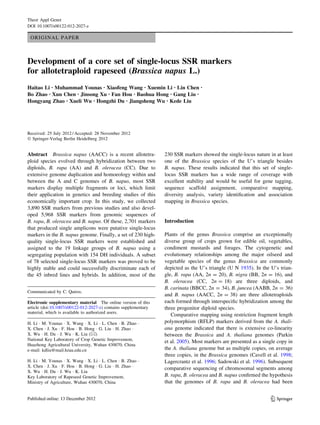
were assigned to the BnaNZDH linkage map (Fig. 1;
Supplemental Table S1), and 11 single-locus markers could
not be assigned to any linkage group. To fill the gaps on
linkage groups, 146 polymorphic single-locus SSR markers
with one or two redundant monomorphic amplicons were
selected to genotype the DH individuals and assigned to
linkage groups (Fig. 1). The 230 single-locus markers were
distributed randomly all over the genome, with 122 and 108
markers on the A and C chromosomes, respectively. The
number of single-locus markers ranged from 3 on A4 and
C1 to 31 on A3. The remaining 16 linkage groups had 6–26
single-locus markers (Fig. 1; Supplemental Table S1).
A total of 81 and 70 single-locus BrGMS and BoGMS
markers were, respectively, assigned to the linkage map. Of
the 81 BrGMS markers, 78 (96.3 %) were assigned to the
A genome. Of the 70 BoGMS markers, 69 (98.6 %) were
assigned to the C genome of B. napus. The BnGMS and
BnEMS markers were evenly distributed in the A and C
Theor Appl Genet
123
5. genomes, respectively. This result suggests that the single-
locus BrGMS and BoGMS markers conservatively amplify
loci from their source genome (Lowe et al. 2004; Suwabe
et al. 2008). However, one BoGMS (BoMGS0116) marker
was mapped in the A genome and 3 BrGMS (BrGMS2767,
BrGMS2901and BrGMS4450) markers were mapped in
the C genome. Further investigation indicated that these
four markers, BoMGS0116, BrGMS2767, BrGMS2901
and BrGMS4450, could successfully amplify in both
B. rapa (A genome) and B. oleracea (C genome) genomes
BrGMS30350
BrGMS30321
BrGMS13265
BrGMS13738
BrGMS13759
BrGMS066713
sR629315
BrGMS380619
BnGMS063528
BnGMS010334
BnGMS094541
BrGMS141161
BrGMS143674
BrGMS385475
BrGMS380776
BrGMS006083
BrGMS134388
A2 BnEMS00560
BrGMS15623
BrGMS25056
BrGMS299811
BrGMS262816
cnu_m316a20
sR1164422
BRMS-04226
BRMS-05028
BrGMS358230
BrGMS147431
BoGMS173439
BrGMS073449
BrGMS028351
BrGMS308055
BrGMS1490BrGMS158856
BnEMS072759
BrGMS390674
BrGMS221076
BrGMS329178
BrGMS329079
BrGMS304185
BrGMS268786
BrGMS404691
BnEMS047294
BrGMS3199101
BrGMS3126102
BrGMS3124BrGMS3125104
BoGMS2594108
BrGMS3103113
BrGMS0485114
cnu_m250a116
BrGMS2969117
BrGMS2498118
BrGMS1569119
BrGMS4057120
BrGMS2771122
BrGMS3072123
BoGMS3724128
BrGMS1450134
BrGMS3607145
BrGMS0094156
BrGMS2670165
BRMS-008167
A3
BrGMS43500
BRMS-12512
BrGMS264917
sN202530
BoGMS306933
BrGMS394238
BoGMS257348
BrEMS004751
BoGMS223855
BrGMS436957
BrGMS171368
BrGMS402770
A4
52 BnGMS254b
BrGMS21930
BoGMS206319
BrGMS286427
BrGMS367237
BrGMS311449
BRAS08463
BrEMS001566
BRMS-03182
Na12-C0684
BrGMS402887
BrGMS403188
BrGMS4320103
BnEMS1215108
A1
BrGMS243196
BRMS-0989
BnEMS00310
BnGMS06153
BrGMS40869
BrGMS284914
BoGMS194220
CB1008026
BrGMS225228
BrGMS177830
BrGMS349432
BnGMS029336
BrGMS4111
BrGMS4110
37
BrGMS414940
BrGMS007042
BrGMS180445
BnGMS066258
BrGMS415163
BrGMS289671
BrGMS178675
BrGMS414776
BoGMS229785
A5
BoGMS29250
BrGMS188213
BrGMS364623
BrGMS365326
BrEMS000532
Na12-D0846
BnEMS034066
BrGMS189472
BoGMS373380
BoGMS133587
BrGMS334898
BrGMS2876106
BrGMS3452114
BrGMS3750
BrGMS3455
117
BoGMS0641122
BrGMS2130128
BrGMS0083133
BrGMS2092143
BrGMS0140150
BrGMS0108151
BrGMS1367158
BrGMS1369159
BrGMS4194163
BnEMS0753169
A6
BrGMS28100
BrGMS39769
nia_m043a14
BnEMS062027
BrGMS298934
BrEMS002839
BrGMS383747
BRMS-01850
BrGMS017153
BnEMS052556
BrGMS003860
Ra2-G0862
BrGMS302180
A7
BnEMS04580
BRMS-08811
BnGMS037313
BrGMS075816
BrGMS224430
BoGMS229433
BrGMS202539
BrGMS233453
BrGMS429854
BrGMS417063
BrGMS074268
BrGMS237575
BrGMS358682
BoGMS1695101
A8
115 BrGMS0753
BnGMS063971 BnEMS103893
BoGMS05860
BoGMS01162
BrGMS21596
BoGMS34957
BrGMS21618
BnEMS016910
BnGMS001413
BrGMS096116
BrGMS045430
cnu_m372a33
BrGMS104643
BrGMS194644
BrGMS425255
BoGMS161457
BoGMS2018
BrGMS4289
60
BnGMS071371
BrGMS209676
BrGMS419680
Ol12-F0285
BrGMS036689
BnGMS0281100
BrGMS1022104
BnGMS0950111
A9
BnEMS06030
BnGMS000912
BoGMS111415
BrGMS392516
Na10-E0818
BnGMS017119
BnEMS044625
Na10-D0730
BrGMS309332
BrGMS378734
BrGMS088235
BrGMS384937
BrGMS368839
BrGMS089942
BrGMS375545
BrGMS121846
BrGMS121747
BrGMS057948
BrGMS223850
BrGMS0086
BnEMS0048
53
BrGMS378454
BrGMS385756
BrGMS247965
A10
BnEMS02870
BoGMS21283
BrGMS134613
BoGMS165221
BoGMS029928
BoGMS201635
BoGMS159650
BoGMS238755
BoGMS151561
BoEMS001664
BnEMS069467
BnGMS096672
CB1002687
BoGMS2030100
BrGMS0511108
BnEMS1119115
BoGMS1979133
C2
BoGMS23540
BoGMS220712
CB1059723
BoGMS189736
BrGMS78244
BnGMS027149
BoGMS104260
BoGMS156572
BoGMS103781
BoGMS153985
BnEMS41596
BoGMS2622103
BrGMS1285116
BrGMS3672129
C1
BnEMS05276
BoGMS18130
BoGMS07058
BoGMS202628
BoGMS296543
BRAS02946
BoGMS067847
BoGMS174052
BoGMS057660
BoGMS300966
BoGMS008169
BoGMS042071
BrGMS271975
BoGMS243177
BnGMS077178
BrGMS2767BRAS00582
BRAS087 BRAS05184
BoGMS235187
BoGMS174689
BoGMS275996
BoGMS1235105
BnGMS0575121
BnGMS0574122
BoGMS0687129
BoGMS2856133
BoGMS1343BoGMS1937134
BnGMS0002136
BoGMS3581139
BnGMS0289 BoEMS0004148
BrGMS2881153
C3
Na12-D090
BoGMS057312
BRAS02123
BoGMS231931
BoGMS176436
BoGMS083643
BoGMS209160
C4
BoGMS13300
BoGMS22288
BrGMS301614
BoGMS268824
BoGMS325135
Na12-G1252
BnGMS080857
BoGMS176263
BrGMS218568
BoGMS206470
BnGMS100472
C5
BoGMS14320
BoGMS22568
BoGMS190915
BoGMS174719
BrGMS290130
Na12-A0534
BnGMS035340
BoGMS365443
BoGMS032747
BrGMS075356
BoGMS246857
BnGMS096863
BoGMS063268
BoGMS287876
BoGMS330983
BoGMS121886
BoGMS232289
BoGMS299296
BoGMS169797
BoGMS3538100
sS2486102
BoGMS1929112
BoGMS1852115
BoGMS2031122
C6
BoGMS104950
BoGMS118543
BoGMS2590
BoGMS2473
0
BoGMS111814
BoGMS045416
BnGMS074922
BoGMS102825
BoGMS236060
BnEMS115067
BrGMS369368
BoGMS218074
BoGMS249975
BnEMS053776
BoGMS106577
BoGMS039478
BoEMS004979
BoGMS053780
CB1043181
BnGMS038686
BoGMS141288
BoGMS209596
C7
BoGMS34090
BoGMS316216
BrGMS258119
BrGMS445022
BnEMS002034
BoGMS179556
BnGMS050974
BoGMS020888
BoGMS114590
BnGMS033693
BoGMS343299
BoGMS3213105
BoGMS2791114
C8
BoGMS12830
BnEMS11324
BoGMS25046
BoGMS16157
BoGMS360811
BoGMS028116
BnEMS000822
BoGMS300023
BoGMS217524
BnEMS000625
BoGMS238431
BnGMS063436
BoGMS128751
BoGMS052553
BoGMS045755
BnGMS064659
BoGMS156764
BnEMS004269
BnEMS025371
BoGMS348872
BoGMS313976
BoGMS247780
BnEMS010082
BoGMS1467113
BoGMS0112120
C9
BnEMS002845
BoGMS086692
BoGMS1413107
Na12-F0329
BRMS-23b37
CB10045b47
Fig. 1 Distribution of single-locus SSR markers on the genetic
linkage map constructed using the BnaNZDH population derived
from No2127 and ZY821. The single-locus SSR markers are
highlighted in boldface. The SSR markers selected from previous
maps published by other research groups are underlined (Lowe et al.
2004; Piquemal et al. 2005; Suwabe et al. 2008)
Theor Appl Genet
123
6. (Supplemental Table S2), suggesting that the ‘misassign-
ment’ of these markers might be caused by deletion or
mutation that occurred at the target primer binding sites in
the corresponding cognate genome in B. napus.
Stability and utility of single-locus SSR markers
in B. napus
The SSR markers displaying a single amplicon in the
above-mentioned six B. napus varieties may not show a
single-locus pattern in more diverse lines. To confirm if
these single-locus markers are applicable in a diverse set of
rapeseed germplasm, we selected 78 single-locus SSRs
across the A and C genomes to genotype 45 B. napus
inbred lines representing a diverse germplasm from all over
the world (Xiao et al. 2012). Each SSR marker is expected
to have a single allele in an inbred line. All markers
detected a unique locus in these inbred lines as observed in
the six inbred lines used for polymorphism screening and
in above BnaNZDH mapping population. Allele frequency
at each marker locus in the population was calculated
(Supplemental Table S3). With this information, the
observed heterozygosity (Ho) value at each locus was
employed to display the percentage of heterozygous indi-
viduals in the inbred lines (Table 3; Supplemental Table
S3). Theoretically, the Ho value should be close to 0 in
inbred lines. In our collection, the Ho value of 36 loci was
0, which means that all inbred lines are homozygous at
these loci. Seventeen markers or loci each detected one
heterozygous line in the inbred lines and had a Ho value of
0.02 at each locus. Sixteen markers each detected 2–4
heterozygous lines and had a Ho value ranging from 0.04 to
0.10. The remaining nine markers each detected 5–10
heterozygous lines and had a Ho value ranging from 0.11 to
0.23. Taken together, the average Ho value was 0.04, which
is very close to 0 and consistent with the genome charac-
teristics of inbred lines. This phenomenon suggested that
these markers could display single allele in most B. napus
varieties except for a very few heterozygous genotypes,
which revealed the single-locus SSR markers are universal
in the rapeseed pool.
Furthermore, it is expected that the Ho value in hybrids
would be higher than 0. We further validated the stability of
the 78 single-locus SSR markers in 45 hybrid cultivars with
the Ho value (Table 3; Supplemental Table S3). The Ho
values of 26 markers ranged from 0.51 to 0.91 (21–39
heterozygous individuals at each locus). Forty-three mark-
ers had a Ho value between 0.11 and 0.49 (5–22 heterozy-
gous individuals at each locus). Nine markers had a Ho
value ranging from 0 to 0.02, which might be due to their
much lower polymorphism. In total, the average heterozy-
gosity value was 0.41 (Table 3), which is significantly
higher than that in the inbred lines (0.04). These results
confirmed these SSR markers were universal single-locus
across a wide range of inbred lines and hybrid cultivars in
B. napus, and thus can be used for various aspects of genetic
studies in rapeseed gene pools.
The effectiveness of the single-locus markers was also
evaluated in the 45 inbred lines and 45 hybrids by com-
puting parameters for genetic diversity. The average PIC
value in the inbred lines was 0.41 (varying from 0.04 to
0.74), which was slightly higher than that in the hybrids
(0.37), ranging from 0 to 0.83 (Table 3). With this infor-
mation, the genetic distance between every two rapeseed
inbred lines and hybrids were calculated using the Pow-
ermaker software. Accordingly, the average pairwise
genetic distance in inbred lines was 0.68, which was sig-
nificantly higher than that of 0.36 in hybrids. This differ-
ence is consistent with their geographical origins, where
the inbred lines were collected from all over the world but
all of the hybrids were cultivars in China, which suggested
that the markers have good ability for diversity analysis in
rapeseed varieties. A total of 252 alleles were detected in
inbred lines. Two to nine alleles were detected per single-
locus marker, with an average of 3.23, which was almost
the same as the average number of alleles in hybrids (3.01),
ranging from 1 to 8 (Table 3). An N-J tree was generated
using allelic data of the 78 SSRs. All 45 inbred lines and 45
hybrids were readily discriminated from one another
(Supplemental Fig. 1).
Universality of single-locus markers to the relative
species
To investigate whether the single-locus SSR markers
also produce single amplicons in other species of the U’s
triangle, we amplified the genomic DNA from B. rapa,
B. oleracea, B. nigra, B. juncea and B. carinata with the
230 mapped single-locus SSR markers by using B. napus
as control (Table 1). Detailed amplification information is
provided in Table 4 and Supplemental Table S4 and the
distribution of markers that display single amplicon in each
species is highlighted in Fig. 2. Of the 230 SSR markers,
118 (51.3 %), 125 (54.4 %), 85 (37.0 %), 134 (58.3 %)
and 121 (52.6 %) markers produced a single fragment in
B. rapa, B. oleracea, B. nigra, B. juncea and B. carinata,
respectively. Another 77 (33.5 %), 47 (20.4 %), 41 (17.8 %),
36 (15.6 %), and 41 (17.8 %) markers produced two
fragments in B. rapa, B. oleracea, B. nigra, B. juncea and
B. carinata, respectively, and 20 (8.7 %), 24 (10.4 %), 25
(10.9 %), 19 (8.3 %) and 23 (10 %) amplified three or
more fragments in B. rapa, B. oleracea, B. nigra, B. juncea
and B. carinata, respectively. The remaining 15 (6.5 %),
34 (14.8 %), 79 (34.3 %), 41 (17.8 %), and 45 (19.6 %)
markers did not have any amplification in B. rapa,
B. oleracea, B. nigra, B. juncea and B. carinata, respectively.
Theor Appl Genet
123
8. In total, 213 markers (92.6 %) could amplify single
amplicons in at least one of the species. Of these, 21
markers amplified single amplicon in all of the five species,
32 markers amplified a single fragment in all three diploid
species, and 65 markers could amplify single amplicon in
both B. juncea and B. carinata (Fig. 2; Supplemental Table
S4). In summary, these SSR markers producing single
amplicon in each species could be identified as putative
single-locus.
After observing the single-locus pattern of the 230 SSR
markers in B. napus (AACC), we tested their amplification
behavior in B. rapa (AA) and B. oleracea (CC). Of these,
181 markers (78.7 %) successfully amplified in both pro-
genitor genomes A and C, indicating that most of the
single-locus SSR markers are not genome specific. We also
observed that 34 (14.8 %) markers mapped in the A gen-
ome of B. napus were unique to B. rapa (AA). Further-
more, 27 out of these 34 markers were also unique to
B. juncea (AABB). While 15 markers (6.5 %) mapped in C
genome of B. napus were unique to B. oleracea (CC) and
13 out of these 15 markers were also unique to B. carinata
(BBCC) (Supplemental Table S4).
Table 3 continued
Marker LG_location (cM) Inbred lines Hybrids
No. of observationa
Ho
b
Alleles PICc
No. of observation Ho Alleles PIC
BoGMS1740 C3_52.439 41 0.07 4 0.50 43 0.35 3 0.38
BRAS087 C3_83.742 42 0.00 3 0.57 43 0.91 2 0.37
BoGMS1746 C3_88.693 44 0.00 2 0.08 45 0.02 2 0.02
BnGMS0002 C3_135.961 42 0.02 4 0.32 44 0.57 3 0.41
Na12-D09 C4_0 45 0.00 6 0.73 39 0.46 6 0.68
BoGMS0573 C4_11.949 42 0.00 2 0.37 42 0.12 3 0.46
BRAS021 C4_23.483 45 0.20 2 0.36 44 0.43 2 0.30
BoGMS1764 C4_35.874 44 0.00 2 0.36 45 0.36 2 0.31
BoGMS0836 C4_42.616 45 0.02 5 0.48 45 0.80 5 0.61
BnGMS0808 C5_57.181 45 0.00 2 0.12 43 0.02 2 0.02
BoGMS2256 C6_8.082 45 0.00 2 0.04 43 0.16 2 0.14
BoGMS1909 C6_14.642 43 0.12 4 0.57 43 0.58 3 0.49
BoGMS1747 C6_19.102 45 0.00 3 0.48 45 0.38 2 0.36
BnGMS0968 C6_63.2 45 0.00 2 0.30 45 0.11 2 0.10
BoGMS3309 C6_82.71 45 0.00 2 0.12 44 0.02 2 0.02
BoGMS1218 C6_86.415 44 0.18 4 0.23 39 0.46 2 0.29
BoGMS2992 C6_96.29 45 0.00 2 0.29 43 0.02 2 0.02
BoGMS1697 C6_97.171 44 0.05 3 0.57 45 0.56 3 0.39
BrGMS0753 C6_115.309 40 0.00 3 0.40 41 0.24 2 0.37
BoGMS2499 C7_74.688 45 0.00 2 0.36 44 0.80 2 0.37
BoGMS2095 C7_96.37 45 0.02 2 0.32 45 0.47 2 0.32
BnEMS0020 C8_34.225 45 0.00 2 0.37 45 0.58 2 0.37
BoGMS1795 C8_56.398 41 0.15 3 0.36 43 0.40 3 0.37
BoGMS1145 C8_89.613 45 0.00 3 0.40 45 0.49 2 0.34
BoGMS3432 C8_99.281 44 0.02 2 0.31 43 0.37 2 0.26
BoGMS1283 C9_0 45 0.07 2 0.24 45 0.22 2 0.18
BoGMS3608 C9_10.69 45 0.02 2 0.31 44 0.25 2 0.31
BoGMS1287 C9_50.978 45 0.00 2 0.12 43 0.02 2 0.02
BoGMS1567 C9_64.415 45 0.00 2 0.27 45 0.49 2 0.33
BoGMS3139 C9_75.793 43 0.23 3 0.43 39 0.56 2 0.37
BoGMS2477 C9_79.929 39 0.00 2 0.13 35 0.00 2 0.05
Average 0.04 3.23 0.41 0.41 3.01 0.37
a
The No. of observation for a marker is defined as the number of cultivars with nonmissing genotypes observed in the population
b
Observed heterozygosity
c
Polymorphism information content
Theor Appl Genet
123
9. Discussion
SSR markers are useful tools for gene/QTL mapping,
marker-assisted selection and diversity analysis. In simple
diploid species like rice and barley, most SSR markers are
single-locus and thus usually amplify a maximum of two
alleles per marker in diverse varieties and segregating
populations such as F2 and BC1. Unfortunately, in allote-
traploid B. napus, the use of SSR markers is generally not
as straightforward as in diploids because most SSR markers
are multi-locus and amplify multiple alleles from homo-
eologous loci. Therefore, assigning alleles to distinct loci is
a great challenge in B. napus. In the present study, we
developed a set of 230 high-quality single-locus SSRs from
a total of 9,858 SSR markers. These single-locus SSR
markers were firstly selected based on their amplification
fashion in six rapeseed inbred lines. Then these markers
were confirmed to be genuine single-locus using a DH
mapping population with 154 lines. The major advantage
of DH populations is that every individual is homozygous
for the two alleles of a single-locus SSR marker. Further-
more, a diverse set of 45 inbred lines and 45 hybrids was
selected to validate the single-locus nature of 78 repre-
sentative SSR markers. These SSR markers presented
either in both B. rapa and B. oleracea genomes or only in
B. rapa or B. oleracea genome (Supplemental Table S4)
and distributed across each chromosome of B. napus gen-
ome. All the 78 markers detected at most two alleles in this
diverse set of rapeseed varieties. Of these, about half (36)
had a Ho value of 0 in the diverse set of inbred lines,
indicating that at least 50 % of these markers were
unambiguous single-locus. By combining amplification of
six rapeseed varieties, segregation analysis in a segregating
DH populations and validation with a diverse set of inbred
lines and hybrids, we believe that most of the 230 SSR
markers, if not all, were confirmed to be true single-locus
in B. napus. It is worth noting that nine out of 78 markers
(11.5 %) detected a Ho value higher than 0.10 in the inbred
lines, which might be caused by pollen contamination in
selfing. However, we could not exclude the possibility that
some of the markers are not true single-locus, and suggest
researchers further test these markers in a more diverse
germplasm in their own studies.
Genetic diversity analysis and cultivar fingerprinting or
identification are important aspects in germplasm collection
and evaluation and in protection of a commercial variety
(Chen et al. 2008). Ideal markers for diversity analysis and
DNA fingerprinting should have the following features:
(1) high-quality single-locus markers with reasonable
polymorphism; (2) easily amplified and highly reproduc-
ible; (3) thoroughly distributed across the whole genome
and (4) appropriate spacing between adjacent alleles
(Cipriani et al. 2008; Ghislain et al. 2004; Varshney et al.
2008; Wang et al. 2011b). Core sets of SSR markers had
been developed for diversity analysis and cultivar dis-
crimination in plants such as potato, barley, maize and
grape (Cipriani et al. 2008; Ghislain et al. 2004; Varshney
et al. 2008; Wang et al. 2011b). In this study, the 230 single-
locus SSR markers satisfied the above strict criteria, and
thus will be very useful in rapeseed cultivar identification,
diversity analysis and subsequent association mapping.
Cross-species amplification would bring similar advan-
tages to species without single-locus SSR markers. When
analyzed in other Brassica species in the U’s triangle, these
single-locus SSR markers demonstrated a high degree of
universality in the three diploids and other two allotetrap-
loids. Therefore, these markers would be also helpful for
more accurate comparative studies of genome changes
between species. Although the single-locus SSR markers
were developed from the A or C genome, 85 markers could
amplify a single fragment and 66 amplified two or more
fragments in B. nigra (B genome). This result indicates that
there is high homology between the B and A genomes, and
between the B and C genomes. Meanwhile there were also
79 markers that could not amplify in B. nigra, which was
Table 4 Amplification of the 230 SSR markers in other Brassica
species of the U’s triangle except B. napus
Species Single
amplicon
(%)
Two
amplicons
(%)
C Three
amplicons
(%)
No
product
(%)
B. rapa 118 (51.3) 77 (33.5) 20 (8.7) 15 (6.5)
B. oleracea 125 (54.3) 47 (20.4) 24 (10.4) 34 (14.8)
B. nigra 85 (37.0) 41 (17.8) 25 (10.9) 79 (34.3)
B. juncea 134 (58.3) 36 (15.6) 19 (8.3) 41 (17.8)
B. carinata 121 (52.6) 41 (17.8) 23 (10.0) 45 (19.6)
B. rapa B. oleracea
B. nigra
40
14 22
32
32
17
31
a
B. juncea
B.carinata
56
69
65
b
Fig. 2 Venn diagram displaying amplification patterns of the 230
single-locus SSR markers in a B. rapa, B. oleracea, and B. nigra;
b B. juncea and B. carinata. The numbers in each circle represent the
number of SSR markers that displayed single amplicon in corre-
sponding species
Theor Appl Genet
123
10. much more than the number of non-amplified markers in
B. rapa (15 markers) and B. oleracea (34 markers), indi-
cating that the relationship between the A and C genomes
is much closer than that between the B and A or C genomes
as revealed by molecular phylogenetic and cytogenetic
analyses (Warwick and Black 1991; Xiao et al. 2010). It is
worth noting that 27 markers only had amplification in
the A genome-containing species (B. rapa, B. napus and
B. juncea), suggesting that these markers might be A
genome specific. In addition, 13 markers only had ampli-
fication in the C genome-containing species (B. oleracea,
B. napus and B. carinata), suggesting that these markers
might be C genome specific. These genome-specific
markers would be useful to map and characterize the cor-
responding genome introgression at different generations in
cross-species hybridization (Navabi et al. 2011).
Acknowledgments The research was supported by the National
Natural Science Foundation of China (No. 31071452), the Doctoral
Fund of Ministry of Education of China (No. 20100146110019) and
the Huazhong Agricultural University Scientific & Technological
Self-innovation Foundation (No. 2011SC04). The authors are grateful
to Drs. Chaozhi Ma, Jun Zou and Cheng Cui for providing cultivar
information and DNA samples.
References
Botstein D, White RL, Skolnick M, Davis RW (1980) Construction of
a genetic linkage map in man using restriction fragment length
polymorphisms. Am J Hum Genet 32:314–331
Cavell A, Lydiate D, Parkin I, Dean C, Trick M (1998) Collinearity
between a 30-centimorgan segment of Arabidopsis thaliana
chromosome 4 and duplicated regions within the Brassica napus
genome. Genome 41:62–69
Chen S, Nelson M, Ghamkhar K, Fu T, Cowling W (2008) Divergent
patterns of allelic diversity from similar origins: the case of
oilseed rape (Brassica napus L.) in China and Australia. Genome
51:1–10
Cheng X, Xu J, Xia S, Gu J, Yang Y, Fu J, Qian X, Zhang S, Wu J,
Liu K (2009) Development and genetic mapping of microsat-
ellite markers from genome survey sequences in Brassica napus.
Theor Appl Genet 118:1121–1131
Cheung F, Trick M, Drou N, Lim Y, Park J, Kwon S, Kim J, Scott R,
Pires J, Paterson A (2009) Comparative analysis between
homoeologous genome segments of Brassica napus and its
progenitor species reveals extensive sequence-level divergence.
Plant Cell 21:1912–1928
Choi S, Teakle G, Plaha P, Kim J, Allender C, Beynon E, Piao Z,
Soengas P, Han T, King G (2007) The reference genetic linkage
map for the multinational Brassica rapa genome sequencing
project. Theor Appl Genet 115:777–792
Cipriani G, Marrazzo M, Di Gaspero G, Pfeiffer A, Morgante M,
Testolin R (2008) A set of microsatellite markers with long core
repeat optimized for grape (Vitis spp.) genotyping. BMC Plant
Biol 8:127
Comadran J, Thomas WTB, Van Eeuwijk F, Ceccarelli S, Grando S,
Stanca A, Pecchioni N, Akar T, Al-Yassin A, Benbelkacem A
(2009) Patterns of genetic diversity and linkage disequilibrium in
a highly structured Hordeum vulgare association-mapping
population for the Mediterranean basin. Theor Appl Genet 119:
175–187
Ghislain M, Spooner DM, Rodrı´guez F, Villamo´n F, Nu´n˜ez J,
Va´squez C, Waugh R, Bonierbale M (2004) Selection of highly
informative and user-friendly microsatellites (SSRs) for geno-
typing of cultivated potato. Theor Appl Genet 108:881–890
Guichoux E, Lagache L, Wagner S, Chaumeil P, Le´ger P, Lepais O,
Lepoittevin C, Malausa T, Revardel E, Salin F (2011) Current
trends in microsatellite genotyping. Mol Ecol Res 11:591–611
Iniguez-Luy F, Voort A, Osborn T (2008) Development of a set of
public SSR markers derived from genomic sequence of a rapid
cycling Brassica oleracea L. genotype. Theor Appl Genet 117:
977–985
Jin L, Lu Y, Xiao P, Sun M, Corke H, Bao J (2010) Genetic diversity
and population structure of a diverse set of rice germplasm for
association mapping. Thero Appl Genet 121:475–487
Kaur S, Cogan NOI, Ye G, Baillie R, Hand M, Ling A, Mcgearey A,
Kaur J, Hopkins C, Todorovic M (2009) Genetic map construc-
tion and QTL mapping of resistance to blackleg (Leptosphaeria
maculans) disease in Australian canola (Brassica napus L.)
cultivars. Thero Appl Genet 120:71–83
Kim H, Choi S, Bae J, Hong C, Lee S, Hossain M, Van Nguyen D, Jin
M, Park B, Bang J (2009) Sequenced BAC anchored reference
genetic map that reconciles the ten individual chromosomes of
Brassica rapa. BMC genomics 10:432
Kosambi D (1944) The estimation of map distance from recombina-
tion values. Ann Eugen 12:172–175
Lagercrantz U, Putterill J, Coupland G, Lydiate D (1996) Compar-
ative mapping in Arabidopsis and Brassica, fine scale genome
collinearity and congruence of genes controlling flowering time.
Plant J 9:13–20
Li H, Chen X, Yang Y, Xu J, Gu J, Fu J, Qian X, Zhang S, Wu J, Liu
K (2011) Development and genetic mapping of microsatellite
markers from whole genome shotgun sequences in Brassica
oleracea. Mol Breed 28:585–596
Ling A, Kaur J, Burgess B, Hand M, Hopkins C, Li X, Love C, Vardy
M, Walkiewicz M, Spangenberg G (2007) Characterization of
simple sequence repeat markers derived in silico from Brassica
rapa bacterial artificial chromosome sequences and their appli-
cation in Brassica napus. Mol Ecol Notes 7:273–277
Liu K, Muse SV (2005) PowerMarker: an integrated analysis
environment for genetic marker analysis. Bioinformatics 21:
2128–2129
Lowe A, Moule C, Trick M, Edwards K (2004) Efficient large-scale
development of microsatellites for marker and mapping appli-
cations in Brassica crop species. Theor Appl Genet 108:1103–
1112
Navabi ZK, Stead KE, Pires JC, Xiong Z, Sharpe AG, Parkin IAP,
Rahman MH, Good AG (2011) Analysis of B-Genome Chro-
mosome Introgression in Interspecific Hybrids of Brassica
napus 9 B. carinata. Genetics 187:659–673
Parida S, Yadava D, Mohapatra T (2010) Microsatellites in Brassica
unigenes: relative abundance, marker design, and use in
comparative physical mapping and genome analysis. Genome
53:55–67
Parkin I, Gulden S, Sharpe A, Lukens L, Trick M, Osborn T, Lydiate
D (2005) Segmental structure of the Brassica napus genome
based on comparative analysis with Arabidopsis thaliana.
Genetics 171:765–781
Piquemal J, Cinquin E, Couton F, Rondeau C, Seignoret E, Doucet I,
Perret D, Villeger M, Vincourt P, Blanchard P (2005) Construc-
tion of an oilseed rape (Brassica napus L.) genetic map with SSR
markers. Theor Appl Genet 111:1514–1523
Sadowski J, Gaubier P, Delseny M, Quiros C (1996) Genetic and
physical mapping in Brassica diploid species of a gene cluster
defined in Arabidopsis thaliana. Mol Gen Genet 251:298–306
Theor Appl Genet
123
11. Stich B,Melchinger AE, Frisch M, MaurerHP, HeckenbergerM, Reif JC
(2005) Linkage disequilibrium in European elite maize germplasm
investigated with SSRs. Thero Appl Genet 111:723–730
Suwabe K, Morgan C, Bancroft I (2008) Integration of Brassica A
genome genetic linkage map between Brassica napus and
B. rapa. Genome 51:169–176
Tamura K, Dudley J, Nei M, Kumar S (2007) MEGA4: molecular
evolutionary genetics analysis (MEGA) software version 4.0.
Mol Biol Evol 24:1596–1599
Town C, Cheung F, Maiti R, Crabtree J, Haas B, Wortman J, Hine E,
Althoff R, Arbogast T, Tallon L (2006) Comparative genomics
of Brassica oleracea and Arabidopsis thaliana reveal gene
loss, fragmentation, and dispersal after polyploidy. Plant Cell
18:1348–1359
U N (1935) Genome analysis in Brassica with special reference to the
experimental formation of B. napus and peculiar mode of
fertilization. Jpn J Bot 7:389–452
Van Ooijen JW, Voorrips RE (2001) JoinMapÒ
3.0. Software for the
calculation of genetic linkage maps. Plant Research Interna-
tional, Wageningen
Varshney R, Thiel T, Sretenovic-Rajicic T, Baum M, Valkoun J,
Guo P, Grando S, Ceccarelli S, Graner A (2008) Identification
and validation of a core set of informative genic SSR and SNP
markers for assaying functional diversity in barley. Mol Breed
22:1–13
Wang F, Wang X, Chen X, Xiao Y, Li H, Zhang S, Xu J, Fu J, Huang
L, Wu J, Liu K (2011a) Abundance, marker development and
genetic mapping of microsatellites from unigenes in Brassica
napus. Mol Breed. doi:10.1007/s11032-011-9658-7
Wang FG, Tian HL, Zhao JR, Yi HM, Wang L, Song W (2011b)
Development and characterization of a core set of SSR markers
for fingerprinting analysis of Chinese maize varieties. Maydica
56:7–18
Warwick S, Black L (1991) Molecular systematics of Brassica and
allied genera (subtribe Brassicinae, Brassiceae)—chloroplast
genome and cytodeme congruence. Theor Appl Genet 82:81–92
Xiao S, Xu J, Li Y, Zhang L, Shi S, Wu J, Liu K (2007) Generation
and mapping of SCAR and CAPS markers linked to the seed
coat color gene in Brassica napus using a genome-walking
technique. Genome 50:611–618
Xiao Y, Chen L, Zou J, Tian E, Xia W, Meng J (2010) Development of
a population for substantial new type Brassica napus diversified
at both A/C genomes. Theor Appl Genet 121:1141–1150
Xiao Y, Cai D, Yang W, Ye W, Younas M, Wu J, Liu K (2012)
Genetic structure and linkage disequilibrium pattern of a
rapeseed (Brassica napus L.) association mapping panel
revealed by microsatellites. Theor Appl Genet. doi:10.1007/s
00122-012-1843-5
Xu J, Qian X, Wang X, Li R, Cheng X, Yang Y, Fu J, Zhang S, King
G, Wu J (2010) Construction of an integrated genetic linkage
map for the A genome of Brassica napus using SSR markers
derived from sequenced BACs in B. rapa. BMC genomics
11:594
Theor Appl Genet
123