Javellana.IPO.2011.The Trends on Global Warming.Javellana.final2
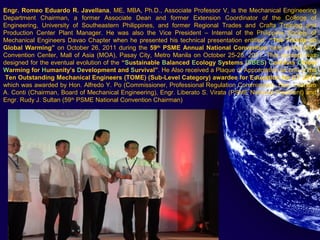
1. Engr. Romeo Eduardo R. Javellana, ME, MBA, Ph.D., Associate Professor V, is the Mechanical Engineering
Department Chairman, a former Associate Dean and former Extension Coordinator of the College of
Engineering, University of Southeastern Philippines, and former Regional Trades and Crafts Training and
Production Center Plant Manager. He was also the Vice President – Internal of the Philippine Society of
Mechanical Engineers Davao Chapter when he presented his technical presentation entitled: “The Trends on
Global Warming” on October 26, 2011 during the 59th
PSME Annual National Convention held at the SMX
Convention Center, Mall of Asia (MOA), Pasay City, Metro Manila on October 25-28, 2011. This concept was
designed for the eventual evolution of the “Sustainable Balanced Ecology Systems (SBES) Contains Global
Warming for Humanity’s Development and Survival”. He Also received a Plaque of Appreciation as one of the
Ten Outstanding Mechanical Engineers (TOME) (Sub-Level Category) awardee for Education for CY 2011
which was awarded by Hon. Alfredo Y. Po (Commissioner, Professional Regulation Commission), Hon. Leandro
A. Conti (Chairman, Board of Mechanical Engineering), Engr. Liberato S. Virata (PSME National President) and
Engr. Rudy J. Sultan (59th
PSME National Convention Chairman)
3. Republic of the Philippines
THE NATIONAL LIBRARY OF THE PHILIPPINES AND THE INTELLECTUAL PROPERTY OFFICE
OF THE PHILIPPINES
Research on
THE TRENDS ON GLOBAL WARMING
Certificate of Copyright Registration and Deposit
Registration No. B-2014-00420
Class B (Journal)
4. Republic of the Philippines
THE NATIONAL LIBRARY OF THE PHILIPPINES AND THE INTELLECTUAL PROPERTY OFFICE
OF THE PHILIPPINES
Research on
THE TRENDS ON GLOBAL WARMING
Certificate of Copyright Registration and Deposit
Registration No. C-2014-00421
Class C (Lecture)
5. The Trends onThe Trends on
Global WarmingGlobal Warming
Engr. Romeo Eduardo R. Javellana, ME, MBA, Ph.D.
Chairman, Mechanical Engineering Department
College of Engineering
University of Southeastern Philippines
Vice President – Internal, PSME Davao Chapter
Secretary, Davao Inventors Association (DIA)
Vice President, Mindanao Inventors Federation, Inc. (MIFI)
Philippine Society of Mechanical Engineers
59th
PSME ANNUAL NATIONAL CONVENTION
SMX Convention Center, Pasay City
October 25-28, 2011
7. Abstract
Man has been continuously searching for the
meaning of the truth about himself and his very
existence. He has tried to tame nature to suit
his needs. At times, he has even tried to
challenge God, the Creator, which almost led
him to his very own extinction like in the biblical
histories of Noah and Sodom and Gomorrah.
The great flood almost exterminated the evil
human race during Noah’s time while the
heavenly fire destroyed the sinful cities of
Sodom and Gomorrah.
8. In his never ceasing quest for mastery of his
environment to solve his basic and other needs,
he tried to use whatever scientific, social,
economic, political, physical and other
knowledge available to solve his problems,
issues and concerns. In the process, he was
able to destroy many of his ecology systems
that was the one that has been protecting him
for eons of years. The continuous depletion of
the oxygen supply in the ecosystem, the
thinning of the earth’s ozone layer, the
indiscriminate throwing of wastes and garbage
to the environment, the release of the
poisonous
9. substances in the land, sea and air, the creation
of nuclear fallout from nuclear tests, denudation
of virgin forests, the release of greenhouse
gases to the environment which hastens global
warming, production of dangerous chemicals,
etc. is now challenging his very own existence.
The survival of the human race in the
forthcoming millennium, therefore, lies in how
humanity can be able to effectively and
efficiently balance the utilization of his ecology
systems without unnecessarily destroying it
irreparably in the future. All of us, and the rest of
humanity, has to act now for our continued
existence and survival before it is too late.
10. Man has to protect his ecological systems in
order for him to survive and perpetuate his
race. Failure to do so could eventually lead to
his extinction like the dinosaurs of the previous
hundreds of million years era which
disappeared due to the ice age. Perhaps a
global warming may be a probable thing to
watch and to be wary about in the future, or
maybe to another ice age which may still
happen again if humanity is not too careful.
11. Introduction
The Milky Way Galaxy
The Solar System is located in the Orion’s arm and is revolving
around the Milky Way Galaxy as can be shown below.
13. EARTH: OUR HOME PLANET
From the perspective we get on Earth, our planet
appears to be big and sturdy with an endless ocean of
air. From space, astronauts often get the impression that
the Earth is small with a thin, fragile layer of atmosphere.
For a space traveler, the distinguishing Earth features
are the blue waters, brown and green land masses and
white clouds set against a black background.
Many dream of traveling in space and viewing the
wonders of the universe. In reality all of us are space
travelers. Our spaceship is the planet Earth, traveling at
the speed of 108,000 kilometers (67,000 miles) an hour.
15. Causes of Seasons
• ......PSME Seminars 201159th
PSME 2011 Annual National
Convention59th PSME 2011 Annual
National Convention Final
Presentationwatch.htm
18. THE EARTH’S CRUST
The crust covers the mantle and is the earth's hard outer
shell, the surface on which we are living. Compared to the
other layers the crust is much thinner. It floats upon the
softer, denser mantle. The crust is made up of solid
material but this material is not the same everywhere.
There is an Oceanic crust and a Continental crust. The first
one is about 4-7 miles (6-11 km) thick and mainly consists
of heavy rocks, like basalt. The Continental crust is thicker
than the Oceanic crust, about 19 miles (30 km) thick. It is
mainly made up of light material like granite.
19. CRUST COMPOSITION
The crust consists of two parts: the oceanic and the
continental crust:
•Oceanic crust:
As the name already suggests, this crust is below
the oceans. There, the crust is 4-7 miles (6-11 km) thick.
The rocks of the oceanic crust are very young compared
with the rocks of the continental crust. The rocks of the
oceanic crust are not older than 200 million years. The
material of which the oceanic crust consists is for the
greater part tholeiitic basalt (this is basalt without olivine).
Basalt has a dark, fine and gritty volcanic structure. It is
formed out of very liquid lava, which cools off quickly. The
grains are so small that they are only visible under a
microscope. The average density of the oceanic crust is
3g/cm³.
20. CRUST COMPOSITION
• Continental crust:
When you look at the globe, you see that the surface of
the earth consists of a lot of water (71%). The other 29%
consists of land. You can divide this land into six big
pieces, which are called continents. The different
continents - arranged in decreasing order of size - are:
Eurasia (Europe and Asia together), Africa, North-
America, South-America, Antarctica and Australia. In the
past the division of the continents was different (see
plate tectonic). The earth's crust is the thickest below the
continents, with an average of about 20 to 25 miles (30
to 40 km) and with a maximum of 45 miles (70 km). The
continental crust is older than the oceanic crust, some
rocks are 3.8 billion years old. The continental crust
21. CRUST COMPOSITION
mainly consists of igneous rocks and is divided into two
layers. The upper part mainly consists of granite rocks,
while the lower part consists of basalt and diorite.
Granite is lightly-colored, coarse-grain, magma. Diorite
has the same composition, but it's scarcer than granite
and is probably formed by impurities in the granite-
magma. The average density of the continental crust is
2.7g/cm³.
The crust itself has no influence on the earth, but the
constant moving of the crust does. This moving is
caused by the influence of the convection current, or to
be more precise, this convection current actually causes
the earth
22. CRUST COMPOSITION
plates to move and sometimes touch each other. These
movements cause earthquakes and at weak parts of the
earth's crust volcanoes can erupt. Because of all these
ongoing movements in the last millions of years, mountains
and valleys have been formed, and that’s why the surface
of the earth looks as it is now. The form of the surface of
the earth has its daily influence on the way people live and
work. An example: the building of houses. When you build
a house in the mountains, you build it in an other way than
on flat land. In the mountains the bottom is more solid than
on flat land. Volcanoes and earthquakes also have their
direct influence on the people who live near places where
they occur. It destroys their houses and many times people
are killed or wounded.
23.
24.
25.
26. Flash Flood in Davao City, Philippines last June 28, 2011 Flood in Matina
Crossing, Balusong, NHA and Matina Pangi after an 8 mm rain for a 3-hour
duration. This is not the first time that the river has overflowed but it is the first
time that it overflowed in all 4 areas and the water level was quite high. It's
more than 10 feet in some parts and in some, up to 20 feet and affected more
than 25,000 people caused by the intertropical convergence zone (ITCZ).
38. “There is no doubt in
my mind that climate
change is one of the
greatest threats facing
humanity today.”
Markku Niskala
Secretary-General of the
Red Cross
January 2008
The Greatest Threat
Tony
Weyiouanna, Sr. photo
39. “Things are getting
desperate enough
now that we need to
throw away our
conservatism and
just act.”
Dr. Terry Chapin, UAF
The Greatest Threat
Photo: Corel Corp., Courtesy of www.exzooberance com
43. Temperature Measurements
“Warming of the
climate system is
UNEQUIVOCAL”
(IPCC 2007)
Top 11 warmest
years on record have
all occurred in the last
12 years
(IPCC 2007)
2006 was warmest
year on record
in continental US
(NOAA 1/07)
2007 was warmest
year on record
in North America
(NOAA 1/08)
2008 eighth warmest
.
44. Pollution is the Primary Cause
What contributes to global warming?
Primarily CO2
Global Warming Basics
45. What do these pollutants do? – Global Fever
Greenhouse gases make the earth too hot, just like:
> sleeping under a heavy blanket in the summertime
> wearing a parka that is too thick
Our atmospheric “blanket” or “parka” is over 37% “thicker”
than it used to be
Thicker blanket
traps too
much heat.
Thinner blanket
is “just right.”
Global Warming Basics
52. Other Factors:
1) Albedo effect
2) More energy goes directly into warming
than into evaporation
3) Atmosphere layer is thinner
in the Arctic
4) Increased heat transfer from
oceans as sea ice retreats
5) Alterations in atmospheric
and ocean circulationACIA Graphic
Why has Alaska warmed the most?
Global Warming Basics
(ACIA 2004)
55. The Ice Cap in September
Impacts in Alaska
1. Melting
The Ice Cap in September 2007
Impacts in Alaska
1. Melting
Sea Ice edge
Sep. 16, 2007
September
median ice edge
1979-2000
New minimum:
1.59 million square miles
(4.13 million square km)
Previous minimum:
2.05 million square miles
(2005)
Average minimum:
2.60 million square miles
(1979 – 2000)
1 million square miles is an
area roughly the size of Alaska
and Texas combined, or ten
United Kingdoms (NSIDC
2007)
56. Melting Sea Ice: Sept. 2008
Impacts in Alaska
1. Melting
NSIDC
Arctic sea ice extent reached annual low on September 12, 2008:
The second-lowest level ever
33% less than average minimum from 1979-2000
58. Melting Sea Ice
Impacts in Alaska
1. Melting
Arctic winter ice 2008: Loss of older,
thicker (12 – 15 ft) ice
Old ice (6+ years) has declined from
over 20% to about 6%
Over 70% of ice is first-year
NSIDC
(2008)
59. Impacts in Alaska
1. Melting
Alaska has lost 400 billion tons of land ice
since 2003 (NASA 12/08)
Bering Glacier, representing more than
15% of all the ice in Alaska, is melting
twice as fast as previously believed,
releasing approximately 8 trillion gallons
of water per year into the ocean -- or the
equivalent of two Colorado Rivers
(Michigan Tech Research
Institute, 5/07)
The rapid retreat of Alaska’s glaciers
represents 50% of the estimated mass
loss by glaciers through 2004 worldwide
(ACIA 2004)
Loss of over 588 billion cubic yards from
1961 to 1998 (Climate Change 11/05)
1941
2004
USGS photo
Bruce Molnia photo
Glacial Retreat
2003
MattNolanphotoAustinPostphoto
1958
McCall Glacier
60. Impacts in Alaska
1. Melting
Glacial Retreat
Alaska’s Columbia Glacier
has decreased by about 9
miles since 1980 and thinned
by as much as 1,300 feet
(Science 7/07)
Gulf of Alaska Glaciers losing
84 gigatons of ice mass
annually, contributing nearly
half as much freshwater melt as
Greenlnad and 15% of present
day global sea level rise from
melting ice (NASA 2008)
61. Permafrost Thawing
“All the Observatories show a
substantial warming during
the last 20 years”, causing
permafrost to melt at an
unprecedented rate. (State of the
Arctic 2006)
Impacts in Alaska
1. Melting
Damage to infrastructure,
lakes, rivers, and forests
Rising sea levels
Release of stored carbon
(methane and CO2)
Consequences:
Vladimir Romanovsky photo
NSIDC
Osterkamp and Romanovsky
Deadhorse
West Dock
z
DEPTH
| | | | | | |
|
-8 -7 -6 -5 -4
-3 -2 -1o
C
TEMPERATURE
Soil Temperatures at
Franklin Bluffs
0
1m
Avera
ge
1987-
2003
1987 2003
62. • Polar bears
• Walruses
• Black guillemots
• Arctic grayling
• Kittiwakes
• Ice seals
• Salmon
• Caribou
Impacts in Alaska
3. Animals
Animals at Risk
Rising temperatures
Shrinking habitat
Food harder to get
Expanding diseases
Competition
67. Brown Bears
Factors of Concern:
Diet impairment: fish and berries (Kenai Brown Bears – fish 90% of diet v.
black bears 10%)
Hibernation disturbances for reproducing females (Jan-May)
2 months to implant
Cub growth
Flooding of dens (Sean Farley, ADF&G, 2007)
Reduction in productivity and survival rates
Impacts in Alaska
2. Animals
following salmon decline in Kuskokwim; additional
research underway
(Steve Kovach, FWS, 2007)
68. Caribou
The Western Arctic Caribou
Herd shrank by 113,000 (more
than 20%) between 2003 and
2007; mid-winter warm spells
may have played a role (AP 5/08)
Since 1989, the Porcupine Caribou
Herd has declined at 3.5% per year
to a low of 123,000 animals
in 2001 (ACIA 2004)
Freezing rain coats lichen
Changing rivers
Less tundra
Impacts in Alaska
2. Animals
69. Dall Sheep
Dall sheep live exclusively in alpine tundra
Due to warmer temperatures, the tree line in
the Kenai Mountains has risen at a
rate of about 1 meter/year over the past 50
years
20% of the tundra above 1,500 ft. has
disappeared, is now shrub or open woodland
(Refuge Notebook 6/07)
“…we’re going to have declining Dall sheep. We’re losing their habitat.”
Dr. John Morton - Kenai National
Wildlife Refuge
Photo: Tim Craig, Wildlife Biologist BLM
Impacts in Alaska
2. Animals
70. Muskoxen
Population in northern Alaska and
Canada declined from approximately
700 to 400 (Pat Reynolds, FWS, 2007)
Risk Factors:
• Icing events
• Lower calf production
• Deeper snow
• Not highly mobile
• Increase in disease (e.g. nematode
lungworm, able to complete life
cycle in 1 year v. 2 years)
(Kutz et al., 2004)
Impacts in Alaska
2. Animals
72. Alaska Waterfowl
Hatch dates have advanced 5 - 10 days since
1982 in all 5 species studied in Yukon Delta NWR
Sea-level rise, increased storm frequency and
intensity, and wetland drying will likely cause
dramatic changes in waterfowl communities
Julien Fischer, Scientist,
USFWS (2007)
Aleutian Cackling Geese White Front Goose on Nest Brandt Geese
Cackling Hatchlings
Impacts in Alaska
2. Animals
73. Migratory Birds -- Scaup
Population appears to be “in peril”
(Consensus Report, 2006)
Declined from over 7 million (in 1970s)
to 3.39 million (2005) (CR)
Record low in 2006: 3.2 million (Ducks
Unlimited)
70% breed in western boreal forest;
Fastest rate of decline there
(94,000 birds per year from 1978 - 2005) …
“Declines reflect breeding season events.” (CR)
19% wetland loss in Yukon Flats
(1985 - 89 v. 2001 - 03)
Where ponds lose 20% or more surface,
scaup food sources decline (i.e. amphipods,
Impacts in Alaska
2. Animals
gastropods and chironomid larvae)
88. Tundra Fires
Impacts in Alaska
3. Wetlands and Forests
Total Tundra Fire Area (Acres) Burned North of 68 deg. North Lat 1956-2007*
0
50
100
150
200
250
1955
1960
1965
1970
1975
1980
1985
1990
1995
2000
2005
ThousandsofAcres
*2007 fire still active as
of 9/21/07
Reported thousands acres burned north of 68o
latitude
from 1950-2007
Alaska Fire Service, 2007
Anaktuvuk River
Fire, 2007
2007 tundra fires:
Record breaking season in AK
Impact on Habitat
89. Invasive Plant Species
Aggressive invader of wetlands,
serious threat to habitat and
species diversity
Requires warm temperatures for
germination (15-20C)
(ADFG)
“Northern limits of distribution
may be strongly influenced by
low growing season
temperature.” (USFS)
Now seen for the first time in
Alaska along Chester Creek
EXAMPLE: Purple Loosestrife
CanadianDeptofAgriculture
Impacts in Alaska
3. Wetlands and Forests
WIDeptNaturalResources
94. Infrastructure
Impacts in Alaska
4. Weather and Storms
“A warming climate will damage Alaska’s infrastructure because it was designed
for a cold climate.” (Larsen and Goldsmith, Institute of Social and Economic
Research, 6/07)
Damage to infrastructure may add $3.6 to $6.1 billion (10% to 20%) to future
costs for public infrastructure from now to 2030 and $5.6 to $7.6 billion (10% to
12%) from now to 2080
Damage will be concentrated in areas of thawing permafrost, flooding, and
eroding coastlines
95. Alaska’s Arctic Coast
Erosion rates
increased from 6.8
meters/year (1955
-1979) to 13.6 m/yr
(2002- 2007)
(Geophysical Research
Letters 2009)
USGS documented
that in the last 50
years, a section of
the Alaska North
Slope coastline has
eroded by as much
as 3,000 ft (0.9 km)
(Geology, 07/07)
Impacts in Alaska
4. Weather and Storms
USGS/Christopher Arp,
96. National Security
Three North American Aerospace Defense Command early-warning
radar sites in Alaska to be shut down due, in part, to erosion
caused by climate change; Point Lonely already closed
(New York
NORAD AK Region
Impacts in Alaska
4. Weather and Storms
97. The Northwest Passage
September 2008:
Northwest Passage &
Northern Sea Route
both open (less than
one-tenth surface ice) for
first time since satellite
observations began
(US National Ice Center)
The Arctic Ice Cap “Island”
Sept. 8, 2008
(NASA)
98. International Bathymetric Chart of the Arctic Ocean
(geology.com)
Ownership Issues
Potential claimants to North
Pole ownership:
Russia
Canada
Denmark (via Greenland)
July 2008 USGS estimate:
13% of undiscovered oil &
30% of undiscovered gas
lie under Arctic seabed
Oil & gas recovery possible –
But at what
environmental & human
costs?
No one owns the North Pole – Yet
99. Maritime Jurisdiction & Boundaries
International Boundaries Research Unit, Durham University
www.durham.ac.uk/ibru
Staking Claims: The First Map (Aug. 2008)
Countries that control
Arctic coastline:
United States
Canada
Russia
Norway
Denmark (Greenland)
Each allowed 200-mile
economic zone beyond
shoreline – or
continental shelf, if
geologically related
May 2008:
5 Arctic states
agree that UN
101. Impacts in Alaska
5. Human Impacts
Photo: Environment Canada
Photo: Tony Weyiouanna, Sr.
Human Impacts
“All of these villages have lost people on
the ice. When you have a small village of
300 or 400 people, losing three or four of
their senior hunters, it’s a big loss. A lot
of the elders will no longer go out on the
sea ice because their knowledge will not
work anymore. What they’ve learned and
passed on for 5,000 years is no longer
functional.”
Will Steger
Founder, globalwarming101.org
“Due to unusual ice conditions, one of
our young local hunters lost his life,
which has not occurred in our
community in my lifetime.”
Fannie Weyiouanna, Shishmaref
102. If we fail to act, and CO2 keeps rising at the current rate, then
a new modeling study predicts that:
If we do not Act: Worst Case
Predicted
Temperature
Increase
Average temperatures in
many parts of northern
North America will rise
more than 25o
F by 2100
Arctic tundra will decline
from 8% to 1.8% of the
world’s land area, and
Alaska will lose almost all of
its evergreen boreal forests
Extinctions and profound
disruptions will ensue
_
_
_
_
_
+5
+10
+15
+20
+25o
F
(Govindasamy and Caldeira,
2005)
Impacts in Alaska
5. Human Impacts
104. Adaptation: Not always possible
Adaptation
3. Extinctions
Adaptation is critical but not sufficient.
ADCED
NMML
If global warming emissions continue
to increase, irreplaceable elements of
our natural and cultural heritage will be
lost forever.
107. Ocean Acidification
Since 1850, ocean
pH has decreased
by about 0.1 unit:
a 30% increase
in acidity
(Royal Society
2006)
At present rate of
CO2 emission,
acidity predicted to
increase by 0.4
units: a 3-fold
increase in H ions
by 2100
Carbonate ion
concentrations
Historical and Projected pH and
Dissolved CO2
pH
Dissolved
CO2
Lower pH = MORE ACID
1850 2000 2100
Global Cataclysmic Concerns
Feely, Sabine and
Historical and Projected pH and
Dissolved CO2
1850 2000 2100
Historical and Projected pH and
Dissolved CO2
1850 2000 2100
111. Coral Bleaching
Corals damaged by higher water temperatures and acidification
Higher water temperatures cause bleaching: corals expel
zooxanthellae algae
Corals need the algae for nutrition
Healthy staghorn coral Bleached staghorn coral (algae expelled)
Global Cataclysmic Concerns
113. International Health Impacts
Increased epidemics of malaria in Africa;
new cases in Turkey and elsewhere
Increased cerebral-cardiovascular
conditions in China
Increased heat wave deaths on Europe
(52,000 in 2003), typhoid fever, Vibrio
vulnificus, Ostreopsis ovata, Congo Crimea
hemorrhagic fever
Dengue fever in SE Asia
More mercury release, flooding, storms
WHO: 150,000 deaths and 5 million
illnesses per year attributable to global
warming; numbers expected to double
by 2030 (Nature, 2005)
Global Cataclysmic Concerns
114. Inundation
Sea level has increased 3.1 mm/year
from 1993 – 2003 (IPCC, 2007)
This is 10 - 20 times faster than
during the last 3,000 years (ACIA,
2004)
7 – 23 inches by 2099 (IPCC 2007)
Not less than 20”, could exceed 39”
by 2099 (Copenhagen 2009)
4 - 6 meters of sea level rise locked
in by 2100 if 3 times pre-industrial
CO2 or 1% increase/year
(Overpeck et al., 2006)
Global Cataclysmic Concerns
115. Inundation
Inundation from Four Meter Sea Level Rise (or 1m rise + 3m storm surge)
Weiss and Overpeck, 2006
Global Cataclysmic Concerns
124. Measuring Your Carbon Footprint
Major Carbon Contributors:
Electric consumption
Gas/heating oil
consumption
Car and miles driven
Miles flown
ORV use
Average Alaskan Carbon
Footprint = 32,000 pounds
www.alaskaconservationso
lutions.com
What We Can Do
125. Transportation’s Contribution
Motor vehicle emissions represent 31% of total carbon dioxide and
49% of nitrogen oxides released in the U.S. (The Green Commuter, a
publication of the Clean Air Council)
Global Warming Basics
126. Transportation: Part of the Solution
The Big 3
1. Reduce vehicle use through
urban planning, trails, mass
transportation and other land
use and transportation policies
(0.2 Gt)
2. Improve vehicle efficiency
3. De-carbonize fuels
“Support smart Transit planning
that prioritizes public transportation,
biking and walking.” (Design to Win,
8/07)
If one million people replaced a
five-mile car trip/week with a bike
ride or walk, CO2 emissions would
be reduced by 100,000 tons/year
What We Can Do
127. Making a Difference as an Individual
Conservation Measures:
Walk, bike, ride public transit,
or carpool
Make sure your tires are fully
inflated and your car tuned up
Lower your water heater and
home thermostats
Don't preheat your oven
Only run your dishwasher with
full loads
Reduce your shower length and
temperature
Buy locally produced food—look for
the Alaska Grown Logo
Unplug appliances not in use
Turn off lights when leaving a room
Use recycled paper
Reuse or recycle as much as you can
Cut down on consumerism
What We Can Do
128. Conservation: Three Examples
Unplug Appliances
Vampires!
43 billion kWH lost/year in U.S.
Estimated savings =
1,000 lbs/year/person
Pump Up Tires
4 million gallon of gas wasted daily
in U.S.
Extends life of tires by 25%
Estimated savings =
1,000 lbs/year/person
Lower Thermostat
2 degrees
OR 6 degrees for 8 hours/day
Estimated savings =
2000 lbs/year/person
What We Can Do
129. Making a Difference as an Individual
Energy Efficiency
Reduce your home’s heat and
energy loses
Replace incandescent lights
with fluorescents
Replace your appliances with
“energy star” rated appliances
Buy a hybrid car
Renewables
Install renewable energy systems:
wind, solar, geothermal, in-stream
hydro
Use biofuels
Carbon Neutral
Carbon offsets – Denali Green Tags
Be Heard!
What We Can Do
130. Getting to Zero
What We Can Do
Renewable Energy
Wind
Solar
Instream hydro
Geothermal
Biofuels
Carbon Offsets
Bonneville Environmental
Foundation (BEF)
Carbon Offsets
NativeEnergy Carbon Offsets
Myclimate/Sustainable Travel
International
Expedia/TerraPass
Other
132. Government Actions
Cap & Trade – Simplified
Company A Company B
100--
50--
0--
Emission Units
The Cap
50% overall reduction
What We Can Do
133. Government Actions
Cap & Trade – Simplified
Company A Company B
100--
50--
0--
Emission Units
The Cap
50% overall reduction
Company A can reduce by 70 units at $10/unit
Company B can reduce by 30 units at $10/unit but
to reduce an additional 20 units would cost
$12/unit
What We Can Do
134. Government Actions
Cap & Trade – The Trade
Company A Company B
100--
50--
0--
Emission Units
The Cap
50% overall reduction
Company A can sell 20 units to Company B
at $11/unit versus paying $12/unit
Total Net Costs =
Without Cap & Trade: $104
With Cap & Trade: $100
What We Can Do
136. "Water resources and climate change are
subjects of great importance for the whole
human family“… [We must] "pray and work for
greater respect for the marvels of divine
creation" (9/07)
Vatican City
The first fully carbon-neutral state
in the world
Has offset its carbon footprint by:
Planting a forest in Hungary
Climate change, abuse of the environment declared
against God's will (4/07)
[We must] "respect creation" while "focusing on the
needs of sustainable development“ (4/07)
Environmental pollution declared a
mortal sin (3/08)
Pope Benedict XVI
The Catholic Church and the
Environment
137. The Costs of Inaction
• Costs of Action (stabilizing at 550 ppm CO2)
= 1% of GDP in 2050
• Costs of Inaction
= 5 - 20% of GDP, now and forever
(10% GDP is central prediction)
What We Can Do
“Measures taken by the world’s governments to
reduce GHG could cost 1% of world economic
output but the cost of not taking those steps would
be at least 5 times as much, hitting the developing
world hardest.”
“If we act now, the economic benefits from efficiency
could pay for necessary supply side measures.”
Nicholas Stern, World Bank
Economist, 2007
The Stern Report:
140. What is global warming and
climate change?
• “A change of climate which is attributed
directly or indirectly to human activity that
alters the composition of the global
atmosphere which is in addition to natural
climate variability observed over a
comparable period of time”
- United Nations Framework Convention on
Climate Change (UNFCCC)
• “Any change in climate over time, whether
due to natural variability or as a result of
human activity.”
- Intergovernmental Panel on Climate Change
(IPCC)
142. Climate Weather
Average weather over a
long period
Influenced by slow
changes in the ocean,
the land, the orbit of
the Earth about the
sun, and the energy
output of the sun
Fundamentally
controlled by the
balance of energy of
the Earth and its
atmosphere
Daily conditions,
including temperature
and rainfall
Can change very
rapidly from day to
day, and from year to
year.
Changes involve shifts
in temperatures,
precipitation, winds,
and clouds.
147. Forests and flooding
At its root, the flood equation is pretty simple: If
a river cannot handle the load of water it's
required to carry, it must rise. With enough
water, it must rise above its banks and flood.
The faster water runs from the watershed
into the river, the higher a flood will be. Thus
anything that increases runoff speed -- like
excessive pavement or ditching of farmland --
will contribute to floods.
148. Forests and flooding
Deforestation plays several roles in the flooding equation
because trees prevent sediment runoff and forests hold
and use more water than farms or grasslands.
•Some rainwater stays on the leaves, and it may evaporate
directly to the air (the more water used in the watershed,
the less remains to run off).
•Leaves reduce raindrop impact, and gentler rain causes
less erosion.
•Tree roots absorb water from the soil, making the soil
drier and able to store more rainwater.
•Tree roots hold the soil in place, reducing the movement
of sediment that can shrink river channels downstream.
149. What is the climate system?
The Earth’s climate system is created by complex interactions
between the Sun, our atmosphere, oceans, land, ice and
biosphere which in turn are affected by an area’s latitude,
elevation, terrain, and distance from coasts, mountains and
lakes.
150. Greenhouse Effect
Greenhouse effect refers to rise in global temperature due to
the process by which the gases in the atmosphere trap the
heat coming from the sun that is re-radiated by the earth’s
surface and re-emit it downwards. Because of how they warm
our world, these gases are referred to as greenhouse gases.
www.eere.energy.gov
151. Most greenhouses look like a small glass house. Greenhouses are
used to grow plants, especially in the winter. Greenhouses work by
trapping heat from the sun. The glass panels of the greenhouse let
in light but keep heat from escaping. This causes the greenhouse
to heat up, much like the inside of a car parked in sunlight, and
keeps the plants warm enough to live in the cool seasons.
How does greenhouse effect works?
152. These gases are called greenhouse gases (ghgs)
and include water vapor, clouds, carbon dioxide,
methane, nitrous oxide and halocarbons.
153. • The ghgs are naturally occurring gases that are vital in
regulating the Earth’s temperature levels that support all
planetary life to the capacity of these gases to absorb energy
from the sun and delay its eventual escape into space.
154. • They act as a natural blanket around the earth,
trapping heat much like a glass roof of a
greenhouse. The concentration of gases fluctuates
with the interaction of the plants, water and
sunlight.
155. The ghgs are produced by natural processes such as
the water cycle, growth and death of plants and
animals, decaying of wood and other biodegradable
materials and volcanic activities.
156. Specifically, Carbon dioxide (CO2) comes
from volcanic eruptions, natural forest fires,
evaporation from oceans, biomass
respiration, decay of plant and animal
matter.
157. • Methane (NH4) is emitted from wetlands
and oceans.
• Nitrous oxide (N2O) comes from oceans,
tropical soils, wet and extra-tropical forests
and dry savannas.
158. • Without the greenhouse effect, the Earth’s
average surface temperature would be some
30°C colder or approximately -15°C and
possibly not warm enough to sustain life.
Source: http://ac.ukSource: http://landcareresearch.co.nz
159. Unfortunately, humans are affecting atmospheric
greenhouse gas concentrations by introducing
new sources or by interfering with natural
processes that destroy or remove ghgs.
160. By burning fossil fuels due to industrialization and
to sustain our modern lifestyle, the level of GHGs
increase rapidly. The higher the concentration of
greenhouse gases in the atmosphere, the
stronger the greenhouse effect making it into
enhanced greenhouse effect.
Source: flickoff.org
161. • Global warming refers to the increase in
the earth’s mean temperature due to the
so-called enhanced greenhouse effect.
162. • This is what is causing climate change.
Climate change, therefore, is caused by both
natural events and human (anthropogenic)
activities. Scientist now agree that most of the
global warming today have been caused by
human activities.
Source: flickoff.org
163. The GHGs/ The Anthropogenic
Sources of GHGs
• Basically, there are three main human
sources of greenhouse gases. These are
from energy generation and industrial
processes, transportation and land-use-
agriculture and forestry.
164. The GHGs/ The Anthropogenic
Sources of GHGs
• Human activities that lead to the increase in
concentration of greenhouse gases include
worldwide deforestation, increasing industrial
activity, motor vehicle emission, waste
management practices and intensive use of
chemical fertilizers and pesticides.
165. The GHGs/ The Anthropogenic
Sources of GHGs
• Burning of fossil fuels like oil, coal, gas and others in
transportation, manufacturing processes and industry
including steel, cement and lime production, land-use
and land-use changes contribute to the increase of
carbon dioxide emissions.
166. The GHGs/ The Anthropogenic
Sources of GHGs
So are the greenhouse gases really increasing?
• During the pre-industrial revolution, levels of
Carbon dioxide (CO2) concentration in the
atmosphere was 280 parts per million (ppm) by
volume.
167. The GHGs/ The Anthropogenic
Sources of GHGs
By the end of 2005, levels had
increased to 379 ppm. Carbon dioxide
is the most prevalent ghg accounting for
60% of the enhanced greenhouse effect
or global warming.
168. The GHGs/ The Anthropogenic
Sources of GHGs
• Methane (NH4) concentration in the
atmosphere had also increased from pre-
industrial value of 715 parts per billion by
volume (ppb) to 1,774 ppb in 2005. Methane
is the second most common ghg which is 21
times the potency of carbon dioxide and is
responsible for 20% of the enhanced
greenhouse effect.
169. The GHGs/ The Anthropogenic
Sources of GHGs
• The process of decomposition in
flooded rice fields causes the emission
of methane into the atmosphere.
Likewise, wastes from dairy production
and waste management systems like
landfills, and leaks from coal mining and
natural gas production increase the
levels of methane.
170. The GHGs/ The Anthropogenic
Sources of GHGs
• Nitrous oxide (N20) concentration in the
atmosphere has increased from a pre-
industrial value of 270 ppb to 319 ppb in 2005.
It is responsible for 20% of the enhanced
greenhouse effect produced from intensive
agriculture including cultivated soils and
nitrogen fertilizer and pesticide use, biomass
burning, combustion processes in vehicles,
acid production processes.
171. The GHGs/ The Anthropogenic
Sources of GHGs
• There are other three (3) man-made
ghgs which were initially intended to
replace chlorofluorocarbons (CFCs) to
prevent further depletion of the ozone
layer. However, they were found to be
harmful greenhouse gases.
• These are Hyrdrofluorocarbons (HFCs)
and Perflurorocarbons (PFCs) and
Sulfur hexafluoride (SF6). HFCs and
PFCs are long-lived and potent and are
used as refrigerants, coolants, foam-
blowing agents and solvents. SF6 are
also long-lived and are used in electric
insulators, heat conductors and freezing
agents.
172. KLIMAKLIMA
Waste as a source of GHG emissions
Decaying solid waste in landfills emits methaneDecaying solid waste in landfills emits methane
173. KLIMAKLIMA
Waste as a source of GHG emissions
Decomposing waste in water can also emit methaneDecomposing waste in water can also emit methane
174. Effects of Global Warming
and Climate Change
• Increase in minimum
(nighttime) temperatures,
maximum (daytime)
temperatures, and increases
in the global mean
temperature.
• Increase in sea surface
temperatures, sea level and
changes in evaporation, and
thus, changes in rainfall
patterns among others.
• Extreme changes in weather
patterns
175. Effects of Global Warming
and Climate Change
A recent report by the Working Group 1 to
the Fourth Assessment Report of the
Intergovernmental Panel on Climate Change
(IPCC), a global group of experts on climate
studies had recently been released this early
February.
“…warming of the climate system is
unequivocal . . . and that most of the observed
increase in global average temperatures since the
mid-2oth century is very likely due to the observed
increase in anthropogenic greenhouse gas
concentrations” (IPCC FAR)
176. Effects of Global Warming
and Climate Change
According to the assessment report:
Global average surface temperature
increased by 0.74°C (1906-2005) which is
higher than the Third Assessment Report
(TAR) of 0.6°C (1901-200).
177. Effects of Global Warming
and Climate Change
According to the assessment
report:
– Global average sea
level rose due to increase
in the global average
surface temperature at an
average rate of 1.8 mm
per year over 1961 to 2003
or a total of 0.17m for the
21st
century
• Sea level rise will occur mostly
as a result of the thermal
expansion of warming ocean
waters, the influx of freshwater
from melting glaciers and ice,
and vertical movements of the
land itself.
178. Effects of Global Warming
and Climate Change
According to the
assessment report:
• Observations since 1961
show that the average
temperature of the global
ocean has increased to
depths of at least 3000
meters and that the ocean
has been absorbing more
than 80% of the heat added
to the climate system. Such
warming causes seawater to
expand, contributing to sea
level rise.
OVERALL WARMING OF THE
PLANET, BASED ON AVERAGE
TEMPERATURE OVER THE
ENTIRE SURFACE (IPCC)
179. Effects of Climate Change
Are there projections for further warming?
Yes, there are projected increases from 1.4°C to 5.8°C during the
21st century leading to an increase in the sea level from 18-59
cm by 2100.. The increase that will be realized by 2100 will depend
on the population growth, amount and manner of developments,
adoption of environmentally clean technologies, and
measures/strategies to be put in place by the global community.
180. Impacts of Climate Change
Having realized and currently
experiencing the effects of global
warming or climate change, it is inevitable
that these effects will also create
numerous impacts.
Some are beneficial, like the fertilization
effect of increased concentration of
carbon dioxide (CO2) seem to cause
improved harvests and the warmer
temperatures in cold countries which will
lead to less death among the very young
and the elderly.
But largely for developing countries,
adverse impacts will certainly affect the
major sectors of the country.
181. KLIMAKLIMA
Climate Change and Environmental Impacts
Changes in temperature, weather patterns and sea level rise
Agriculture:
Changes in crop yields
Irrigation demands,
Productivity
Forests:
Change in Ecologies,
Geographic range of species,
and
Health and productivity
Coastal Areas:
Erosion and flooding
Inundation
Change in wetlands
Water Resources:
Changes in water supply
and water quality
Competition/Trans-border
Issues
Human Health:
Weather related
mortality
Infectious disease
Air quality -
respiratory illness
Industry and
Energy:
Changes in Energy
demand
Product demand &
Supply
182. Impacts of Climate Change
Bleaching of the coral reefs is associated with
the loss of symbiotic algae and/or their
pigments, and the death of the corals if the
warming of the sea surface temperatures are
183. Impacts of Climate Change
Health
– Increase in health problems and deaths due to
greater frequency and severity of heat waves and
other extreme weather events
– Will largely affect those suffering from respiratory
and cardiovascular disorders as they have lesser
coping capacity
184. Impacts of Climate Change
Health
Potential impacts on health due to sea level rise
– Death and injury due to flooding
– Reduced availability of freshwater due to
saltwater intrusion
Source:newyorktimes
185. Impacts of Climate Change
Health
• Contamination of water supply through
pollutants from submerged waste dumps
• Change in the distribution of disease-
spreading insects
• Effect on nutrition due to a loss in
agricultural land and changes in fish
catch
• Health impacts associated with
population displacement
186. Impacts of Climate Change
Forests and Wildlife
Ecosystems sustain the earth’s entire storehouse of species
and genetic diversity. Plants and animals are very sensitive
to changes in climate hence, the most affected are those
ecosystems in the higher latitudes, the tundra forests. Polar
regions will feel the impact of warming more than others.
187. Impacts of Climate Change
Forests and Wildlife
• Species migration; shift in feeding point and
disruption in flight patterns for migratory birds.
• Extinction of some mountain plants and animals
188. Impacts of Climate Change
Coastal and marine ecosystem
• Climate change will alter ocean
circulation and wave patterns, affecting
biological productivity, nutrient
availability and marine ecological
structure and functions.
• Sea level rise will greatly affect coastal
areas through inundation and erosion,
increased flooding, and salt-water
intrusion, and may even cause extreme
events like high tides, storm surges and
tsunamis, thereby affecting coastal
agriculture, tourism, freshwater
resources, fisheries and aquaculture,
human settlements and health.
189. Impacts of Climate Change
Coastal and marine ecosystem
• Corals are known as the tropical forests of the oceans
and sustain diverse life forms. As ocean waters in the
tropics become warmer, corals reefs will be damaged
since corals are very sensitive to changes in water
temperature, which causes coral bleaching.
190. Impacts of Climate Change
Water Resources
• Climate change will influence
the hydrological cycle,
changing evaporation,
precipitation and runoff
patterns which could affect
water resources. Saline
intrusion will reduce quality
and quantity of freshwater
supplies.
191. Impacts of Climate Change
Coastal and marine ecosystem
• Zooplanktons, small organisms that float
in the sea surface are declining in
numbers, reducing the number of fish
and sea birds that feed on these
organisms.
192. Impacts of Climate Change
Agriculture and food security
– Added heat stress, shifting monsoons, drier soils and
water shortages as a result of higher temperatures will
affect livestock and crop production patterns with
expanded range of weeds, insects and diseases which
may reduce global food supplies and contribute to
higher food prices.
193. Impacts of Climate Change
Agriculture and food security
– Rice production will largely be affected
because of changes in temperature
and rainfall. For every 1°C increase in
temperature, rice yields will decrease
by 0.6 tons per hectare (IRRI)
– For every 75 parts per million (ppm) of
CO2 concentration, rice yields will
increase by 0.5 tons per hectare
(IRRI), but could be irrigated by
warmer temperatures.
– Changes in soil quality, occurrence of
weed infestation and diseases
194. Impacts of Climate Change
Agriculture and food security
• Competition for water will increase the
pressure on riceland and favor adoption of
cropping systems or practices that will
consume less irrigation water
• Global yield from marine fisheries may be
negatively affected by upsets in established
reproductive patterns, migration routes and
ecosystems relationships.
195. Impacts of Climate Change
What are the
manifestations/signals of global
warming in the local scale?
• In the Philippines, there are
already trends of increasing
number of hot days and warm
nights, but decreasing number of
cold days and cool nights. Both
maximum and minimum
temperatures are generally
getting warmer.
196. Impacts of Climate Change
Other extreme weather/climate events like intense
rains have been seen to be more frequent.
197. Impacts of Climate Change
A substantial amount of corals reefs in the
country have been found to have been affected
by bleaching during events of warmer sea
surface temperatures.
198. What can we do?
• Increase the resilience and coping
capacity of the sector with the current
and future changes (Adaptation)
• Limit the cause of climate change
through measures that could slow
down the build up of atmospheric
GHGs concentrations by reducing
current and future emissions and by
increasing GHG sinks (Mitigation)
Source: DA-BSWM
199. We can make a difference . . .
• Read and share what we have learned
about climate change
• Save electricity
– turn off lights and electric appliance
when not in use
– use more energy efficient electric
appliances
– use compact fluorescent bulbs (CFLs)
that last 4 times longer and use just
1/4 of the electricity compared to
incandescent bulbs
• Plant trees in your neighborhood and look
after them. Trees absorb carbon dioxide
from the air.
200. We can make a difference. . .
• Take the bus, ride a bike or walk;
maximize the use of public transport
systems.
• Recycle cans, bottles, plastic bags and
newspapers. When you recycle, you help
save natural resources.
• Generate as little trash as possible,
because trash in landfill sites emit
large quantities of methane, and if
burned, carbon dioxide is released.
• Reduce on the use of non-renewable
sources of energy and increase in the
use of renewable energy sources such
as solar, hydro, and wind energy.
201. We can make a difference. . .
• Review on your institution’s current policies
and programs that may work as either
mitigation or adaptation strategies and
measures in addressing climate change
• Encourage cooperation and partnerships
among other institutions in programs and
activities that would help fight global
warming.
• Strengthen environmental awareness and
action among your colleagues by initiating
innovative and creative information and
education campaigns.
• Consume less, share more, live simply.
202. Significant Milestones in the Philippines’ Response to
Address Climate Change and Global Warming
Created the Inter-Agency Committee on Climate Change
(IACCC) in May 1991 to serve as the national
coordination mechanism and administrative machinery to
implement the country’s commitments to the United
Nations Framework Convention on Climate Change
(UNFCCC)
Signed the UNFCCC on June 1992 and ratified it on
August 2, 1994
Signed the Kyoto Protocol on April 15, 1998 and ratified it
on November 20, 2003
Designated the DENR as the National Authority for CDM
on June 25, 2004 by virtue of Executive Order No. 320
Issued DENR Adm. Order 2005-17 on August 2005 on
the IRR Governing E.O. 320
203. “Climate change will not be
effectively managed until
individuals and communities
recognise that their behaviour
can make a difference.”
-The Royal Society, Climate Change: what we know
and what we need to know. (2002)
204. Recommendations
The research on the “Self-Sufficiency Ecology
Systems of Metro Davao and Southern Mindanao”
which I proposed last June 1, 1996 with the University of
Southeastern Philippines, Davao City and the
Ecological Balance (EB) Sector component of the
“Services Delivery Evaluation Scheme” and the
“Services Delivery Profile” manuals of the former
Ministry of Human Settlements (MHS) which I formulated
in 1983 and 1984, respectively, therefore, were
envisioned by the undersigned to develop a master plan
to assist the people in Metro Davao and Southern
Mindanao, the country and the world for use in the
balanced utilization and maintenance of its ecology
systems within its areas of concern for the attainment of
205. Recommendations
a sustainable growth and development for its people.
This was also designed for nurturing the environment for
its sustenance and the prevention of drastic global
warming and climate change which has brought so much
damage and catastrophies in Davao City, the country
and the rest of the world like floods, drought, typhoons,
tornadoes, earthquakes, tsunamis, to name a few.
Hopefully, this could also help in the improvement of the
quality of life for all concerned residents in their
respective communities in the city, region, the country
and the rest of the world.
206. Recommendations
The Self-Sufficiency Ecology Systems research and
development project was planned to be undertaken in
three phases. The first phase (Phase I) of the project
which includes project activation, master plan
preparation and initial operationalization shall be finished
in two years time and is the main concern of the
preliminary research. Phase II shall include project
implementation, controlling and evaluation. The final
stage (Phase III) shall be the continuation of the
research and development, planning and
implementation, monitoring, controlling and evaluation
activities for the eventual realization of the Sustainable
Ecology Systems designed for Metro Davao and
Southern Mindanao, the country and the rest of the
world.
207. Recommendations
In order to achieve these aims, the following are my
recommendations:
1.Conduct of the Area Assessment Survey on the existing
ecology systems conditions in Metro Davao, Southern
Mindanao, the country and the rest of the world should be
conducted.
2.Develop the needed parameters which are vital in the
formulation of manual and computerized monitoring and
controlling systems for the purpose of planning and
implementing various ecological balance activities for these
areas.
3.Prepare the Self-Sufficiency Ecology Systems Profile for
Metro Davao, Southern Mindanao, the country and the rest
of the world.
208. Recommendations
4. Facilitate the Development of an integrated Self-
Sufficiency Ecology Systems Development Plan and
water supply system of Metro Davao, Southern
Mindanao, the country and the rest of the world for the
improvement of the quality of life of its people.
5. Formulate the balanced, sustainable, self-sufficient and
self-contained Ecology Systems Map of Metro Davao,
Southern Mindanao, the country and the rest of the
world.
6. Formulate action plans for the realization of this
program.
7. Develop linkages and facilitate the creation of an inter-
agency Ecology Systems Development Committees
responsible for the actual planning and implementation
209. Recommendations
of this program at the local, national and
international levels.
8. Facilitate the implementation of the Self-Sufficiency
Ecology Systems Development Plan of Metro Davao,
Southern Mindanao, the country and the rest of the
world once approved by concerned authorities.
9. Develop the Management Information System needed
for the success of the program at the local, national and
international levels.
10.Monitor actual program implementation at the local,
national and international levels.
11.Evaluate results and feedbacks during actual project
implementation at the local, national and international
levels.
210. Recommendations
12.Conduct research and development studies to find out
how many kilograms of oxygen is needed by human
beings, animals, factories, cars, etc. daily, monthly and
annually.
13.Conduct research and development on how may
kilograms of oxygen can be produced by trees and
plants so the number of trees needed to be planted can
be estimated in order to determine the total number of
trees to be planted at the local, national and global
levels. Plant trees also in order to prevent flooding.
14. Conduct a research and development program
designed to develop high oxygen-producing plants or
211. Recommendations
trees designed to replenish the diminishing supply of
oxygen in the world to a level wherein a balance
between oxygen production and utilization can be
maintained to attain equilibrium. The ideal quantity of
square kilometers of oxygen-producing leaves of plants
and trees through oxygen generating photosynthesis
processes must be studied and quantified so unlimited
supply of oxygen can be produced and consumed or
inhaled by humans and animals and the factories,
equipment, machineries and processes requiring the
vital oxygen supply of this planet called earth.
15.Conduct a massive oxygen-producing plant or tree
planting activities at the local, regional, national or
212. Recommendation
international levels. Each oxygen-consuming human
being and animal in the world should be planted with an
equitable number of trees and green plants enough, or
even more, than the required amount of oxygen he or
she requires to breathe to maintain equilibrium for its
own survival. These trees or plants could also help in
preventing the occurrence of destructive floods in the
future. Proper town planning, housing and zoning
measures has to be undertaken and implemented to
help achieve this end.
16.Conduct energy saving audits at the local, national and
international levels.
213. Recommendations
17.Reduce the release of greenhouse gases at the local,
national and global levels to a safe level so as to
maintain the right atmospheric temperature and
pressure in the atmosphere. The resulting temperature
should not be too much which could increase to a
disastrous global warming nor too small which would
result to global cooling or even the ice age.
18.Use energy saving devices, equipment, machineries
and processes to save energy and fuel.
19.Manufacture more efficient and effective machineries,
equipment, devices and related processes.
20.Complement the energy production using non-
conventional energy systems.
214. Recommendations
21.Segregate solid waste products to biodegradable and
non-biodegradable. Recycle the non-biodegradable
solid wastes for reuse. The biodegradable wastes shall
also be transformed to produce electric energy and/or
for the production of fertilizer so minimal or no waste
shall be thrown away. The remaining waste by-products
should have minimal or no pollution to be released to
the atmosphere for the reduction of global warming on
this planet.
215. Quick Facts
Area: 300,000 km2
Archipelago: 7,107 islands
Population: 88.57 M
(Aug 2007)
12th most populous
Labor force: 50% services
(36.2 M, 2007 est) 35% agriculture
15% industry
Administrative divisions:
17 regions, 81 provinces
One of the most mega-diverse
countries of the world
Sea ice conditions at the annual minimum on September 16, 2007
Figure 1 compares the five-day mean sea ice extent on September 16, 2007, this year’s apparent minimum, with minimum sea ice extent on September 20–21, 2005, the previous record low. The magenta line indicates the mean September extent based on data from 1979 to 2000. The apparent five-day 2007 minimum was 4.13 million square kilometers (1.59 million square miles), compared to 5.32 million square kilometers (2.05 million square miles) in 2005.
The long-term average minimum, based on averaging data from 1979 to 2000, is 6.74 million square kilometers (2.60 million square miles) and occurs on September 12. Compared to this average, five-day mean ice extent for September 16, 2007, was lower by 2.61 million square kilometers (one million square miles), an area approximately equal to the size of Alaska and Texas combined, or the size of ten United Kingdoms.
The minimum for 2007 shatters the previous five-day minimum set on September 20–21, 2005, by 1.19 million square kilometers (460,000 square miles), roughly the size of Texas and California combined, or nearly five United Kingdoms.
Yesterday's sea ice extent compared to perennial sea ice
Figure 3 further illustrates the significance of this year’s decline in sea ice. In this figure, we overlay two areas. Gray areas within the Arctic Ocean indicate where sea ice was present every day of every year from 1979 through spring 2007. Yesterday’s sea ice is in white, and the overlap areas are in light gray. The dark gray color represents the region that is ice-free for the first time in the satellite record.
What does this figure really tell us? It tells us that a large area is, for the first time since the satellite record began, not covered by sea ice.
The amount and location of summer sea ice varies from year to year, so even after twenty-eight years it would not be surprising to have some small areas that are newly ice-free each year. However, this year the first-time ice-free area is extremely large—roughly the size of the state of California.
Despite overall cooler summer temperatures, the 2008 minimum extent is only 390,000 square kilometers (150,000 square miles), or 9.4%, more than the record-setting 2007 minimum. The 2008 minimum extent is 15.0% less than the next-lowest minimum extent set in 2005 and 33.1% less than the average minimum extent from 1979 to 2000.
Figure 5 -- Left: February ice age distribution in the Arctic during normal conditions (1985-2000 average). Right: February 2008 Arctic ice age distribution. The ice in the Arctic is much younger than normal, with vast regions now covered by first-year ice (ice that has formed since last summer’s melt) and much less area covered by multiyear ice (ice that has survived at least one melt season). Ice that is 6 years old or older shows an even more dramatic decrease in 2008 compared to average conditions. Ice age is a good indicator of general ice thickness, with older ice thicker on average than younger ice. First-year ice generally ranges between about 3-5 feet thick, while multiyear ice averages about 8-10 feet; old ice that has survived several melt seasons can easily be 12-15 feet thick. > High resolution image Credit: NSIDC, Courtesy S. Drobot, University of Colorado, Boulder
Figure 6 – Time series of ice age showing the proportional composition of the total ice area covered by ice of different ages. Multiyear (2-5 year old and 6+ year old, green and blue colors) ice once covered over 50 percent of the Arctic, but in 2008 accounts for less than 30 percent. Old ice (in blue) once covered over 20 percent of the area of the Arctic, but now only covers about 6 percent. The proportion of first-year ice has increased from about 50 percent during the 1980s and 1990s to over 70 percent in 2008. > High resolution image Credit: NSIDC, data from S. Drobot, J. Maslanik, and C. Fowler, University of Colorado, Boulder
Alaska’s glaciers are responsible for at least 9% of the global sea level rise in the past century (ACIA 2004)
Romanovsky photo
Female rely on sea ice to nurse their calves and feed. It is critical that the ice is over the continental shelf because they are benthic (bottom clams etc.) feeders. There is some evidence of females abandoning their calves when the ice completely retreats from the continental shelf.
Statement was made by a scientist
Since late summer, thousands of walruses since late summer have congregated in haulouts on Alaska's northwest shore, a phenomenon likely connected to record low Arctic sea ice (ADN 10/5/07).
“Walruses on shore may be forced to swim farther to forage, expending more energy. Researchers would expect increased mortality to calves, …..if they try to stay with their mothers during feeding rather than resting on a platform of sea ice over feeding grounds.”
Joel Garlich-Miller, a walrus expert with the U.S. Fish and Wildlife Services
Chad Jay, a U.S. Geological Survey biologist.
Thousands of walruses since late summer have congregated in haulouts on Alaska's northwest shore, a phenomenon likely connected to record low Arctic sea ice.
Joel Garlich-Miller, a walrus expert with the U.S. Fish and Wildlife Services in Anchorage, said Wednesday animals began showing up on shore in late July, a month earlier than usual. By August, several thousand animals -- far more than normal -- were bunched up in haulouts in a stretch of coastline from Barrow, America's northernmost community, to Cape Lisburne, about 300 miles to the southwest on the Chukchi Sea.
"It's raising a bunch of conservation issues for us," Garlich-Miller said.
The agency's immediate concern is that groups of walruses congregated on land are susceptible to additional human contact, whether a low-flying airplane or a hunter's boat, that could panic the group, setting off a deadly stampede to the water.
But having animals concentrated on land instead of the vast expanse of the Arctic ice pack also raises stress issues, said Chad Jay, a U.S. Geological Survey biologist.
Walruses on shore may be forced to swim farther to forage, expending more energy. Researchers would expect increased mortality to calves, Jay said, if they try to stay with their mothers during feeding rather than resting on a platform of sea ice over feeding grounds.
"You can imagine access to traditional foraging areas is diminished," Garlich-Miller said. "That is cause for concern."
In the 1970s, Kittlitz’s murrelets were described as
“common” with an estimated 63,000 birds in Prince William
Sound and more than 100,000 in the broader northern Gulf
of Alaska. A 1989 survey found 6,400 birds in the sound,
and a 2001 survey counted 1,969 birds—a 97 percent drop
in 30 years and an annual decrease of 18 to 24 percent
during the 1990s.
Glacier Bay, where populations dropped 89 percent between
1991 and 2000, and on the Kenai Peninsula, which posted
an 83 percent decline from 1976 to 2002.
Federal biologists John Piatt and Kathy Kuletz report,
“The fate of Kittlitz’s murrelet likely hinges on the fate of
Alaska’s glaciers. Impacts of human activities, such as bycatch
in nets and mortality from oil spills, will likely hasten their
decline.”
The temperature has increased over 10 F over the last 25 years
Several adverse effects such as diseases that thrive when temperature rises above 15 C
FYI - Icthyophonus is protozoan disease not fungal
Diseases that could not have thrived before GW can now thrive
Site scientific studie
Point out Dr Kocan (ko-san) at UW
ADFG determined that temperatures should not exceed 13 C
Cook inlet Keeper in conjunction with Homer Soil and Water Conservation District monitored the streams listed on the graph
In 2005, each stream surveyed exceeded than standard on more than 80 days
Update the graph to 2005
Global warming is not only bad for salmon living in clear water streams but also salmon that live in glaciated streams and when temperatures are warmer glaciers melt faster and when they melt faster they put more sediment into the water and when there is more sediment less light can penetrate
When there is less planktonic food means less food for fry to eat resulting in smaller fry and the size of fry in the fall is the most important indication of their likelihood to survive the winter
Altering entire ecosystems
Bering Sea is Americas fish basket
Pollock Catch Limit Cut. In part because global warming is causing pollock to migrate northward into cooler, non-American waters, the North Pacific Fisheries Management Council cut pollock catch quotas by 6%. This represents a loss of tens of millions of dollars. (Anchorage Daily News 12/12/06). This is more concrete evidence that global warming is very, very costly to the United States.
This “…continued trend… may have profound impacts on Arctic marine mammal and diving seabird populations as well as commercial and subsistence fisheries.”
(Grebmeier, Overland, Moore, et al. Science 03/10/06)
As of September 28th, the largest tundra fire in question is still burning, and is now over 220,000 acres, making it the biggest tundra fire ever recorded on the North Slope (Associated Press 9/28/07). It started with a lightening strike July 16. According to a nearby field scientist, "It's a tremendous fire. It's visible from 50 miles away by its plumes, and it obscured a third of the northern sky."
Topographic map and Landsat thematic mapper scenes illustrating coastal lake drainage and fl ooding of old lake bed to produce estuary or marine bay. A: 1955 topographic map depicts intact thermokarst lake (light blue represents water). B: Band 5 Landsat image from 1985 illustrates that coastal erosion has breached and drained thermokarst lake exposing ~70% of lake bed (black represents water). C: Band 5 Landsat image from 2005 illustrates that ~75% of lake bed has been flooded, forming new estuary or marine bay (black represents water). (Larger Image)
Monaco Declaration was signed by 155 scientists from 26 nations. This arose from the Second International Symposium on the Ocean in a High-CO2 World
Monaco Declaration was signed by 155 scientists from 26 nations. This arose from the Second International Symposium on the Ocean in a High-CO2 World
The Honorable Ted StevensUnited States Senate522 Hart Senate Office BuildingWashington, D.C. 20510(202) 224-3004(202) 224-2354 FAXemail You can now receive regular e-mail updates by signing up here.
Stevens at the Renewable Energy Fair at Chena Hot Springs
Lisa at Kotzebue wind Farm
Lisa with AYEA representatives