Weighting Survey Data to Match Population Demographics
•Download as PPTX, PDF•
1 like•84 views

Using SPSS raking algorithm handling population and sample differences

Recommended
More Related Content
Similar to Weighting Survey Data to Match Population Demographics
Similar to Weighting Survey Data to Match Population Demographics (20)
More from Robert Radics
Recently uploaded
Recently uploaded (20)
Weighting Survey Data to Match Population Demographics
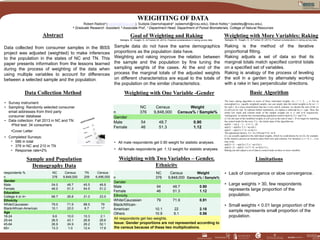
- 1. WEIGHTING OF DATA Robert Radicsa (riradics@ncsu.edu), Sudipta Dasmohapatrab (sdasmoh@ncsu.edu), Steve Kelley c (sskelley@ncsu.edu), a Graduate Research Assistant, b Associate Prof., c Department Head, Department of Forest Biomaterials, College of Natural Resources Data Collection Method Abstract Data collected from consumer samples in the IBSS project was adjusted (weighted) to make inferences to the population in the states of NC and TN. This paper presents information from the lessons learned during the process of weighting of the data when using multiple variables to account for differences between a selected sample and the population. Goal of Weighting and Raking Battaglia, M., Hoaglin, D., & Frankel, M. (2013). Practical considerations in raking survey data. http://magmods.wordpress.com/2011/03/23/magmods-questionnaire-3/ Weighting with More Variables; Raking Battaglia, M., Hoaglin, D., & Frankel, M. (2013). Practical considerations in raking survey data. Basic Algorithm Limitations Weighting with One Variable -Gender Weighting with Two Variables – Gender, Ethnicity • Survey instrument • Sampling: Randomly selected consumer email addresses from third party consumer database • Data collection: Fall 2013 in NC and TN •Pilot test: 34 consumers •Cover Letter • Completed Surveys: • 586 in total • 376 in NC and 210 in TN • Response rate=2% respondents % NC Census TN Census n 376 9,848,000 209 6,496,000 Gender Male 54.0 48.7 45.5 48.8 Female 46.0 51.3 54.5 51.2 Education College 4 or 4+ 66.7 26.8 31.0 23.5 Ethnicity White/Caucasian 79.0 71.9 88.5 79 Black/African-American 10.1 22.0 6.7 17 Age 18-24 9.6 10.0 10.3 2.1 25-44 26.5 43.1 26.8 26.6 45-64 26.9 24.9 26.2 52.1 65+ 13.3 1.0 12.4 17.8 Sample and Population Demography Data Sample data do not have the same demographics proportions as the population data have. Weighting and raking improve the relation between the sample and the population by fine tuning the sampling weights of the cases. At the end of the process the marginal totals of the adjusted weights on different characteristics are equal to the totals of the population on the similar characteristics. NC Census Weight n 376 9,848,000 Census% / Sample% Gender Male 54 48.7 0.90 Female 46 51.3 1.12 • All male respondents get 0.90 weight for statistic analyses. • All female respondents get 1.12 weight for statistic analyses. NC Census Weight n 376 9,848,000 Census% / Sample% Gender Male 54 48.7 0.90 Female 46 51.3 1.12 Ethnicity White/Caucasian 79 71.9 0.91 Black/African- American 10.1 22 2.18 Others 10.9 6.1 0.56 All respondents get two weights. Issue: Gender proportions are not represented according to the census because of these two multiplications. Raking is the method of the iterative proportional fitting. Raking adjusts a set of data so that its marginal totals match specified control totals on a specified set of variables. Raking is analogy of the process of leveling the soil in a garden by alternately working with a rake in two perpendicular directions. • Lack of convergence or slow convergence. • Large weights > 30, few respondents represents large proportion of the population. • Small weights < 0.01 large proportion of the sample represents small proportion of the population. The basic raking algorithm in terms of those individual weights, wi, i = 1, 2, ..., n. For an unweighted (i.e., equally weighted) sample, one can simply take the initial weights to be wi = 1 for each i. In a cross-classification that has J rows and K columns, we denote the sum of the wi in cell (j,k) by wjk. To indicate further summation, we replace a subscript by a + sign. Thus, the initial row totals and column totals of the sample weights are w j+ and w+k respectively. Analogously, we denote the corresponding population control totals by T j+ and T+k . (1) for the sum of the modified weights in cell (j,k) at the end of step 1. If we begin by matching the control totals for the rows, T j+, the initial steps of the algorithm are mjk(0) = wjk (j = 1,...,J; k=1,...,K) mjk(1) = mjk(0) ( T j+ / mj+(0) ) mjk(2) = mjk(1) ( T +k / m+k(1) ) The adjustment factors, T j+ /m j+(0) and T+k / m+k (1), are actually applied to the individual weights, which we could denote by mi (2), for example. In the iterative process an iteration rakes both rows and columns. For iteration s ( s = 0, 1, ...) we may write mjk(2s+1) = mjk(2s) ( T j+ / mj+(2s) ) mjk(2s+2) = mjk(2s+1) ( T +k / m+k(2s+1) ) Raking can also adjust a set of data to control totals on three or more variables.