Downloaded 115 times
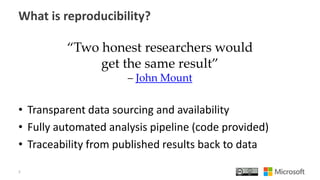
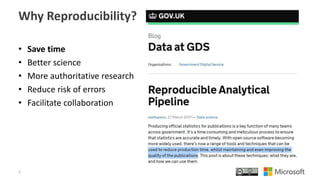

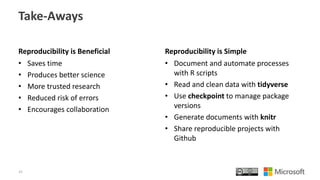


The document discusses reproducible data science using R, emphasizing the importance of reproducibility for saving time, enhancing scientific integrity, and facilitating collaboration. It outlines key practices such as transparent data sourcing, automated analysis pipelines, and the use of tools like R scripts and packages (e.g., tidyverse, knitr) for managing data and generating documents. The final takeaways highlight the benefits of reproducibility and provide practical steps for implementing it in data science projects.