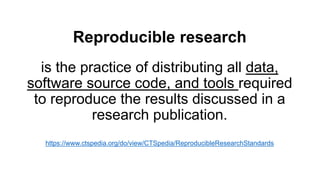
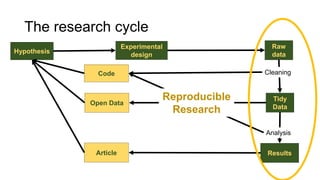
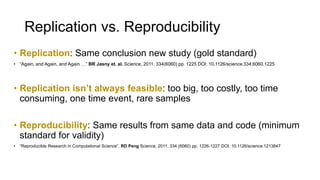
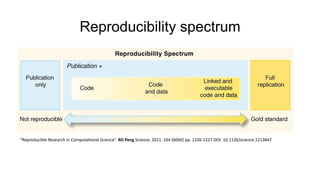
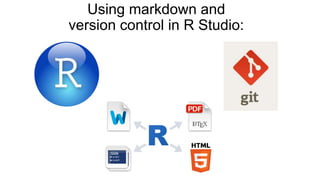
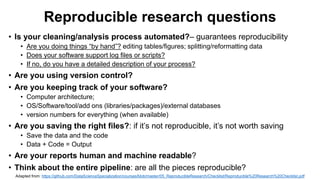
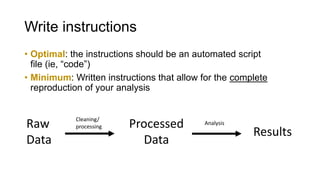
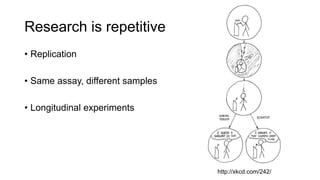
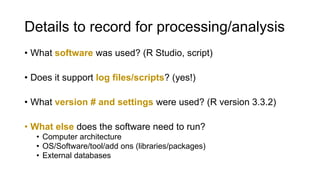
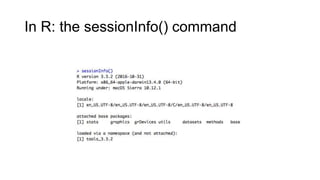
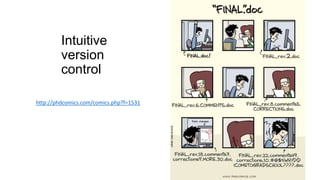
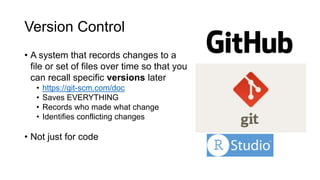
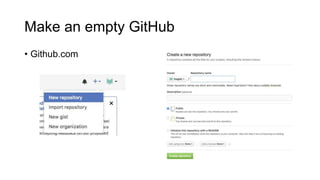
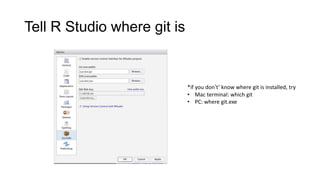
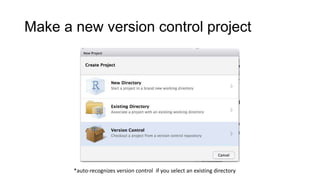
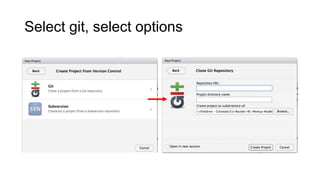
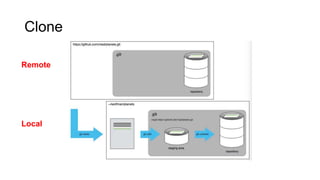
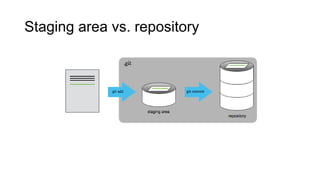
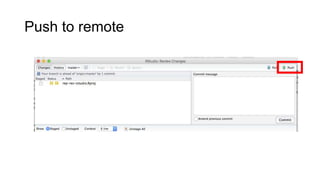
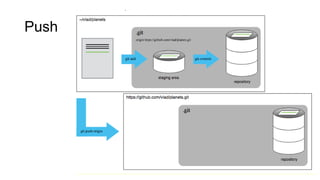
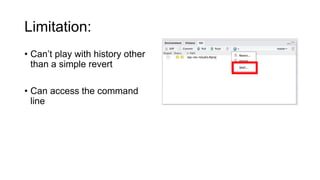
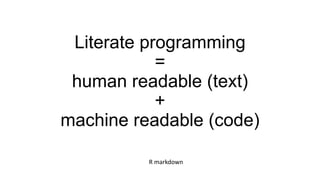
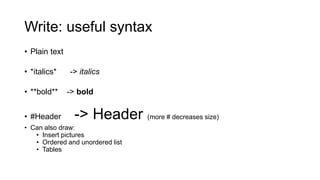
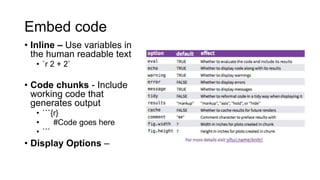
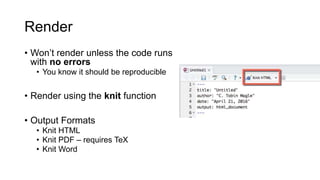
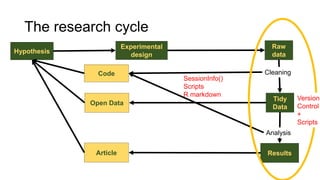
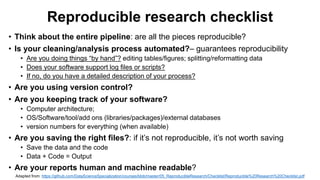
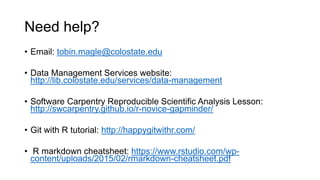
This document discusses reproducible research and provides guidance on how to conduct analysis in a reproducible manner. Reproducible research means distributing all data, code, and tools required to reproduce published results. Key aspects include automating analysis, using version control like Git, and producing human and machine readable reports in R Markdown. The presenter provides examples of documenting analysis in R and using R Markdown documents. Researchers are encouraged to think about reproducibility in their entire workflow and use checklists to ensure all elements like data, code, software details are preserved.
What is reproducible research? Why should I use it? what tools should I use? This session will show you how to use scripts, version control and markdown to do better research.
Data is getting bigger and more complex than ever before. Why not learn how to automate your analyses using the R programming language? This sessions covers the basics of using R such as operators, functions, data frames and factors.
Datat and donuts: how to write a data management planC. Tobin Magle
Good data management practices are becoming increasingly important in the digital age. Because we now have the technology to freely share research data and also because funding agencies want to do more with decreasing research funds, many funding agencies and journals require authors and grantees to share their research data. To provide training in this area, Tobin Magle, the Morgan Library's Cyberinfrastructure Facilitator, is putting on a series of data management workshops called "Data and Donuts". The first session of Data and Donuts will discuss the importance of data management and how to write a data management plan.
This session covers topics related to data archiving and sharing. This includes data formats, metadata, controlled vocabularies, preservation, archiving and repositories.
Are you interesting in offering data management services at your library but aren’t sure where to start? Then this class is for you! During this session, we will
• Outline the data management topics that are commonly offered in libraries
• Present strategies for how to determine what services might be most useful on your campus and create synergistic partnerships with other university entities
• Dive into how to offer support with data management plans
• Present a case study for using an institutional repository to archive and share research data
• Identify additional training opportunities and open educational resources you can use to develop robust DM services
The class will consist of a mix of presentations, hands on activities, and discussion. So come ready to participate!
Learn how to manipulate data frames using the dplyr package by Hadley Wickham. This session will cover select, filter, summarize, tally, group_by, and mutate. Based on the data carpentry ecology lessons
For the past several decades the rising tide of technology -- especially the increasing speed of single processors -- has allowed the same data analysis code to run faster and on bigger data sets. That happy era is ending. The size of data sets is increasing much more rapidly than the speed of single cores, of I/O, and of RAM. To deal with this, we need software that can use multiple cores, multiple hard drives, and multiple computers.
That is, we need scalable data analysis software. It needs to scale from small data sets to huge ones, from using one core and one hard drive on one computer to using many cores and many hard drives on many computers, and from using local hardware to using remote clouds.
R is the ideal platform for scalable data analysis software. It is easy to add new functionality in the R environment, and easy to integrate it into existing functionality. R is also powerful, flexible and forgiving.
I will discuss the approach to scalability we have taken at Revolution Analytics with our package RevoScaleR. A key part of this approach is to efficiently operate on "chunks" of data -- sets of rows of data for selected columns. I will discuss this approach from the point of view of:
- Storing data on disk
- Importing data from other sources
- Reading and writing of chunks of data
- Handling data in memory
- Using multiple cores on single computers
- Using multiple computers
- Automatically parallelizing "external memory" algorithms
Reproducible Computational Research in RSamuel Bosch
A short presentation with pointers on getting started with reproducible computational research in R. Some of the topics include git, R package development, document generation with R markdown, saving plots, saving tables and using packrat.
Reproducibility and automation of machine learning processDenis Dus
A speech about organization of machine learning process in practice. Conceptual and technical aspects discussed. Introduction into Luigi framework. A short story about neural networks fitting in Flo - top-level mobile tracker of women health.
Reproducible data science: review of Pachyderm, Data Version Control and GIT ...Josh Levy-Kramer
The advances in machine learning are great, yet, in order to have real value within a company, data scientists must be able to go from a research project to a reproducible process. A common problem is that the code is intrinsically linked to the data it was developed against. Hence it is critically important to track, trace and validate the input data used to train and test the algorithm. This talk will be a review of the several tools which for data versioning and processing.
Have you ever wondered how to speed up your code in Python? This presentation will show you how to start. I will begin with a guide how to locate performance bottlenecks and then give you some tips how to speed up your code. Also I would like to discuss how to avoid premature optimization as it may be ‘the root of all evil’ (at least according to D. Knuth).
Coding Like the Wind - Tips and Tricks for the Microsoft Visual Studio 2012 C...Rainer Stropek
Microsoft Visual Studio 2012 contains a bunch of productivity features for C# developers. Rainer Stropek, MVP for Windows Azure, summarizes his top tips for the new VS2012 C# IDE in this presentation
Anoushiravan Ghamsari, known as Anoush Ghamsari is a brilliant architect, the way he uses his creativity to create phenomenal concepts is beyond this world.
I work in a Data Innovation Lab with a horde of Data Scientists. Data Scientists gather data, clean data, apply Machine Learning algorithms and produce results, all of that with specialized tools (Dataiku, Scikit-Learn, R...). These processes run on a single machine, on data that is fixed in time, and they have no constraint on execution speed.
With my fellow Developers, our goal is to bring these processes to production. Our constraints are very different: we want the code to be versioned, to be tested, to be deployed automatically and to produce logs. We also need it to run in production on distributed architectures (Spark, Hadoop), with fixed versions of languages and frameworks (Scala...), and with data that changes every day.
In this talk, I will explain how we, Developers, work hand-in-hand with Data Scientists to shorten the path to running data workflows in production.
Presentation given to the Drexel Career Cornerstone Group about using R and ggplot2 to create insightful visualizations for exploratory data visualization. Full workshop code can be found at https://rstudio.cloud/project/358879 or https://github.com/rharrington31/drexel_visualization_workshop
Data and donuts: Data Visualization using RC. Tobin Magle
Based on the Data Carpentry Curriculum, this presentation goes over how to visualize data in R using ggplot2 and enough data wrangling with dplyr to do it.
Responsible conduct of research: Data ManagementC. Tobin Magle
A presentation for the Food and Nutrition Science Responsible conduct of research class on data management best practices. Covers material in the context of writing a data management plan.
Data management is a key skill in the age of large, complex data sets. Collaborative research makes the process of managing research data harder. This presentation will cover some key features of the Open Science Framework that facilitate collaborative research.
Data and Donuts: How to write a data management planC. Tobin Magle
This presentation describes best practices for how to write a data management plan for your research data. Additionally, it provides information about finding funder requirements, metadata standards, and repositories.
Data and Donuts: The Impact of Data ManagementC. Tobin Magle
Good data management practices are becoming increasingly important in the digital age. Because we now have the technology to freely share research data and also because funding agencies want to do more with decreasing research funds, many funding agencies and journals require authors and grantees to share their research data. To provide training in this area, Tobin Magle, the Morgan Library's Data Management Specialist, is putting on a series of data management workshops called "Data and Donuts". Join us to learn about data management topics throughout the research data lifecycle.
Funding agencies are instituting requirements for data management and sharing as a condition of receiving research funds. This presentation addresses why researchers should care about research data management, what libraries have to do with it, and a case study of what one research specialist at the University of Colorado Anschutz Medical Campus is doing in this area.
Adjusting primitives for graph : SHORT REPORT / NOTESSubhajit Sahu
Graph algorithms, like PageRank Compressed Sparse Row (CSR) is an adjacency-list based graph representation that is
Multiply with different modes (map)
1. Performance of sequential execution based vs OpenMP based vector multiply.
2. Comparing various launch configs for CUDA based vector multiply.
Sum with different storage types (reduce)
1. Performance of vector element sum using float vs bfloat16 as the storage type.
Sum with different modes (reduce)
1. Performance of sequential execution based vs OpenMP based vector element sum.
2. Performance of memcpy vs in-place based CUDA based vector element sum.
3. Comparing various launch configs for CUDA based vector element sum (memcpy).
4. Comparing various launch configs for CUDA based vector element sum (in-place).
Sum with in-place strategies of CUDA mode (reduce)
1. Comparing various launch configs for CUDA based vector element sum (in-place).
Techniques to optimize the pagerank algorithm usually fall in two categories. One is to try reducing the work per iteration, and the other is to try reducing the number of iterations. These goals are often at odds with one another. Skipping computation on vertices which have already converged has the potential to save iteration time. Skipping in-identical vertices, with the same in-links, helps reduce duplicate computations and thus could help reduce iteration time. Road networks often have chains which can be short-circuited before pagerank computation to improve performance. Final ranks of chain nodes can be easily calculated. This could reduce both the iteration time, and the number of iterations. If a graph has no dangling nodes, pagerank of each strongly connected component can be computed in topological order. This could help reduce the iteration time, no. of iterations, and also enable multi-iteration concurrency in pagerank computation. The combination of all of the above methods is the STICD algorithm. [sticd] For dynamic graphs, unchanged components whose ranks are unaffected can be skipped altogether.
Opendatabay - Open Data Marketplace.pptxOpendatabay
Opendatabay.com unlocks the power of data for everyone. Open Data Marketplace fosters a collaborative hub for data enthusiasts to explore, share, and contribute to a vast collection of datasets.
First ever open hub for data enthusiasts to collaborate and innovate. A platform to explore, share, and contribute to a vast collection of datasets. Through robust quality control and innovative technologies like blockchain verification, opendatabay ensures the authenticity and reliability of datasets, empowering users to make data-driven decisions with confidence. Leverage cutting-edge AI technologies to enhance the data exploration, analysis, and discovery experience.
From intelligent search and recommendations to automated data productisation and quotation, Opendatabay AI-driven features streamline the data workflow. Finding the data you need shouldn't be a complex. Opendatabay simplifies the data acquisition process with an intuitive interface and robust search tools. Effortlessly explore, discover, and access the data you need, allowing you to focus on extracting valuable insights. Opendatabay breaks new ground with a dedicated, AI-generated, synthetic datasets.
Leverage these privacy-preserving datasets for training and testing AI models without compromising sensitive information. Opendatabay prioritizes transparency by providing detailed metadata, provenance information, and usage guidelines for each dataset, ensuring users have a comprehensive understanding of the data they're working with. By leveraging a powerful combination of distributed ledger technology and rigorous third-party audits Opendatabay ensures the authenticity and reliability of every dataset. Security is at the core of Opendatabay. Marketplace implements stringent security measures, including encryption, access controls, and regular vulnerability assessments, to safeguard your data and protect your privacy.
Levelwise PageRank with Loop-Based Dead End Handling Strategy : SHORT REPORT ...Subhajit Sahu
Abstract — Levelwise PageRank is an alternative method of PageRank computation which decomposes the input graph into a directed acyclic block-graph of strongly connected components, and processes them in topological order, one level at a time. This enables calculation for ranks in a distributed fashion without per-iteration communication, unlike the standard method where all vertices are processed in each iteration. It however comes with a precondition of the absence of dead ends in the input graph. Here, the native non-distributed performance of Levelwise PageRank was compared against Monolithic PageRank on a CPU as well as a GPU. To ensure a fair comparison, Monolithic PageRank was also performed on a graph where vertices were split by components. Results indicate that Levelwise PageRank is about as fast as Monolithic PageRank on the CPU, but quite a bit slower on the GPU. Slowdown on the GPU is likely caused by a large submission of small workloads, and expected to be non-issue when the computation is performed on massive graphs.
Show drafts
volume_up
Empowering the Data Analytics Ecosystem: A Laser Focus on Value
The data analytics ecosystem thrives when every component functions at its peak, unlocking the true potential of data. Here's a laser focus on key areas for an empowered ecosystem:
1. Democratize Access, Not Data:
Granular Access Controls: Provide users with self-service tools tailored to their specific needs, preventing data overload and misuse.
Data Catalogs: Implement robust data catalogs for easy discovery and understanding of available data sources.
2. Foster Collaboration with Clear Roles:
Data Mesh Architecture: Break down data silos by creating a distributed data ownership model with clear ownership and responsibilities.
Collaborative Workspaces: Utilize interactive platforms where data scientists, analysts, and domain experts can work seamlessly together.
3. Leverage Advanced Analytics Strategically:
AI-powered Automation: Automate repetitive tasks like data cleaning and feature engineering, freeing up data talent for higher-level analysis.
Right-Tool Selection: Strategically choose the most effective advanced analytics techniques (e.g., AI, ML) based on specific business problems.
4. Prioritize Data Quality with Automation:
Automated Data Validation: Implement automated data quality checks to identify and rectify errors at the source, minimizing downstream issues.
Data Lineage Tracking: Track the flow of data throughout the ecosystem, ensuring transparency and facilitating root cause analysis for errors.
5. Cultivate a Data-Driven Mindset:
Metrics-Driven Performance Management: Align KPIs and performance metrics with data-driven insights to ensure actionable decision making.
Data Storytelling Workshops: Equip stakeholders with the skills to translate complex data findings into compelling narratives that drive action.
Benefits of a Precise Ecosystem:
Sharpened Focus: Precise access and clear roles ensure everyone works with the most relevant data, maximizing efficiency.
Actionable Insights: Strategic analytics and automated quality checks lead to more reliable and actionable data insights.
Continuous Improvement: Data-driven performance management fosters a culture of learning and continuous improvement.
Sustainable Growth: Empowered by data, organizations can make informed decisions to drive sustainable growth and innovation.
By focusing on these precise actions, organizations can create an empowered data analytics ecosystem that delivers real value by driving data-driven decisions and maximizing the return on their data investment.
5. Reproducible research
is the practice of distributing all data,
software source code, and tools required
to reproduce the results discussed in a
research publication.
https://www.ctspedia.org/do/view/CTSpedia/ReproducibleResearchStandards
9. Replication vs. Reproducibility
• Replication: Same conclusion new study (gold standard)
• “Again, and Again, and Again …” BR Jasny et. al. Science, 2011. 334(6060) pp. 1225 DOI: 10.1126/science.334.6060.1225
• Replication isn’t always feasible: too big, too costly, too time
consuming, one time event, rare samples
• Reproducibility: Same results from same data and code (minimum
standard for validity)
• “Reproducible Research in Computational Science”. RD Peng Science, 2011. 334 (6060) pp. 1226-1227 DOI: 10.1126/science.1213847
12. Documenting analysis
• Optimal: the instructions should be an automated script
file (ie, “code”)
• Minimum: Written instructions that allow for the complete
reproduction of your analysis
Raw
Data
Processed
Data
Results
Cleaning/
processing
Analysis
13. Research is repetitive
• Replication
• Same assay, different samples
• Longitudinal experiments
http://xkcd.com/242/
14. Doing things by hand is…
• Slow
• Hard to document
• Hard to repeat
15. Exercise 1: Making graphs
• Download height graph XLS: http://bit.ly/2ooMyaO
• Describe how to make a bar graph in excel
18. Details to record for processing/analysis
• What software was used? (R Studio, script)
• Does it support log files/scripts? (yes!)
• What version # and settings were used? (R version 3.3.2)
• What else does the software need to run?
• Computer architecture
• OS/Software/tool/add ons (libraries/packages)
• External databases
21. Version Control
• A system that records changes to a
file or set of files over time so that you
can recall specific versions later
• https://git-scm.com/doc
• Saves EVERYTHING
• Records who made what change
• Identifies conflicting changes
• Not just for code
31. Exercise 2
• Make some changes to the script file in your repo
• add the changes by clicking the checkbox
• Create a new file – don’t click the checkbox next to it
• Commit the changes
• Push the changes to the remote
• Does the new file appear in your remote git repository
35. R Markdown
• Open
• Write
• Embed
• Render
https://www.rstudio.com/wp-content/uploads/2015/02/rmarkdown-cheatsheet.pdf
36. Install knitr and markdown packages
• Tools > install packages
• Enter the package name
(will autocomplete)
• Knitr
• Rmarkdown
• TeX (if you want to knit to
PDF)
• OR
install.packages("knitr”)
37. Open/Create a markdown document
• Make your own Markdown
doc
• Download graph markdown
doc http://bit.ly/2p89drX
38. Write: useful syntax
• Plain text
• *italics* -> italics
• **bold** -> bold
• #Header -> Header (more # decreases size)
• Can also draw:
• Insert pictures
• Ordered and unordered list
• Tables
39. Embed code
• Inline – Use variables in
the human readable text
• `r 2 + 2`
• Code chunks - Include
working code that
generates output
• ```{r}
• #Code goes here
• ```
• Display Options –
40. Render
• Won’t render unless the code runs
with no errors
• You know it should be reproducible
• Render using the knit function
• Output Formats
• Knit HTML
• Knit PDF – requires TeX
• Knit Word
41. Exercise 3
• Open a new markdown document
• Use the formatting commands from the R Markdown cheat
sheet to create a bulleted list that looks like the content of this
slide.
• https://www.rstudio.com/wp-
content/uploads/2015/02/rmarkdown-cheatsheet.pdf
43. Reproducible research checklist
• Think about the entire pipeline: are all the pieces reproducible?
• Is your cleaning/analysis process automated?– guarantees reproducibility
• Are you doing things “by hand”? editing tables/figures; splitting/reformatting data
• Does your software support log files or scripts?
• If no, do you have a detailed description of your process?
• Are you using version control?
• Are you keeping track of your software?
• Computer architecture;
• OS/Software/tool/add ons (libraries/packages)/external databases
• version numbers for everything (when available)
• Are you saving the right files?: if it’s not reproducible, it’s not worth saving
• Save the data and the code
• Data + Code = Output
• Are your reports human and machine readable?
Adapted from: https://github.com/DataScienceSpecialization/courses/blob/master/05_ReproducibleResearch/Checklist/Reproducible%20Research%20Checklist.pdf
44. Need help?
• Email: tobin.magle@colostate.edu
• Data Management Services website:
http://lib.colostate.edu/services/data-management
• Software Carpentry Reproducible Scientific Analysis Lesson:
http://swcarpentry.github.io/r-novice-gapminder/
• Git with R tutorial: http://happygitwithr.com/
• R markdown cheatsheet: https://www.rstudio.com/wp-
content/uploads/2015/02/rmarkdown-cheatsheet.pdf