This document summarizes a research paper that developed models to forecast monthly onion prices in South Korea based on support vector regression (SVR). Two models were proposed: one that used data on monthly shipment amounts from the Agricultural Product Processing Center (APC) enterprise resource planning (ERP) system, and one that did not. The model incorporating the APC ERP data produced more accurate forecasts, with a mean absolute percentage error of 5.72% compared to 10.21% for the alternative model. This suggests that data from mid-distribution agents like APC can improve price predictions for agricultural commodities.
2. Forecasting Agricultural Commodity Price: the Case of onion
*Corresponding Author: Minje Jeong 79 | Page
accurate agricultural commodity price forecasting (Jeong et al., 2017). This is attributed to the fact that
agricultural commodities are distributed to the wholesale and the retail market through mid-distribution agents
such as APC. By acquiring information from mid-distribution agents, e.g. stock amount and shipment amount,
we can predict prices more accurately. For that reason, we focus on APC ERP data, especially on shipment
amount. Although obtaining shipment data from APC ERP is not straightforward, if we could provide evidence
that the data is crucial for forecasting agricultural commodity price, government would pay more attention to
diffusion of APC in agricultural field. The proposed model has the potential of being useful and of interest to the
agricultural sector and government decision-makers for forecasting prices and identifying the impact of market
fundamentals on agricultural product prices.
II. SUPPORT VECTOR REGRESSION
The support vector machine (SVM) combines concepts from abstract Hilbert spaces with modern
optimization techniques (Cui & Curry, 2005). SVM is well known as an effective approach for solving
classification problems (Heo, 2013). Furthermore, SVMs can effectively handle regression and forecasting
tasks. SVMs fall into two categories, SVC (Support Vector Classification) and SVR. When dealing with
regression problems, SVR should be used (Alex & Bernhard, 1998).
We consider a functional relationship to determine the target variable y:
In order to target y, it is required to minimize the distance of the support vector .
subject to:
,
Using slack variables, the minimization problem can be solved under the following conditions:
After setting the formula above as the objective function, appropriate values can be obtained using the
Lagrange Multiplier method.
The following expression can be obtained by the previous derivations. When maximizing it,
3. Forecasting Agricultural Commodity Price: the Case of onion
*Corresponding Author: Minje Jeong 80 | Page
The target variable y can be computed using the following expression:
The result of the SVR depends on several parameters, namely, unit cost, epsilon, and kernel; hence, it
is necessary to find optimized parameters (Lantz, 2014; Jeong et al., 2017). In this study, a polynomial kernel is
used and the parameters epsilon, unit cost, and tolerance are set to the values of 0.02, 5, and 0.04, respectively.
III. DATA AND FORECASTING MODEL
The data used in our research is the monthly shipment amount retrieved from the APC ERP system, the
monthly input amount of wholesale market, and the monthly onion price. We use ERP-generated data from the
APC, which is a leading mid-distribution processing center for onions. Its monthly shipment amount is extracted
from the ERP database. Regarding the input amount of wholesale market, the monthly transaction volumes are
retrieved from the KAMIS website (https://www.kamis.or.kr/customer/main/main.do). KAMIS is a website that
contains agricultural wholesale market information. The data set used for the purposes of this research pertains
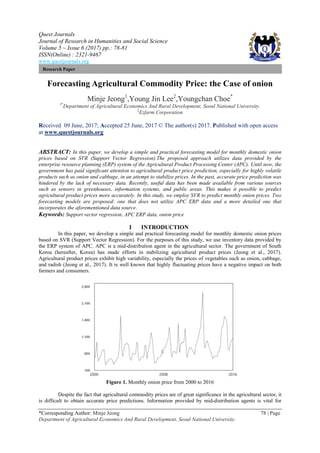
to the period from January 2007 to December 2016. The samples that span from January 2007 to December
2013 and January 2014 to December 2016 are used as training and test data sets, respectively, so as to evaluate
the out-of-sample forecasting accuracy. The description of the data set is provided in Table 1.
Variables Description
Monthly shipment amount Monthly shipment amount from APC
Monthly input amount Monthly input amount of wholesale market
Monthly onion price Monthly onion price of wholesale market
Table 1. Description of data
Initially, we create some autoregressive and moving average variables from the data. Furthermore, we
use correlation analysis and Ridge regression to find appropriate variables that affect monthly onion price to a
certain degree. By means of the aforementioned process, we develop two forecasting models.
The first model is given below:
The alternative model is formulated as follows:
MSA is the monthly shipment amount; MIA represents the monthly input amount; MOP stands for
monthly onion price. Subscript t indicates the t-th month. In order to measure the effect of APC ERP data, we
compare out-of-sample forecast results of the two models. In the alternative model, APC ERP related variables
are removed.
IV. RESULTS
A comparative evaluation of the two alternative forecasting models was conducted. The period is train
data is based on January 2007 to December 2013. Out-of-sample period (test data) is based on January 2014
through December 2016. The relative accuracy of the alternative models is assessed by means of the mean
absolute percentage error (MAPE) metric:
From Table 2, it is observed that the first model (the proposed forecasting model) exhibits better
performance compared to the alternative model in forecasting onion price. The first model yields a MAPE of
5.72%, whereas that of the alternative model is 10.21%. The first model outperforms the alternative model, as it
4. Forecasting Agricultural Commodity Price: the Case of onion
*Corresponding Author: Minje Jeong 81 | Page
yields a nearly 100% lower MAPE value. This result indicates that the APC ERP data is powerful for
forecasting agricultural commodity prices, facilitating price management by government decision makers.
(unit : won)
Period Price First model Alternative model
2016/01 1,673 1,589 1,699
2016/02 1,632 1,580 1,721
2016/03 1,608 1,532 1,687
2016/04 1,386 1,411 1,470
2016/05 734 820 1,022
2016/06 725 835 701
2016/07 707 703 635
2016/08 818 808 739
2016/09 921 935 832
2016/10 973 995 806
2016/11 1,028 1,025 967
2016/12 1,061 1,192 991
MAPE - 5.72% 10.21%
Table 2. Out-of-sample performance
V. CONCLUSION
Given the government’s high interest in controlling agricultural product prices, this study aimed to
provide an assessment of the usefulness of APC ERP data. The APC plays an important role in regional
distribution of agricultural products. Consequently, APC data reflects the regional productivity of agricultural
products and is useful for predicting agricultural commodity prices. The results presented in this study were
encouraging regarding the prediction of agricultural product prices using APC ERP data. Furthermore, we
established that APC ERP data can be useful for predicting agricultural product volumes in our previous
research (Jeong et al., 2017).
Valuable results were obtained by this study; nevertheless, it has two limitations. Firstly, the size of the
data set (2007 – 2016) should be expanded. For a more accurate model, data from at least 2002 should be
considered. Secondly, the market share of the APC in the domestic onion market is less than 10%. To predict
commodity prices more accurately, APCs with more than 20% of the market share are required.
Two directions for future research are suggested. Firstly, it is necessary to consider expert opinion.
Tarek et al. found that the dispersion of expert opinions regarding next period oil price is strongly correlated
with actual price volatility. Sometimes, qualitative information can be a useful predictor for forecasting price.
This finding can be applied to the agricultural sector. Secondly, text mining from agricultural news and reports
could be useful for predicting price. The media has been proven as a useful source of data that can be used for
prediction (e.g., Trusov et al., 2009). Using powerful methods of finding patterns in large text data sets, namely
latent semantic analysis (LSA) and latent Dirichlet allocation (LDA), it is expected to forecast agricultural
product prices effectively.
ACKNOWLEDGMENTS
This research was supported by 'Agricultural Biotechnology Development Program', Ministry of
Agriculture, Food and Rural Affairs.
REFERENCES
[1]. A. Tarek, J. Fred, and P. Axel, Does disagreement among oil price forecasters reflect volatility? Evidence from the ECB surveys,
International Journal of Forecasting, 32, 2016, 1178-1192.
[2]. B. Lantz, Editor, Machine learning with R (Packt Publishing Ltd., Birmingham, 2015).
[3]. D. Cui and D. Curry, Prediction in Marketing Using the Support Vector Machine, Marketing Science, 24(4), 2005, 595-615.
[4]. J. S. Alex and S. Bernhard, A Tutorial on Support Vector Regression, NeuroCOLT2 Technical Report Series, October, 1998.
[5]. M. H.Heo, Applied data analysis using R (FreeAcademy, Seoul, 2014).
[6]. M. Jeong, Y. J. Lee and Y. Choe, Predicting Agricultural Products Volume with APC ERP Data, Journal of Research in Business
and Management, 12(4), 2017, 05-08.
[7]. M Trusov, R. E. Bucklin and K. Pauwels. Effects of word-of-mouth versus traditional marketing: findings from an internet social
networking site, Journal of Marketing, 73(5), 2009, 90-102.