The Chemical Activity Barometer (CAB), the ACC’s first-of-its kind, leading macroeconomic indicator will highlight the peaks and
troughs in the overall U.S. economy and illuminate potential trends in market sectors outside of chemistry. The barometer is a critical
tool for evaluating the direction of the U.S. economy.
Cutting Edge Economic Techniques for Assessing Regional InnovationsPenn State University
Presentation by Rose Baker and David Passmore at 2008 Pennsylvania Workforce Investment Board Symposium in University Park, Pennsylvania, on 25 June 2008.
Cutting Edge Economic Techniques for Assessing Regional InnovationsPenn State University
Presentation by Rose Baker and David Passmore at 2008 Pennsylvania Workforce Investment Board Symposium in University Park, Pennsylvania, on 25 June 2008.
Premiumessays.net is an academic paper writing services provider specializing in essay writing. However we handle other academic papers because we have the writers academically qualified and experienced in handling them.Our major goal is to help you achieve your academic goals. We are commited to helping you get top grades in your academic papers.We desire to help you come up with great essays that meet your lecturer's expectations.
Forecasting Agricultural Commodity Price: the Case of onionQUESTJOURNAL
ABSTRACT: In this paper, we develop a simple and practical forecasting model for monthly domestic onion prices based on SVR (Support Vector Regression).The proposed approach utilizes data provided by the enterprise resource planning (ERP) system of the Agricultural Product Processing Center (APC). Until now, the government has paid significant attention to agricultural product price prediction, especially for highly volatile products such as onion and cabbage, in an attempt to stabilize prices. In the past, accurate price prediction was hindered by the lack of necessary data. Recently, useful data has been made available from various sources such as sensors in greenhouses, information systems, and public areas. This makes it possible to predict agricultural product prices more accurately. In this study, we employ SVR to predict monthly onion prices. Two forecasting models are proposed: one that does not utilize APC ERP data and a more detailed one that incorporates the aforementioned data source
U.S. economic downturn losing steam, flash PMI data show; UK manufacturing must ‘measure up’ for a digital future; UK economy shows green shoots of recovery with growth in third-quarter likely as lockdown eases; Efforts to reshore U.S. manufacturing pick up speed.
Read more from here.
#usmanufacturing #ukmanufacturing #ukeconomy #manufacturing #manufacturingnews #manufacturingsoftware #mrpsoftware #mrpeasy #mrpsystem #erpsystem
The National Association of realtors share any insight that they may have about the economy, full of good statistics, and information pertinent to this economy.
Unemployment Rate: Measuring the Workforce Learn about how the unemployment rate is measured, broader measures of unemployment, and three types of unemployment: structural, cyclical, and frictional.
Lucintel forecasts that central AC segment is expected to show above average growth during the forecast period due to increasing building renovation activities and higher demand for energy efficient HVAC equipment.
Un proyecto de vida, con mucha Alma, la que han puesto los empresarios de Makro en esta propuesta. #AlmaMakro, es un proyecto para tener en cuenta!! Todos les deseamos suerte y los acompañaremos en este proyecto desde nuestro humilde lugar como profesionales de la comunicación
We are providing professional Informatica training. Trainer is experienced professional working for top IT client. Our training will not just be limited to only teaching, we are committed to give you real-time assignments with proper guidance.
Lawrence Livermore National Laboratory
المحرك الصاروخي المعدل بقي حقيقه وقفزة علمية
بدأ اعتمادا علي المحاكاة فقط وصلا للنجاح وطبعا تحت مظلة وزاره الدفاع الامريكيه لتأمين الدعم اللازم و...
اضافة مؤثرة فعلا في تلك الصناعة
وأهم حاجه فيه ان الثرست زاد مع زياده الكفاءه ايضا ده غير ان الثرست نفسه بيعتمد علي الارتفاع
ده هيطور رحلات الذهاب >> والعوده!! كمان بشكل كبير
https://str.llnl.gov/november-2015/burton
MBA 502 Final Project Part II Guidelines and Rubric O.docxjessiehampson
MBA 502 Final Project Part II Guidelines and Rubric
Overview
For this second part of the final project, you will produce a macroeconomic analysis paper related to the publicly traded company and its product or service
that you chose for your microeconomic analysis. First, you will select three macroeconomic variables for the United States that directly impact the supply and
demand of the company’s product or service you previously selected. Second, you will analyze the extent to which macroeconomic conditions in the United
States have affected the financial performance of your chosen company over the last three years using macroeconomic and company performance data. Finally,
you will evaluate how current monetary and/or fiscal policies in the United States are likely to impact your chosen company’s financial performance in the near
future.
This project addresses the following course outcomes:
Assess how macroeconomic variables and policies impact the supply and demand of a company’s products or services based on trends in economic data
Evaluate the effects of macroeconomic variables and policies on the financial performance of companies in the United States
The project includes one milestone, which will be submitted in Module Eight to scaffold learning and ensure quality final submissions. The final macroeconomic
analysis paper will be submitted in Module Ten.
Part II Prompt
Your macroeconomic analysis paper should respond to the following prompt: Analyze the extent to which the macroeconomic environment in the United States
impacts the supply and demand of your chosen company’s product or service and assess the effects of macroeconomic conditions on your company’s financial
performance.
Specifically, the following critical elements must be addressed:
I. Overview: Provide an overview consisting of a brief description of the chosen company, your chosen product or service, and annual sales.
II. Macroeconomic Variables
For this section, you will utilize macroeconomic variables such as GDP growth, inflation, unemployment, and so on to relate trends in data to the supply
and demand of your product or service. Include all calculations in an Excel file.
a) Select three macroeconomic variables in the United States that impact the supply and demand of your chosen product or service. Justify your
selections.
b) Interpret the trends of the three selected macroeconomic variables for the past three years. Be sure to include gathered data. Based on the
trends of the three macroeconomic variables, assess how they will impact the supply and demand of your chosen product or service.
III. Macroeconomic Policies
a) Describe the current monetary and fiscal policies in the United States. Consider including how these policies affect your company and its
products and services.
b) Predict how possible changes in monetary and/or fiscal policy may impact the supply and demand of your product or service. .
MBA 502 Final Project Part II Guidelines and Rubric O.docxalfredacavx97
MBA 502 Final Project Part II Guidelines and Rubric
Overview
For this second part of the final project, you will produce a macroeconomic analysis paper related to the publicly traded company and its product or service
that you chose for your microeconomic analysis. First, you will select three macroeconomic variables for the United States that directly impact the supply and
demand of the company’s product or service you previously selected. Second, you will analyze the extent to which macroeconomic conditions in the United
States have affected the financial performance of your chosen company over the last three years using macroeconomic and company performance data. Finally,
you will evaluate how current monetary and/or fiscal policies in the United States are likely to impact your chosen company’s financial performance in the near
future.
This project addresses the following course outcomes:
Assess how macroeconomic variables and policies impact the supply and demand of a company’s products or services based on trends in economic data
Evaluate the effects of macroeconomic variables and policies on the financial performance of companies in the United States
The project includes one milestone, which will be submitted in Module Eight to scaffold learning and ensure quality final submissions. The final macroeconomic
analysis paper will be submitted in Module Ten.
Part II Prompt
Your macroeconomic analysis paper should respond to the following prompt: Analyze the extent to which the macroeconomic environment in the United States
impacts the supply and demand of your chosen company’s product or service and assess the effects of macroeconomic conditions on your company’s financial
performance.
Specifically, the following critical elements must be addressed:
I. Overview: Provide an overview consisting of a brief description of the chosen company, your chosen product or service, and annual sales.
II. Macroeconomic Variables
For this section, you will utilize macroeconomic variables such as GDP growth, inflation, unemployment, and so on to relate trends in data to the supply
and demand of your product or service. Include all calculations in an Excel file.
a) Select three macroeconomic variables in the United States that impact the supply and demand of your chosen product or service. Justify your
selections.
b) Interpret the trends of the three selected macroeconomic variables for the past three years. Be sure to include gathered data. Based on the
trends of the three macroeconomic variables, assess how they will impact the supply and demand of your chosen product or service.
III. Macroeconomic Policies
a) Describe the current monetary and fiscal policies in the United States. Consider including how these policies affect your company and its
products and services.
b) Predict how possible changes in monetary and/or fiscal policy may impact the supply and demand of your product or service. .
Economic and Financial Analysis of Real Estate / REIT Industry (2014 Class Pr...Alexander M. Stearns
In April 2014, I evaluated the economic and real estate industry conditions and compared the merits of 4 real estate investment trust (REIT) securities through business life cycles, key financials, and DuPont analysis. Attached is a 14p. sample of the 40p. report.
Supply Chain Index: Evaluating the Consumer Value Network -24 JUN 2014Lora Cecere
Executive Overview
Supply chain management is a balancing act. It requires alignment. This is easier said than done. The terms lack definition. What is balance? How can companies judge alignment? What defines improvement? In this series of reports, we want to help.
Day by day leaders are forced to make decisions on priorities and trade-offs like growth, profitability, cycle, and complexity. The supply chain leader is charged with improving the potential of an organization at the intersection of operating margins, inventory turns and case-fill rate1. But are the choices that are made conscious or unconscious? This is a strong factor in determining supply chain excellence. It is our hope that through this series of reports the choices can be made consciously, based on an improved knowledge of what is possible.
In our research, we find that laggards are held hostage and struggle to balance disparate demands with the threat of throwing the supply chain out of alignment. Success requires a nuanced approach using a portfolio of carefully selected metrics to ensure success.
While supply chain excellence does not make a company, it is hard for a company to succeed without it. While the discrete industries are more focused on cycles, the consumer value network is more focused on the optimization of flows.
Progress on the Supply Chain Index
The Supply Chain Index is a new methodology to measure corporate performance on the Supply Chain Effective Frontier. It was defined by the Supply Chain Insights team based on 30 months of research.
We find that supply chain practitioners struggle to manage conflicting priorities. To visualize this, we built the Effective Frontier Model. As shown in Figure 2, the Effective Frontier visualizes the competing priorities of every supply chain leader. Growth and profitability should be maximized, cycle time should be reduced, and complexity should be managed. However, an overweighed focus on any one of the four categories can wreak havoc on the operations of a supply chain. A focus on a singular metric can throw the supply chain out of balance.
The Supply Chain Index is designed to measure progress on balance, and metrics alignment. To build the Index, we chose the metrics of year-over-year growth, return on invested capital (ROIC), operating margin and inventory turns.
Supply Chain Metrics That Matter - A Focus on Pharmaceutical Companies - 27 A...Lora Cecere
Executive Overview
When we compiled the Supply Chains to Admire Report in August 2014, no pharmaceutical company made the list. To make the list, a company had to deliver performance (above average results for the period of 2009-2013 than their peer group on a portfolio of metrics including operating margin, inventory turns and Return on Invested Capital) and drive supply chain improvement (based on the Supply Chain Index) faster than their peer group. We believe both performance and improvement matter.
In the pharmaceutical industry, we find most companies to be stuck. They have either regressed in supply chain performance or they are at the same point as they were a decade ago. For many supply chain leaders that attend conferences, this may seem unfathomable. There is an industry belief that companies have implemented new technologies, and evolved processes, and driven improved balance sheet results.
As we will show in this report, as seen in Figure 4, this is not necessarily the case. On average, AstraZeneca has outperformed Bristol-Myers Squibb, and the industry as a whole, but they are not resilient. They have gone backwards in margin and not sustained inventory turn improvements. In contrast, Bristol-Meyers Squibb has not made progress in either performance or improvement and has remained at the same level of performance, without improvement, throughout the period.
In June of this year, we will publish our fifth analysis of the Supply Chains to Admire. The Supply Chains to Admire methodology celebrates companies that outperform their peer group while driving a faster rate of improvement. Improvement is easier to say than to measure. To create the Supply Chains to Admire, we developed a methodology to measure improvement. It is defined by the Supply Chain Index. To help companies better understand the Supply Chain Index and relative rates of change within an industry, here we dedicate an entire report to the methodology underlying the Index.
Forecasting real economic growth by using the information contents of financial asset prices is one of the main themes in financial studies in recent years. Based on the micro-level stock data from Shenzhen Stock Exchange Market, the paper constructs a cross-section volatility measure using sample stocks, investigates the impact of stock price volatility on economic growth, and forecasts economic growth with stock prices volatility of different firm size. The empirical results indicate that stock price volatility is a good indicator for forecasting economic growth. The results also show that volatility of both large and small firms can be useful in forecasting economic growth. In addition, volatility of small firms can better predict economic growth.
Foundations of Financial Sector Mechanisms and Economic Growth in Emerging Ec...iosrjce
In this paper, we try to uncover the economic foundations of financial sector development and its
impacts on accelerating economic growth in the given context of emerging economies. We theorize and
empirically test a causally-motivated relationship among economic growth and related key financial sector
variables pertinent to this problem. We accomplish this by analyzing a 20 year panel-data constructed for 30
countries falling within the categorization of an ‘emerging economy’. We estimate the appropriate statistical
models along with related diagnostic tests. Finally, we comment on the strengths and weaknesses of our
approach and we try to explicate the economic rationale and justification for our formulation and the evidences
that follow
The European Unemployment Puzzle: implications from population agingGRAPE
We study the link between the evolving age structure of the working population and unemployment. We build a large new Keynesian OLG model with a realistic age structure, labor market frictions, sticky prices, and aggregate shocks. Once calibrated to the European economy, we quantify the extent to which demographic changes over the last three decades have contributed to the decline of the unemployment rate. Our findings yield important implications for the future evolution of unemployment given the anticipated further aging of the working population in Europe. We also quantify the implications for optimal monetary policy: lowering inflation volatility becomes less costly in terms of GDP and unemployment volatility, which hints that optimal monetary policy may be more hawkish in an aging society. Finally, our results also propose a partial reversal of the European-US unemployment puzzle due to the fact that the share of young workers is expected to remain robust in the US.
The Evolution of Non-Banking Financial Companies (NBFCs) in India: Challenges...beulahfernandes8
Role in Financial System
NBFCs are critical in bridging the financial inclusion gap.
They provide specialized financial services that cater to segments often neglected by traditional banks.
Economic Impact
NBFCs contribute significantly to India's GDP.
They support sectors like micro, small, and medium enterprises (MSMEs), housing finance, and personal loans.
how to sell pi coins at high rate quickly.DOT TECH
Where can I sell my pi coins at a high rate.
Pi is not launched yet on any exchange. But one can easily sell his or her pi coins to investors who want to hold pi till mainnet launch.
This means crypto whales want to hold pi. And you can get a good rate for selling pi to them. I will leave the telegram contact of my personal pi vendor below.
A vendor is someone who buys from a miner and resell it to a holder or crypto whale.
Here is the telegram contact of my vendor:
@Pi_vendor_247
USDA Loans in California: A Comprehensive Overview.pptxmarketing367770
USDA Loans in California: A Comprehensive Overview
If you're dreaming of owning a home in California's rural or suburban areas, a USDA loan might be the perfect solution. The U.S. Department of Agriculture (USDA) offers these loans to help low-to-moderate-income individuals and families achieve homeownership.
Key Features of USDA Loans:
Zero Down Payment: USDA loans require no down payment, making homeownership more accessible.
Competitive Interest Rates: These loans often come with lower interest rates compared to conventional loans.
Flexible Credit Requirements: USDA loans have more lenient credit score requirements, helping those with less-than-perfect credit.
Guaranteed Loan Program: The USDA guarantees a portion of the loan, reducing risk for lenders and expanding borrowing options.
Eligibility Criteria:
Location: The property must be located in a USDA-designated rural or suburban area. Many areas in California qualify.
Income Limits: Applicants must meet income guidelines, which vary by region and household size.
Primary Residence: The home must be used as the borrower's primary residence.
Application Process:
Find a USDA-Approved Lender: Not all lenders offer USDA loans, so it's essential to choose one approved by the USDA.
Pre-Qualification: Determine your eligibility and the amount you can borrow.
Property Search: Look for properties in eligible rural or suburban areas.
Loan Application: Submit your application, including financial and personal information.
Processing and Approval: The lender and USDA will review your application. If approved, you can proceed to closing.
USDA loans are an excellent option for those looking to buy a home in California's rural and suburban areas. With no down payment and flexible requirements, these loans make homeownership more attainable for many families. Explore your eligibility today and take the first step toward owning your dream home.
Currently pi network is not tradable on binance or any other exchange because we are still in the enclosed mainnet.
Right now the only way to sell pi coins is by trading with a verified merchant.
What is a pi merchant?
A pi merchant is someone verified by pi network team and allowed to barter pi coins for goods and services.
Since pi network is not doing any pre-sale The only way exchanges like binance/huobi or crypto whales can get pi is by buying from miners. And a merchant stands in between the exchanges and the miners.
I will leave the telegram contact of my personal pi merchant. I and my friends has traded more than 6000pi coins successfully
Tele-gram
@Pi_vendor_247
The secret way to sell pi coins effortlessly.DOT TECH
Well as we all know pi isn't launched yet. But you can still sell your pi coins effortlessly because some whales in China are interested in holding massive pi coins. And they are willing to pay good money for it. If you are interested in selling I will leave a contact for you. Just telegram this number below. I sold about 3000 pi coins to him and he paid me immediately.
Telegram: @Pi_vendor_247
What price will pi network be listed on exchangesDOT TECH
The rate at which pi will be listed is practically unknown. But due to speculations surrounding it the predicted rate is tends to be from 30$ — 50$.
So if you are interested in selling your pi network coins at a high rate tho. Or you can't wait till the mainnet launch in 2026. You can easily trade your pi coins with a merchant.
A merchant is someone who buys pi coins from miners and resell them to Investors looking forward to hold massive quantities till mainnet launch.
I will leave the telegram contact of my personal pi vendor to trade with.
@Pi_vendor_247
If you are looking for a pi coin investor. Then look no further because I have the right one he is a pi vendor (he buy and resell to whales in China). I met him on a crypto conference and ever since I and my friends have sold more than 10k pi coins to him And he bought all and still want more. I will drop his telegram handle below just send him a message.
@Pi_vendor_247
how to sell pi coins on Bitmart crypto exchangeDOT TECH
Yes. Pi network coins can be exchanged but not on bitmart exchange. Because pi network is still in the enclosed mainnet. The only way pioneers are able to trade pi coins is by reselling the pi coins to pi verified merchants.
A verified merchant is someone who buys pi network coins and resell it to exchanges looking forward to hold till mainnet launch.
I will leave the telegram contact of my personal pi merchant to trade with.
@Pi_vendor_247
how to sell pi coins in South Korea profitably.DOT TECH
Yes. You can sell your pi network coins in South Korea or any other country, by finding a verified pi merchant
What is a verified pi merchant?
Since pi network is not launched yet on any exchange, the only way you can sell pi coins is by selling to a verified pi merchant, and this is because pi network is not launched yet on any exchange and no pre-sale or ico offerings Is done on pi.
Since there is no pre-sale, the only way exchanges can get pi is by buying from miners. So a pi merchant facilitates these transactions by acting as a bridge for both transactions.
How can i find a pi vendor/merchant?
Well for those who haven't traded with a pi merchant or who don't already have one. I will leave the telegram id of my personal pi merchant who i trade pi with.
Tele gram: @Pi_vendor_247
#pi #sell #nigeria #pinetwork #picoins #sellpi #Nigerian #tradepi #pinetworkcoins #sellmypi
1. Chemical Activity Barometer
American chemistry is essential to the U.S. economy. Chemistry’s early position in the supply chain gives the American Chemistry
Council (ACC) the ability to identify emerging trends in the U.S. economy and specific sectors outside of, but closely linked to, the
business of chemistry.
The Chemical Activity Barometer (CAB), the ACC’s first-of-its kind, leading macroeconomic indicator will highlight the peaks and
troughs in the overall U.S. economy and illuminate potential trends in market sectors outside of chemistry. The barometer is a critical
tool for evaluating the direction of the U.S. economy.
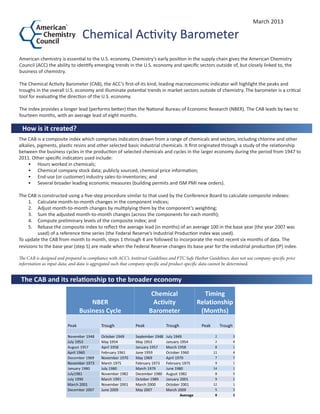
The index provides a longer lead (performs better) than the National Bureau of Economic Research (NBER). The CAB leads by two to
fourteen months, with an average lead of eight months.
How is it created?
The CAB is a composite index which comprises indicators drawn from a range of chemicals and sectors, including chlorine and other
alkalies, pigments, plastic resins and other selected basic industrial chemicals. It first originated through a study of the relationship
between the business cycles in the production of selected chemicals and cycles in the larger economy during the period from 1947 to
2011. Other specific indicators used include:
• Hours worked in chemicals;
• Chemical company stock data; publicly sourced, chemical price information;
• End-use (or customer) industry sales-to-inventories; and
• Several broader leading economic measures (building permits and ISM PMI new orders).
The CAB is constructed using a five-step procedure similar to that used by the Conference Board to calculate composite indexes:
1. Calculate month-to-month changes in the component indices;
2. Adjust month-to-month changes by multiplying them by the component’s weighting;
3. Sum the adjusted month-to-month changes (across the components for each month);
4. Compute preliminary levels of the composite index; and
5. Rebase the composite index to reflect the average lead (in months) of an average 100 in the base year (the year 2007 was
used) of a reference time series (the Federal Reserve’s Industrial Production index was used).
To update the CAB from month to month, steps 1 through 4 are followed to incorporate the most recent six months of data. The
revisions to the base year (step 5) are made when the Federal Reserve changes its base year for the industrial production (IP) index.
The CAB and its relationship to the broader economy
March 2013
The CAB is designed and prepared in compliance with ACC’s Antitrust Guidelines and FTC Safe Harbor Guidelines; does not use company-specific price
information as input data; and data is aggregated such that company-specific and product-specific data cannot be determined.
2. The CAB is a composite index of chemical industry activity that produces a leading indicator of broader economy-wide activity. To
better understand shifts in the business cycle it’s important to distinguish between leading, coincident and lagging indicators of the
cycle, which essentially reflect the timing of their movements:
• Leading indicators (average weekly hours, new orders, consumer expectations, building permits, stock prices, etc.) are those
that consistently turn before the economy does.
• Coincident indicators (employment, industrial production, personal income, business sales, etc.) turn in step with the
economy and track the progress of the business cycle.
• Lagging indicators (inventory-to-sales ratios, change in unit labor costs, C&I loans outstanding, etc.) turn after the economy
turns, thus playing a confirming role.
The three types of indicators are important in their own right although most attention is played to the role of leading indicators be-
cause they tend to shift direction in advance of the business cycle.
Why is it critical?
The CAB:
• Provides earlier forecasting
• Determines turning points and likely future trends of the wider U.S. economy
• Identifies shifts in other industries within the U.S. economy
• Highlights the industry’s role in driving economic growth
The CAB is not a leading index of chemical industry activity. Rather, it is a leading index (barometer) based on chemical industry data
that leads overall industrial production and the overall business cycle. The relationship between the CAB and IP index are presented
in Figures 1 and 2. Figure 1 presents the CAB versus the IP index and Figure 2 presents the year-over-year growth rate of the CAB and
the IP index. The shaded columns in both charts represent periods of recessions. The data presented in both figures are based on
three-month-moving averages to smooth volatility and thus ease comparisons. Analysis of the data indicates a positive correlation of
over 0.90 between the industrial production index and the CAB eight months prior.
The CAB vs. Industrial Production Index (A Long and Short-Term View)
What is a leading indicator?
Index where 2007=100 (3MMA) (Figure 1)
Index where 2007=100 (3MMA) (Figure 3)
% Change Year-over-Year (3MMA) (Figure 2)
% Change Year-over-Year (3MMA) (Figure 4)