Weekly Market Report: Qatar Index Falls 1.73% as Regional Indices Close Mixed
•
0 likes•118 views

The document is a weekly market report that provides the following key information: - Regional stock market indices mostly closed lower for the week, with the exception of Dubai which closed slightly higher. - Trading on the Qatar Stock Exchange declined for the week with the index falling 1.73% and trading value and volume decreasing. - Foreign institutions remained net buyers of Qatari stocks while Qatari retail investors were net sellers. - The report provides commentary on market movements and company-specific news in Qatar and the region.

Recommended
Recommended
More Related Content
What's hot
What's hot (20)
Similar to Weekly Market Report: Qatar Index Falls 1.73% as Regional Indices Close Mixed
Similar to Weekly Market Report: Qatar Index Falls 1.73% as Regional Indices Close Mixed (20)
More from QNB Group
More from QNB Group (20)
Recently uploaded
Recently uploaded (20)
Weekly Market Report: Qatar Index Falls 1.73% as Regional Indices Close Mixed
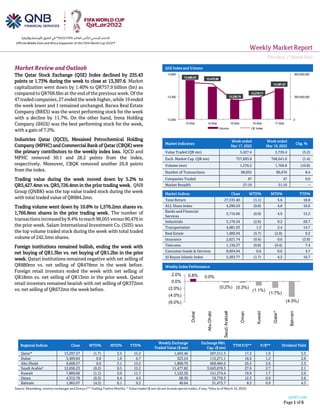
- 1. Weekly MarketReport Thursday,17March2022 qnbfs.com Page 1 of 6 Regional Indices Close WTD% MTD% YTD% Weekly Exchange Traded Value ($ mn) Exchange Mkt. Cap. ($ mn) TTM P/E** P/B** Dividend Yield Qatar* 13,397.57 (1.7) 3.5 15.2 1,493.46 207,511.3 17.2 1.9 3.3 Dubai 3,409.84 0.8 1.6 6.7 323.24 115,271.1 16.0 1.2 2.6 Abu Dhabi 9,608.27 0.0 3.1 13.2 1,808.70 469,484.2 25.5 2.6 2.3 Saudi Arabia# 12,656.23 (0.2) 0.5 12.2 11,477.82 3,043,676.3 27.6 2.7 2.1 Kuwait 7,869.66 (1.1) 3.0 11.7 1,122.36 151,374.4 19.9 1.7 2.0 Oman 4,315.79 (0.3) 6.4 4.5 68.30 19,776.3 12.3 0.9 3.6 Bahrain 1,965.07 (4.3) 0.1 9.3 40.64 31,473.7 8.3 0.9 4.3 Source: Bloomberg, country exchanges and Zawya (** Trailing Twelve Months; * Value traded ($ mn) do not include special trades, if any; #Data as of March 16, 2022) Market Review and Outlook QSE Index and Volume The Qatar Stock Exchange (QSE) Index declined by 235.43 points or 1.73% during the week to close at 13,397.6. Market capitalization went down by 1.40% to QR757.9 billion (bn) as compared to QR768.6bn at the end of the previous week. Of the 47 traded companies, 27 ended the week higher, while 19 ended the week lower and 1 remained unchanged. Barwa Real Estate Company (BRES) was the worst performing stock for the week with a decline by 11.7%. On the other hand, Inma Holding Company (IHGS) was the best performing stock for the week, with a gain of 7.2%. Industries Qatar (IQCD), Mesaieed Petrochemical Holding Company (MPHC) and Commercial Bank of Qatar (CBQK) were the primary contributors to the weekly index loss. IQCD and MPHC removed 50.1 and 28.2 points from the index, respectively. Moreover, CBQK removed another 26.8 points from the index. Trading value during the week moved down by 5.2% to QR5,427.4mn vs. QR5,726.4mn in the prior trading week. QNB Group (QNBK) was the top value traded stock during the week with total traded value of QR884.2mn. Trading volume went down by 10.8% to 1,576.2mn shares vs. 1,766.8mn shares in the prior trading week. The number of transactionsincreasedby8.4% toreach98,055versus90,476in the prior week. Salam International Investment Co. (SIIS) was the top volume traded stock during the week with total traded volume of 242.5mn shares. Foreign institutions remained bullish, ending the week with net buying of QR1.3bn vs. net buying of QR1.2bn in the prior week. Qatari institutions remained negative with net selling of QR880mn vs. net selling of QR478mn in the week before. Foreign retail investors ended the week with net selling of QR18mn vs. net selling of QR13mn in the prior week. Qatari retail investors remained bearish with net selling of QR372mn vs. net selling of QR672mn the week before. Market Indicators Week ended Mar 17, 2022 Week ended Mar 10, 2022 Chg. % Value Traded (QR mn) 5,427.4 5,726.4 (5.2) Exch. Market Cap. (QR mn) 757,893.8 768,641.0 (1.4) Volume (mn) 1,576.2 1,766.8 (10.8) Number of Transactions 98,055 90,476 8.4 Companies Traded 47 47 0.0 Market Breadth 27:19 31:16 – Market Indices Close WTD% MTD% YTD% Total Return 27,335.40 (1.1) 5.6 18.8 ALL Share Index 4,290.59 (0.8) 4.8 16.0 Banks and Financial Services 5,716.96 (0.0) 4.9 15.2 Industrials 5,176.34 (2.6) 9.2 28.7 Transportation 4,081.03 1.2 2.4 14.7 Real Estate 1,900.94 (5.7) (2.0) 9.2 Insurance 2,621.74 (0.4) 0.6 (3.9) Telecoms 1,136.37 (0.8) (0.4) 7.4 Consumer Goods & Services 8,604.94 0.6 0.6 4.7 Al Rayan Islamic Index 5,503.77 (1.7) 4.2 16.7 Weekly Index Performance 13,489.03 13,470.86 13,236.76 13,279.71 13,397.57 0 250,000,000 500,000,000 13,000 13,300 13,600 13-Mar 14-Mar 15-Mar 16-Mar 17-Mar Volume QE Index 0.8% 0.0% (0.2%) (0.3%) (1.1%) (1.7%) (4.3%) (6.0%) (4.0%) (2.0%) 0.0% 2.0% Dubai Abu Dhabi Saudi Arabia# Oman Kuwait Qatar* Bahrain
- 2. qnbfs.com Page 2 of 6 Economic, Market & Company News QE Index, QE Al Rayan Islamic Index and QE All share constituents April 1st 2022 – Doha Bank and Qatar Navigation will join the QE Index. They replace United Development and Vodafone. Qatar Navigation will join QE Al Rayan Islamic Index, while Al Khaleej Takaful Group and Qatar Islamic Insurance will be removed from the Index. No changes in the constituents of QE All Share Index and QE Sectors Indices. (QSE) QGMD reports net loss of QR0.4mn in 4Q2021 – Qatari German Company for Medical Devices (QGMD) reported net loss of QR0.4mn in 4Q2021 as compared to net profit of QR1.5mn in 4Q2020 and net profit of QR0.2mn in 3Q2021. EPS amounted to QR0.010 in FY2021 as compared to QR0.008 in FY2020. (QSE) MCCS posts 57.1% YoY decrease but 18.6% QoQ increase in net profit in 4Q2021 – Mannai Corporation's (MCCS) net profit declined 57.1% YoY (but rose 18.6% on QoQ basis) to QR86.2mn in 4Q2021.The Company’s revenue came in at QR3791.7mn in 4Q2021, which represents a decrease of 1.8% YoY. However, on QoQ basis, revenue rose 13.9%. EPS amounted to QR0.605 in FY2021 as compared to QR0.004 in FY2020; in addition to the proposed cash dividends of QR0.30. (QSE) Barzan Gas Plant to produce 1.4bn standard cubic feet of sales gas daily – The Barzan Gas Plant, which is operated by Qatargas on behalf of its shareholders – QatarEnergy (93%) and ExxonMobil (7%), is capable of producing almost 1.4bn standard cubic feet of sales gas per day for local power generation and water desalination. This includes 2,000 tons of ethane per day as feedstock for the local petrochemicals industry; 1,500 tons per day of liquid petroleum gas (LPG) for export to international markets; 30,000 barrels of condensate per day for processing in the Laffan Refinery and export to international markets; and 3,500 tons of sulphur per day for export to international markets. It will also produce associated hydrocarbon products for supply to local refinery and petrochemical industries as well as for export to international markets. During construction phase, the project workforce peaked at 30,000 workers on site and achieved an outstanding safety performance, including over 130mn manhours without a lost time incident (LTI). His Highness the Amir Sheikh Tamim bin Hamad al-Thani inaugurated the Barzan Gas Plant in a special ceremony held at Ras Laffan Industrial City Tuesday. At the inauguration ceremony, HE the Minister of State for Energy Affairs Saad bin Sherida al-Kaabi, also the President and CEO of QatarEnergy, extended his thanks and appreciation to His Highness the Amir for his unlimited guidance and support of the energy sector. (Gulf-Times.com) Al-Kuwari meets US Treasury Secretary Janet Yellen – HE the Minister of Finance Ali bin Ahmed al-Kuwari had a virtual meeting with his United States counterpart Treasury Secretary Janet Yellen on Monday. During the meeting, the Qatar-US strategic partnership was discussed, as well as plans to enhance bilateral relations. (Gulf-Times.com) Supreme Committee holds first preparatory meeting on National Development Strategy – Prime Minister and Minister of Interior, HE Sheikh Khalid bin Khalifa bin Abdulaziz Al Thani, Chairman of the Supreme Committee for the Preparation of the Third National Development Strategy for Qatar, chaired the first meeting of the committee. The meeting represents the official launch of the process of preparing the third development strategy and an extension of the strategic planning in the country to achieve the Qatar National Vision 2030 (QNV) and its development pillars, which stipulated transforming Qatar into an advanced country capable of achieving sustainable development and ensuring a high standard of living for its people and future generations. (Peninsula Qatar) Inflation rates in Qatar within safe range – Participants in a workshop organized within the activities of the Community Financial Culture Week accompanying the 8th Doha Islamic Finance Conference, organized by Bait Al Mashura Finance Consultations, confirmed that inflation rates in Qatar are within the safe range, as estimates indicate that the average annual inflation rate in Qatar will record 3.1 percent in 2022, and then decline to reach the level of 2.1 percent in 2023.In this context, Dr. Omar Al Ababneh, Sharia Supervisory and Audit Officer at Bait Al Mashura, stressed during the workshop that inflation rates in Qatar are within the safe range, as estimates by the British "Oxford Economics" institution indicate that the average annual inflation rate in Qatar will record 3.1 percent this year, and then drop to reach the level of 2.1 percent next year. He pointed out that the International Monetary Fund, in turn, expected inflation rates in Qatar to reach the level of 3.2 percent in 2022, and the Economist Intelligence unit of the British Economist magazine suggested that the inflation rate in Qatar would reach 3 percent during the current year, as expected by the HSBC recorded inflation rates to the level of 2.6 percent during this year. (Peninsula Qatar) Qatar 2022 positions Qatar as leading global investment destination – Qatar’s hosting of the upcoming FIFA World Cup 2022 enhances the country’s position as a leading global destination for business and investment, show-casing its attractive legislative, regulatory and institutional environment and advanced infrastructures, Qatar Chamber’s (QC) Chairman Sheikh Khalifa bin Jassim bin Mohammed Al Thani has said. Talking to QNA, he said Qatar’s economy will continue to grow and develop after the country hosts the tournament, especially with its track record of success achieved over the past several years, as well as in building various attractions that increase its global consumer confidence. He added that hosting world’s largest sporting event will draw the world’s attention to Qatar, particularly during November and December. This will provide opportunities for investors and businessmen from different countries across the world to explore Qatar and its economy, and to discover the available opportunities here. This will in turn contribute to attracting more foreign investments to the country, and will enhance Qatar’s status as a leading global centre for business and investment. On the most prominent growth drivers in 2022, Sheikh Khalifa indicated that many sectors will be developed, such as tourism, knowledge economy, agriculture, and industry among other important sectors. (Peninsula Qatar)
- 3. qnbfs.com Page 3 of 6 Qatar Stock Exchange Top Gainers Top Decliners Source: Qatar Stock Exchange (QSE) Source: Qatar Stock Exchange (QSE) Most Active Shares by Value (QR Million) Most Active Shares by Volume (Million) Source: Qatar Stock Exchange (QSE) Source: Qatar Stock Exchange (QSE) Investor Trading Percentage to Total Value Traded Net Traded Value by Nationality (QR Million) Source: Qatar Stock Exchange (QSE) Source: Qatar Stock Exchange (QSE) 7.2% 6.6% 4.2% 2.6% 2.5% 0.0% 3.0% 6.0% 9.0% Islamic Holding Group Dlala Brokerage & Investment Holding Company Al Khaleej Takaful Insurance Company Qatar National Cement Company QLM Life & Medical Insurance Company -11.7% -8.9% -7.9% -6.6% -6.6% -15.0% -10.0% -5.0% 0.0% Barwa Real Estate Company Mesaieed Petrochemical Holding Company Qatar Aluminium Manufacturing Company Qatar Electricity & Water Company United Development Company 884.2 583.7 495.1 473.0 380.2 0.0 400.0 800.0 1,200.0 QNB Group Masraf Al Rayan Investment Holding Group Qatar Islamic Bank Industries Qatar 242.5 203.8 149.2 137.6 113.9 0.0 100.0 200.0 300.0 Salam International Investment Limited Investment Holding Group Qatar Aluminium Manufacturing Company Mazaya Qatar Real Estate Development Masraf Al Rayan 0% 20% 40% 60% 80% 100% Buy Sell 32.82% 39.63% 9.78% 25.86% 12.09% 12.42% 45.31% 22.09% Qatari Individuals Qatari Institutions Non-Qatari Individuals Non-Qatari Institutions 2,330 3,140 3,582 1,888 -1,252 1,252 -2,000 -1,000 0 1,000 2,000 3,000 4,000 Qatari Non-Qatari Net Investment Total Sold Total Bought
- 4. qnbfs.com Page 4 of 6 TECHNICAL ANALYSIS OF THE QSE INDEX Source: Bloomberg The QE Index moved lower by -1.73% over the week and closed at 13,397.57; it witnessed correction after reaching the upper side of the uptrend channel line seen on the price graph. Volumes were down than the previous two occasions of the up-move, indicating not enough strength to pull the index down. The index is likely to rebound anytime soon and may attempt to retest the upper band of the channel line. Our resistance level remains around the 13,800 level and our support level remains at 12,000 points. DEFINITIONS OF KEY TERMS USED IN TECHNICAL ANALYSIS RSI (Relative Strength Index) indicator – RSI is a momentum oscillator that measures the speedand change of price movements. The RSI oscillates between 0 to 100. The index is deemed to be overbought once the RSI approaches the 70 level, indicating that a correction is likely. On the other hand, if the RSI approaches 30, it is an indication that the index may be getting oversold and therefore likely to bounce back. MACD (Moving Average Convergence Divergence) indicator – The indicator consists of the MACD line and a signal line. The divergence or the convergence of the MACD line with the signal line indicates the strength in the momentum during the uptrend or downtrend, as the case may be. When the MACD crosses the signal line from below and trades above it, it gives a positive indication. The reverse is the situation for a bearish trend. Candlestick chart – A candlestick chart is a price chart that displays the high, low, open, and close for a security. The ‘body’ of the chart is portion between the open and close price, while the high and low intraday movements form the ‘shadow’. The candlestick may represent any time frame. We use a one-day candlestick chart (every candlestick represents one trading day) in our analysis. Doji candlestick pattern – A Doji candlestick is formed when a security's open and close are practically equal. The pattern indicates indecisiveness, and based on preceding price actions and future confirmation, may indicate a bullish or bearish trend reversal. ShootingStar/Inverted Hammer candlestick patterns – These candlestick patterns have a small real body (open price and close price are near to each other), and a long upper shadow (large intraday movement on the upside). The Shooting Star is a bearish reversal pattern that forms after a rally. The Inverted Hammer looks exactly like a Shooting Star, but forms after a downtrend. Inverted Hammers represent a potential bullish trend reversal.
- 5. qnbfs.com Page 5 of 6 Source: Bloomberg Com pan y Nam e P rice March 17 % Ch an ge WTD % Ch an ge YTD Marke t Cap. QR Million TTM P /E P /B Div. Yie ld Qatar National Bank 22.75 0.22 12.68 210,129 17.2 2.7 2.4 Qatar Islamic Bank 22.70 (0.53) 23.84 53,639 16.0 2.6 2.5 Commercial Bank of Qatar 7.26 (4.51) 7.50 29,363 14.3 1.6 2.2 Doha Bank 2.73 (1.52) (14.69) 8,464 16.4 0.8 2.7 Al Ahli Bank 3.90 0.03 6.97 9,955 13.9 1.5 3.7 Qatar International Islamic Bank 10.40 1.36 12.92 15,742 17.4 2.4 3.6 Masraf Al Rayan 5.17 1.49 11.31 48,035 23.1 2.0 3.3 Qatar First Bank 1.53 (3.13) (2.69) 1,210 8.3 2.1 N/A National Leasing 0.92 0.87 (1.81) 457 N/A 0.7 N/A Dlala Holding 1.61 6.64 30.23 457 53.3 2.1 N/A Qatar & Oman Investment 0.90 (2.60) 10.57 284 58.1 1.0 N/A Islamic Holding Group 5.90 7.20 49.53 334 54.8 2.3 0.8 Ban kin g an d Fin an cial Se rvice s 378,067 Zad Holding 17.34 1.52 3.83 4,520 23.4 3.0 3.7 Qatar German Co. for Medical Devices 2.46 (4.43) (22.64) 284 244.2 8.6 N/A Salam International Investment 1.11 0.27 35.16 1,265 23.9 0.8 N/A Baladna 1.46 0.00 1.25 2,781 21.0 1.2 3.6 Medicare Group 7.36 1.71 (13.36) 2,072 26.0 2.1 24.4 Qatar Cinema & Film Distribution 3.69 1.99 3.94 232 75.4 1.7 1.6 Qatar Fuel 18.60 0.65 1.75 18,493 19.1 2.0 4.1 Qatar Meat and Livestock 3.22 0.94 (10.38) 580 N/A 2.1 3.1 Mannai Corp. 7.80 0.03 64.32 3,559 13.0 1.7 0.1 Al Meera Consumer Goods 19.45 (5.03) (0.77) 3,890 19.7 2.6 4.6 Con sum e r Goods an d Se rvice s 37,677 Qatar Industrial Manufacturing 3.24 0.90 5.50 1,539 11.2 0.9 3.7 Qatar National Cement 5.35 2.65 4.90 3,496 15.5 1.1 5.6 Industries Qatar 19.25 (2.28) 24.27 116,463 14.4 2.9 5.2 Qatari Investors Group 2.44 1.71 9.95 3,035 22.1 1.1 2.5 Qatar Electricity and Water 18.38 (6.61) 10.72 20,218 13.7 1.7 4.4 Aamal 1.24 0.98 13.93 7,781 25.4 1.0 3.2 Gulf International Services 1.95 0.62 13.64 3,624 66.9 1.1 N/A Mesaieed Petrochemical Holding 2.74 (8.93) 31.24 34,461 18.5 2.0 4.0 Invesment Holding Group 2.36 1.38 91.62 1,955 73.7 2.3 N/A Qatar Aluminum Manufacturing 2.46 (7.90) 36.54 13,722 16.5 2.2 3.3 In dustrials 206,292 Qatar Insurance 2.52 (1.18) (8.36) 8,231 17.6 1.0 N/A QLM Life & Medical Insurance 5.25 2.54 3.96 1,838 17.4 3.1 4.2 Doha Insurance 1.87 (6.46) (2.66) 935 12.7 0.8 6.4 Qatar General Insurance & Reinsurance 1.91 (4.70) (4.75) 1,667 17.8 0.3 N/A Al Khaleej Takaful Insurance 3.87 4.17 7.61 989 24.5 1.9 1.3 Qatar Islamic Insurance 8.58 0.75 7.29 1,287 15.9 3.2 3.8 In suran ce 14,946 United Development 1.51 (6.56) (1.95) 5,347 16.4 0.5 3.6 Barwa Real Estate 3.44 (11.68) 12.42 13,386 12.0 0.6 5.1 Ezdan Real Estate 1.43 0.92 6.56 37,904 98.6 1.2 N/A Mazaya Qatar Real Estate Development 0.92 0.11 0.11 1,066 34.7 0.8 3.3 Re al Estate 57,703 Ooredoo 7.36 (0.42) 4.83 23,572 625.2 1.1 4.1 Vodafone Qatar 1.67 (1.53) 0.12 7,055 21.4 1.5 3.6 Te le com s 30,627 Qatar Navigation (Milaha) 8.54 1.10 11.86 9,707 13.4 0.7 3.5 Gulf Warehousing 4.20 (0.94) (7.45) 246 11.0 1.2 2.4 Qatar Gas Transport (Nakilat) 3.71 1.50 12.42 20,554 15.1 2.3 3.2 Tran sportation 30,508 Qatar Exch an ge 757,894
- 6. qnbfs.com Contacts QNB Financial Services Co. W.L.L. Contact Center: (+974) 4476 6666 info@qnbfs.com.qa Doha, Qatar Saugata Sarkar, CFA, CAIA Head of Research saugata.sarkar@qnbfs.com.qa Shahan Keushgerian Senior Research Analyst shahan.keushgerian@qnbfs.com.qa . Disclaimer and Copyright Notice: This publication has been prepared by QNB Financial Services Co. W.L.L. (“QNBFS”) a wholly-owned subsidiary of Qatar National Bank (Q.P.S.C.). QNB FS is regulated by the Qatar Financial Markets Authority and the Qatar Exchange. Qatar National Bank (Q.P.S.C.) is regulated by the Qatar Central Bank. This publication expresses the views and opinions of QNBFS at a given time only. It is not an offer, promotion or recommendation to buy or sell securities or other investments, nor is it intended to constitute legal, tax, accounting, or financial advice. QNBFS accepts no liability whatsoever for any direct or indirect losses arising from use of this report. Any investment decision should depend on the individual circumstances of the investor and be based on specifically engaged investment advice. We therefore strongly advise potential investors to seek independent professional advice before making any investment decision. Although the information in this report has been obtained from sources that QNBFS believes to be reliable, we have not independently verified such information and it may not be accurate or complete. QNBFS does not make any representations or warranties as to the accuracy and completeness of the information it may contain, and declines any liability in that respect. For reports dealing with Technical Analysis, expressed opinions and/or recommendations may be different or contrary to the opinions/recommendations of QNBFS Fundamental Research as a result of depending solely on the historical technical data (price and volume). QNBFS reserves the right to amend the views and opinions expressed in this publication at any time. It may also express viewpoints or make investment decisions that differ significantly from, or even contradict, the views and opinions included in this report. This report may not be reproduced in whole or in part without permission from QNBFS. COPYRIGHT: No part of this document may be reproduced without the explicit written permission of QNBFS. Page 6 of 6