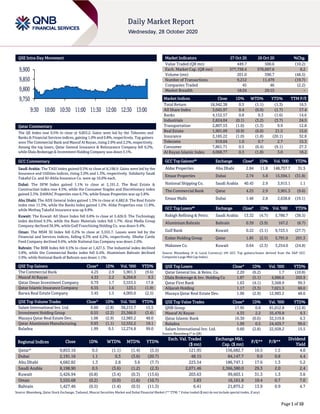
QNBFS Daily Market Report October 28, 2020
•
0 likes•94 views

The QE Index rose 0.5% to close at 9,853.2. Gains were led by the Telecoms and Banks & Financial Services indices, gaining 1.0% and 0.8%, respectively.

Recommended
Recommended
More Related Content
What's hot
What's hot (20)
Similar to QNBFS Daily Market Report October 28, 2020
Similar to QNBFS Daily Market Report October 28, 2020 (20)
More from QNB Group
More from QNB Group (20)
Recently uploaded
Recently uploaded (20)
QNBFS Daily Market Report October 28, 2020
- 1. Page 1 of 10 QSE Intra-Day Movement Qatar Commentary The QE Index rose 0.5% to close at 9,853.2. Gains were led by the Telecoms and Banks & Financial Services indices, gaining 1.0% and 0.8%, respectively. Top gainers were The Commercial Bank and Masraf Al Rayan, rising 2.9% and 2.2%, respectively. Among the top losers, Qatar General Insurance & Reinsurance Company fell 6.2%, while Dlala Brokerage & Investment Holding Company was down 5.1%. GCC Commentary Saudi Arabia: The TASI Index gained 0.5% to close at 8,198.9. Gains were led by the Insurance and Utilities indices, rising 3.0% and 1.3%, respectively. Solidarity Saudi Takaful Co. and Al-Ahlia Insurance Co. were up 10.0% each. Dubai: The DFM Index gained 1.1% to close at 2,191.2. The Real Estate & Construction index rose 4.5%, while the Consumer Staples and Discretionary index gained 3.3%. DAMAC Properties rose 6.7%, while Emaar Properties was up 5.8%. Abu Dhabi: The ADX General Index gained 1.3% to close at 4,682.8. The Real Estate index rose 11.3%, while the Banks index gained 1.2%. Aldar Properties rose 11.8%, while Methaq Takaful Insurance was up 9.8%. Kuwait: The Kuwait All Share Index fell 0.8% to close at 5,426.9. The Technology index declined 9.3%, while the Basic Materials index fell 1.7%. Alrai Media Group Company declined 36.9%, while Gulf Franchising Holding Co. was down 9.4%. Oman: The MSM 30 Index fell 0.2% to close at 3,555.7. Losses were led by the Financial and Services indices, falling 0.3% and 0.2%, respectively. Dhofar Cattle Feed Company declined 9.6%, while National Gas Company was down 2.0%. Bahrain: The BHB Index fell 0.5% to close at 1,427.5. The Industrial index declined 3.8%, while the Commercial Banks index fell 0.4%. Aluminium Bahrain declined 3.9%, while National Bank of Bahrain was down 1.1%. QSE Top Gainers Close* 1D% Vol. ‘000 YTD% The Commercial Bank 4.25 2.9 3,901.3 (9.6) Masraf Al Rayan 4.33 2.2 8,204.8 9.3 Qatar Oman Investment Company 0.79 1.7 3,553.5 17.8 Qatar Islamic Insurance Company 6.55 1.6 123.1 (1.9) Barwa Real Estate Company 3.45 1.5 4,005.0 (2.5) QSE Top Volume Trades Close* 1D% Vol. ‘000 YTD% Salam International Inv. Ltd. 0.60 (2.8) 38,215.7 15.5 Investment Holding Group 0.55 (2.2) 25,366.0 (3.4) Mazaya Qatar Real Estate Dev. 1.06 (2.9) 12,983.2 48.0 Qatar Aluminium Manufacturing 0.93 (1.1) 12,552.2 19.1 Baladna 1.99 0.5 12,274.8 99.0 Market Indicators 27 Oct 20 26 Oct 20 %Chg. Value Traded (QR mn) 449.7 500.6 (10.2) Exch. Market Cap. (QR mn) 577,738.4 576,697.6 0.2 Volume (mn) 201.0 390.7 (48.5) Number of Transactions 9,212 11,479 (19.7) Companies Traded 45 46 (2.2) Market Breadth 18:24 29:15 – Market Indices Close 1D% WTD% YTD% TTM P/E Total Return 18,942.38 0.5 (1.1) (1.3) 16.5 All Share Index 3,045.97 0.4 (0.9) (1.7) 17.4 Banks 4,152.57 0.8 0.3 (1.6) 14.6 Industrials 2,824.04 (0.1) (3.2) (3.7) 24.5 Transportation 2,807.53 (1.0) (1.3) 9.9 12.8 Real Estate 1,901.09 (0.9) (6.0) 21.5 15.0 Insurance 2,185.22 (1.0) (1.8) (20.1) 32.8 Telecoms 919.04 1.0 0.7 2.7 15.3 Consumer 7,861.71 0.5 (0.4) (9.1) 27.3 Al Rayan Islamic Index 4,068.77 0.3 (1.8) 3.0 18.2 GCC Top Gainers## Exchange Close# 1D% Vol. ‘000 YTD% Aldar Properties Abu Dhabi 2.84 11.8 148,757.7 31.5 Emaar Properties Dubai 2.74 5.8 15,594.1 (31.8) National Shipping Co. Saudi Arabia 40.45 2.9 3,915.1 1.1 The Commercial Bank Qatar 4.25 2.9 3,901.3 (9.6) Emaar Malls Dubai 1.48 2.8 2,638.8 (19.1) GCC Top Losers## Exchange Close# 1D% Vol. ‘000 YTD% Rabigh Refining & Petro. Saudi Arabia 13.32 (4.7) 5,780.7 (38.5) Aluminium Bahrain Bahrain 0.39 (3.9) 167.2 (6.7) Gulf Bank Kuwait 0.22 (3.1) 9,723.5 (27.7) Ezdan Holding Group Qatar 1.85 (2.5) 5,791.0 201.3 Mabanee Co. Kuwait 0.64 (2.3) 3,254.0 (24.8) Source: Bloomberg (# in Local Currency) (## GCC Top gainers/losers derived from the S&P GCC Composite Large Mid Cap Index) QSE Top Losers Close* 1D% Vol. ‘000 YTD% Qatar General Ins. & Reins. Co. 2.20 (6.2) 1.7 (10.8) Dlala Brokerage & Inv. Holding Co 1.87 (5.1) 4,986.6 205.9 Qatar First Bank 1.63 (4.1) 3,568.9 99.3 Alijarah Holding 1.17 (3.3) 7,021.3 66.0 Mazaya Qatar Real Estate Dev. 1.06 (2.9) 12,983.2 48.0 QSE Top Value Trades Close* 1D% Val. ‘000 YTD% QNB Group 17.95 0.8 81,012.8 (12.8) Masraf Al Rayan 4.33 2.2 35,470.8 9.3 Qatar Islamic Bank 16.30 (0.6) 32,519.8 6.3 Baladna 1.99 0.5 24,429.7 99.0 Salam International Inv. Ltd. 0.60 (2.8) 22,928.2 15.5 Source: Bloomberg (* in QR) Regional Indices Close 1D% WTD% MTD% YTD% Exch. Val. Traded ($ mn) Exchange Mkt. Cap. ($ mn) P/E** P/B** Dividend Yield Qatar* 9,853.16 0.5 (1.1) (1.4) (5.5) 121.95 156,682.7 16.5 1.5 4.0 Dubai 2,191.16 1.1 0.3 (3.6) (20.7) 48.15 84,147.7 9.0 0.8 4.4 Abu Dhabi 4,682.82 1.3 2.8 3.6 (7.7) 223.54 186,747.1 17.6 1.3 5.2 Saudi Arabia 8,198.90 0.5 (3.6) (1.2) (2.3) 2,071.46 2,366,380.0 29.3 2.0 2.4 Kuwait 5,426.94 (0.8) (3.4) (0.3) (13.6) 203.63 99,603.1 31.3 1.3 3.6 Oman 3,555.68 (0.2) (0.0) (1.6) (10.7) 3.83 16,161.8 10.4 0.7 7.0 Bahrain 1,427.46 (0.5) (1.4) (0.5) (11.3) 6.41 21,875.2 13.9 0.9 4.7 Source: Bloomberg, Qatar Stock Exchange, Tadawul, Muscat Securities Market and Dubai Financial Market (** TTM; * Value traded ($ mn) do not include special trades, if any) 9,750 9,800 9,850 9,900 9:30 10:00 10:30 11:00 11:30 12:00 12:30 13:00
- 2. Page 2 of 10 Qatar Market Commentary The QE Index rose 0.5% to close at 9,853.2. The Telecoms and Banks & Financial Services indices led the gains. The index rose on the back of buying support from Foreign shareholders despite selling pressure from Qatari, GCC and Arab shareholders. The Commercial Bank and Masraf Al Rayan were the top gainers, rising 2.9% and 2.2%, respectively. Among the top losers, Qatar General Insurance & Reinsurance Company fell 6.2%, while Dlala Brokerage & Investment Holding Company was down 5.1%. Volume of shares traded on Tuesday fell by 48.5% to 201.0mn from 390.7mn on Monday. Further, as compared to the 30-day moving average of 317.7mn, volume for the day was 36.7% lower. Salam International Investment Limited and Investment Holding Group were the most active stocks, contributing 19.0% and 12.6% to the total volume, respectively. Source: Qatar Stock Exchange (*as a % of traded value) Earnings Releases, Global Economic Data and Earnings Calendar Earnings Releases Company Market Currency Revenue (mn) 3Q2020 % Change YoY Operating Profit (mn) 3Q2020 % Change YoY Net Profit (mn) 3Q2020 % Change YoY Electrical Industries Co. Saudi Arabia SR 148.1 11.5% 24.8 12.6% 10.6 115.6% Halwani Bros. Co. Saudi Arabia SR 256.2 15.8% 35.8 302.2% 25.0 N/A Arabian Cement Co. Saudi Arabia SR 237.0 22.5% 89.4 11.2% 78.9 30.2% Eastern Province Cement Co. Saudi Arabia SR 159.0 -8.6% 40.0 8.1% 43.0 19.4% Rabigh Refining and Petrochem. Co. Saudi Arabia SR 7,052.0 -19.3% (288.0) N/A (610.0) N/A Saudi Industrial Development Co. Saudi Arabia SR 39.7 -13.7% (2.2) N/A 5.1 N/A Walaa Cooperative Insurance Co. Saudi Arabia SR 412.6 45.9% – – 4.6 16.4% Dubai Financial Market Dubai AED 90.4 11.9% – – 41.1 35.3% Ras Alkhaima National Insurance Abu Dhabi AED 143.0 -7.7% – – 5.5 N/A Abu Dhabi Aviation Co. Abu Dhabi AED 301.8 -45.2% – – 60.2 -18.3% Source: Company data, DFM, ADX, MSM, TASI, BHB. Global Economic Data Date Market Source Indicator Period Actual Consensus Previous 10/27 EU European Central Bank M3 Money Supply YoY Sep 10.4% 9.6% 9.5% 10/27 France INSEE National Statistics Office PPI MoM Sep 0.2% – 0.1% 10/27 France INSEE National Statistics Office PPI YoY Sep -2.4% – -2.5% Source: Bloomberg (s.a. = seasonally adjusted; n.s.a. = non-seasonally adjusted; w.d.a. = working day adjusted) Earnings Calendar Tickers Company Name Date of reporting 3Q2020 results No. of days remaining Status MRDS Mazaya Qatar Real Estate Development 28-Oct-20 0 Due QOIS Qatar Oman Investment Company 28-Oct-20 0 Due MPHC Mesaieed Petrochemical Holding Company 28-Oct-20 0 Due SIIS Salam International Investment Limited 28-Oct-20 0 Due DOHI Doha Insurance Group 28-Oct-20 0 Due QFBQ Qatar First Bank 28-Oct-20 0 Due MERS Al Meera Consumer Goods Company 28-Oct-20 0 Due ORDS Ooredoo 28-Oct-20 0 Due UDCD United Development Company 28-Oct-20 0 Due AHCS Aamal Company 28-Oct-20 0 Due GISS Gulf International Services 29-Oct-20 1 Due Overall Activity Buy %* Sell %* Net (QR) Qatari Individuals 28.88% 37.03% (36,662,147.6) Qatari Institutions 17.06% 15.28% 8,005,461.4 Qatari 45.94% 52.32% (28,656,686.2) GCC Individuals 0.89% 0.76% 609,112.8 GCC Institutions 1.25% 2.09% (3,763,781.3) GCC 2.14% 2.84% (3,154,668.5) Arab Individuals 10.18% 10.19% (65,650.5) Arab Institutions 0.00% – 6,578.0 Arab 10.18% 10.19% (59,072.5) Foreigners Individuals 3.38% 4.08% (3,164,348.4) Foreigners Institutions 38.36% 30.57% 35,034,775.6 Foreigners 41.74% 34.65% 31,870,427.2
- 3. Page 3 of 10 Earnings Calendar Tickers Company Name Date of reporting 3Q2020 results No. of days remaining Status NLCS Alijarah Holding 29-Oct-20 1 Due ZHCD Zad Holding Company 29-Oct-20 1 Due AKHI Al Khaleej Takaful Insurance Company 29-Oct-20 1 Due Source: QSE News Qatar IQCD net profit declined 19.2% YoY but rose 0.7% YoY on adjusted basis, ahead of our estimate –Industries Qatar's (IQCD) net profit declined 19.2% YoY (but rose 65.6% on QoQ basis) to QR466.0mn in 3Q2020. However, adjusted net profit (excluding one-offs such as impairment losses on property, plant, equipment and intangible asset) increased 0.7% YoY to QR580.8mn, which was 12.4% ahead of income expectations of QR516.7mn for 3Q2020. The company's Revenue came in at QR1,590.2mn in 3Q2020, which represents an increase of 13.2% YoY. However, on QoQ basis Revenue fell 34.3%. In 9M2020, IQCD posted net profit of QR951.3mn as compared to QR2,036.5mn in 9M2019. Reported EPS amounted to QR0.16 in 9M2020 as compared to QR0.34 in 9M2019. The Group revenue amounted to QR8.0bn (assuming proportionate consolidation), down by 21%, as compared to QR10.2bn for the same period last year. The Group recorded EPS of QR0.16 for the nine months period ended September 30, 2020, as compared to QR0.34 for the same period last year. In line with the requirements of IFRS, 25% of QAFCO’s net profits for the nine months period ended September 30, 2020 have been reported directly as part of the Group’s retained earnings, instead of reporting the same as part of Group’s net profit (attributable to equity holders of the Parent) within the consolidated income statement. When considering the profitability of the Group including 25% of QAFCO’s profits for the nine months period ended September 30, 2020, the net profit (normalized profits) for the period would reach to QR1.1bn, down by 48%, as compared to QR2.0bn for the same period last year. EBITDA for the period reached QR2.6bn, compared to QR3.2bn for the same period of last year. Year-to-date financial performance was impacted by several factors including the pandemic, weaker crude prices and a notable decline in product demand owing to weaker GDP growth, lack of infrastructure investments and subdued consumer & industrial participation. These adverse conditions directly translated into declining commodity prices, where blended selling prices declined by 10% versus last year, translating into a reduction of QR0.9bn inGroup’s earnings (normalized). The major reduction was noted in the petrochemicals segment which accounted for QR0.6bn, while fertilizer segment accounted for QR0.3bn of the total reduction. Group sales volumes declined by 20% versus nine months period of 2019, driven by a combination of reasons including weaker demand, lower production on account of facilities’ mothballing in the steel segment and periodic planned and unplanned maintenance. The decline in sales volumes was also attributed to a temporary sales & operating arrangement for QAFCO trains 1-4 until July 31, 2020, where sales volumes relating to QAFCO trains 1-4 were not recognized in the IQ books. The temporary sales & operating arrangement has now been replaced with a unified Gas Sales and Purchase Agreement (GSPA) covering QAFCO trains 1-6 and Qatar Melamine Company (QMC) with Qatar Petroleum, effective from August 1, 2020. The new GSPA was part of a bundled deal, along with the acquisition of 25% stake in QAFCO. This new agreement will now allow IQ to recognize the sales volumes of QAFCO trains 1-4, going forward. The new GSPA is expected to bring additional financial benefits to the Group driven via improved profitability margins. The Group’s profitability was also impacted due to booking of one-off impairment loss amounting to QR1.2bn recognized in relation to mothballing of certain Qatar Steel’s production facilities and QR153mn of impairment loss booked in relation to QMC facilities, as the melamine prices continue to remain under pressure. These one-off impairment losses were partially offset by a fair value gain recognized amounting to QR1.2bn in relation to 75% stake in QAFCO, as the Group now controls the company. The original stake QAFCO (75%) was previously accounted for by the Group as a joint venture using the equity accounting method. In line with the requirements of International Financial Reporting Standards (IFRS), since QAFCO is now a 100% owned subsidiary, at the date of reclassification of investment in QAFCO as a subsidiary i.e. January 01, 2020, the Group was required to re-measure its investment in QAFCO to its acquisition-date fair value. Compared to the previous quarter of 2020, the Group revenue and net profit (normalized) increased by 22% and 50% respectively. The recovery was mainly attributed to the improved product prices in the current quarter. This sequential increase in prices across key products was noted on the back of crude price recovery, supply shortages due to back-to-back hurricanes in the US causing disruptions for many producers and an overall deferral of new capacity additions amid uncertainties as a result of the spread of COVID- 19 pandemic. On the demand side, recent recoveries were evident amid continuous unprecedented stimulus and lifting of lockdown in major markets. Operating costs also have generally declined in line with the optimization initiatives implemented across the Group. Production volumes also improved during the quarter, as there were no major shutdowns during the quarter. The Group’s financial position continue to remain robust despite several macro-economic headwinds, with the liquidity position at the end of September 30, 2020 reaching QR8.86bn in cash and bank balances, after accounting for a QR2.4bn dividend payment for 2019 and cash paid for the QAFCO transaction (net of cash acquired along with acquisition). Currently, the Group has no debt obligations. Group’s total assets and total equity reached QR35.2bn and QR32.9bn, respectively, as at September 30, 2020.During the period, the Group generated positive operating cash flows of QR2.5bn, with
- 4. Page 4 of 10 a free cash flow of QR2.18bn. IQ’s ability to generate positive operating cash flows in such distressed market conditions is a testament to Group’s efficient cash flow generation capabilities, effective cost structure and robust working capital management, which could safeguard the Group against any unexpected adversities. (QNB FS Research, Company Press Release, QSE) DHBK posts 9.7% YoY decrease but 53.3% QoQ increase in net profit in 3Q2020, above our estimate – Doha Bank's (DHBK) net profit declined 9.7% YoY (but rose 53.3% on QoQ basis) to QR270.8mn in 3Q2020, above our estimate of QR227.1mn (variation of +19.3%). Net interest income increased 18.1% YoY and 20.4% QoQ in 3Q2020 to QR630.3mn. The company's net operating income came in at QR788.4mn in 3Q2020, which remained almost flat YoY (+16% QoQ). EPS amounted to QR0.09 in 3Q2020 as compared to QR0.10 in 3Q2019 (2Q2020: QR0.06). The bank's total assets stood at QR106.5bn at the end of September 30, 2020, down 0.3% YoY (-1.5% QoQ). Loans and advances to customers were QR63.1bn, registering a fall of 2.9% YoY at the end of September 30, 2020. However, on QoQ basis loans and advances to customers increased 1.1%. Customer deposits declined 5.2% YoY and 0.4% QoQ to reach QR55.8bn at the end of September 30, 2020. In 9M2020, DHBK recorded net profit of QR771.5mn compared to QR818.5mn in 9M2019. EQS amounted to QR0.25 in 9M2020 as compared to QR0.26 in 9M2019. DHBK’s Chairman of the Board Of Directors, Sheikh Fahad bin Mohammad bin Jabor Al Thani said that the bank has made significant progress in improving the cost management and efficient utilization of resources where the operating cost for the period improved by 3.3% as compared to same period last year thus reducing the cost to income ratio to 30.5% from 33.6% showing bank’s productive operational performance. He also pointed out that the total financial investment portfolio stood at QR25.4bn as compared to QR27.8bn for the same period in 2019. DHBK’s Managing Director, Sheikh Abdul Rehman bin Mohammad bin Jabor Al Thani said, “The total shareholder’s equity stood at QR13.8bn as on September 30, 2020 registering a growth of 2.3%. The bank continued to strengthen its key capitalization ratios, where the total capital adequacy ratio of the bank increased to 18.38% as on September 30, 2020 from 16.85% as compared to the same period last year. The bank, given the scale of its operations, has achieved a return on the average assets of 0.96% as on September 30, 2020”. (QNB FS Research, QSE, Peninsula Qatar) IGRD's bottom line rises 69.3% YoY and 98.2% QoQ in 3Q2020, above our estimate – Investment Holding Group's (IGRD) net profit rose 69.3% YoY (+98.2% QoQ) to QR11.3mn in 3Q2020, above our estimate of QR7.4mn. In 9M2020, IGRD posted net income of QR26.7mn as compared to QR34.5mn in 9M2019. EPS amounted to QR0.032 in 9M2020 as compared to QR0.042 in 9M2019. (QNB FS Research, QSE) BRES' net profit declines 53.3% YoY and 66.4% QoQ in 3Q2020 – Barwa Real Estate Company's (BRES) net profit declined 53.3% YoY (-66.4% QoQ) to QR137.4mn in 3Q2020.The company's ‘Net rental and finance lease income’ came in at QR265.2mn in 3Q2020, which represents an increase of 23.1% YoY (+3.3% QoQ). In 9M2020, BRES posted net income of QR723.5mn as compared to QR804.1mn in 9M2019. EPS amounted to QR0.19 in 9M2020 as compared to QR0.21 in 9M2019. The decrease in net profit during the third quarter of the year, when compared to the same period last year, is due to non-recurring items in nature such as impairment losses. The company, however, succeeded in enhancing its continuous operating income, as net rental income increased by 15%, in addition to the decrease in general and administrative expenses by 12%, as well as a decrease in net financing costs, which contributed to the increase in the group’s net cash income for the period. BRES’ assets reached QR32bn, with total equity attributable to the shareholders of the parent company amounting to QR19.8bn. During the third quarter of 2020, the group signed a financing contract worth QR2.725bn to refinance existing credit facilities, in order to strengthen the group’s cash position during the coming period. (QSE, Peninsula Qatar, Gulf-Times.com) QISI posts 38.8% YoY increase but 8.7% QoQ decline in net profit in 3Q2020 – Qatar Islamic Insurance Group's (QISI) net profit rose 38.8% YoY (but declined 8.7% on QoQ basis) to QR16.0mn in 3Q2020.The company's Total Revenues came in at QR25.7mn in 3Q2020, which represents an increase of 10.0% YoY. However, on QoQ basis Total Revenues fell 3.3%. EPS amounted to QR0.106 in 3Q2020 as compared to QR0.077 in 3Q2019 (2Q2020: QR0.117). In 9M2020, QISI recorded net profit of QR58.4mn as compared to QR59.8mn in 9M2020. EPS stood at QR0.390 in 9M2020 compared to QR0.398mn in 9M2019. (QSE) QIMD's net profit declines 43.7% YoY and 4.0% QoQ in 3Q2020 – Qatar Industrial Manufacturing Company's (QIMD) net profit declined 43.7% YoY (-4.0% QoQ) to QR17.2mn in 3Q2020.The company's Sales came in at QR99.4mn in 3Q2020, which represents an increase of 16.6% YoY (+23.2% QoQ). EPS amounted to QR0.04 in 3Q2020 as compared to QR0.06 in 3Q2019. In 9M2020, QIMD posted net profit of QR59.5mn as compared to QR100.5mn in 9M2019. EPS amounted to QR0.13 compared to QR0.21 in 9M2019. (QSE, Peninsula Qatar) QGRI's bottom line rises 211.4% QoQ in 3Q2020 – Qatar General Insurance & Reinsurance Company (QGRI) reported net profit of QR47.7mn in 3Q2020 as compared to net loss of QR14.9mn in 3Q2019 and net profit of QR15.3mn in 2Q2020 (+211.4% QoQ). In 9M2020, QGRI recorded net profit of QR74.2mn as compared to QR8.1mn in 9M2019. EPS amounted to QR0.085 in 9M2020 as compared to QR0.009 in 9M2019. (QSE) QATI's bottom line declines 19.7% YoY in 3Q2020 – Qatar Insurance Company (QATI) reported net profit of QR60.5mn in 3Q2020 as compared to net profit of QR75.3mn in 3Q2019 (- 19.7% YoY) and net loss of QR22.8mn in 2Q2020. In 9M2020, QATI posted net loss of QR147.4mn as compared to net profit of QR485.2mn in 9M2019. Loss per share amounted to QR0.073 in 9M2020 as compared to EPS of QR0.130 in 9M2019. (QSE) IQCD appoints CEO for Qatar Fuel Additives and Qatar Steel – Industries Qatar (IQCD) has appointed Abdulqader Ahmed Al- Ahmed and Abdul-Rahman Ali Al-Abdulla as the Chief Executive Officer (CEO) of Qatar Fuel Additives and Qatar Steel respectively. Qatar Fuel Additives Chief executive’s appointment is effective from November 01, 2020 and that of the Qatar Steel from January 01, 2021. Both of them would also
- 5. Page 5 of 10 become the member of the board of directors of IQCD, effective from their date of appointment. (Gulf-Times.com) QGTS transitions LNG Lijmiliya to in-house management – Qatar Gas Transport Company (QGTS, Nakilat) has assumed full ship management and operations of Q-Max LNG carrier Lijmiliya from Shell International Trading and Shipping Company Limited (Shell) with effect from October 27, 2020, as part of the second phase of its planned fleet management transition program. With a cargo carrying capacity of 263,300 cubic meters, Lijmiliya is wholly owned by Nakilat and chartered by Qatargas. The vessel built in South Korea by Daewoo Shipbuilding & Marine Engineering was delivered in January 2009 and has been in service ever since. Lijmiliya is the seventh vessel that will come under the management of Nakilat Shipping Qatar Ltd. (NSQL) this year, bringing the total number of vessels managed by NSQL to 26, comprising of 22 LNG and 4 LPG carriers. (QSE) Qatar posts QR6.4bn trade surplus in September – Qatar’s foreign merchandise trade balance showed a surplus of QR 6.4bn almost, a decrease of 49.7% compared to September 2019 and a decrease of 7% compared to August 2020, according to the preliminary figures for the value of exports of domestic goods, re-exports and imports for September 2020 released by Planning and Statistics Authority (PSA). In September, the total exports of goods including exports of goods of domestic origin and re-exports amounted to around QR13.4bn, showing a decrease of 33.7% compared to September 2019, and a decrease of 4.4% compared to August 2020. The imports of goods in September 2020 amounted to around QR7bn, showing a decrease of 6.4% over September 2019. However, on a MoM basis the imports decrease by 1.9% compared to August 2020. The YoY decrease in total exports was mainly due to lower exports of Petroleum gases and other gaseous hydrocarbons (LNG, condensates, propane, butane, etc.) reaching QR8.2bn approximately in September 2020, a decrease of 33.5%, Petroleum oils and oils from bituminous minerals (crude) reaching QR1.9bn nearly, decreased by 42% and decrease in the petroleum oils and oils from bituminous minerals (not crude) reaching 0.8bn, decreased by 54.7%. In September 2020, India was at the top of the countries of destination of Qatar’s exports with close to QR 2.4bn, a share of 18% of total exports, followed by China with almost QR 2.1bn and a share of 15.4%, Japan with about QR1.7bn, a share of 12.9%. The group of ‘Parts of Aeroplanes or Helicopter’ was at the top of the imported group of commodities, with QR0.22bn, showing a decrease of 26.3%. In the second place was Turbojets, Turbo propellers and Other Gas Turbines; Parts Thereof’ with QR0.21bn, showing a decrease of 62.3% and in third place was ‘Motor cars and other motor vehicles for the transport of persons’ with QR0.20bn, a decrease of 29.1%. In September 2020, China was the leading country of origin for Qatar’s imports with about QR1.6bn, a share of 22.3% of the imports, followed by the US with QR0.7bn almost, a share of 10.7%, and India with QR0.4bn, a share of 5.9%. India emerges top exports destination. (Qatar Tribune) International UN: Global foreign direct investment halved in first six months of 2020 – Global foreign direct investment (FDI) plunged by 49% in the first half of 2020 from the same period a year ago and is on course to fall as much as 40% for the year, driven by fears of a deep recession, the United Nations (UN) said. FDI flows to European economies turned negative for the first time ever, falling to -$7bn from $202bn. Flows to the United States fell by 61% to $51bn, the U.N. Conference for Trade and Development (UNCTAD) said in a report. Global FDI fell to $399bn as multinationals postponed investments to preserve cash, it said. “Global FDI flows for the first half of this year went down by close to half ... It was more drastic than we expected for the whole year,” James Zhan, director of UNCTAD’s investment and enterprise division, told a news conference. The flows are expected to decline by 30% to 40% this year and “moderately” in 2021, by 5% to 10%, Zhan said. The figures cover cross-border mergers and acquisitions, new greenfield investment projects and project finance deals. Industrialized countries, which normally account for some 80% of global transactions, were hardest hit, with flows falling to $98bn, a level last seen in 1994, the report said. Among major FDI recipients in 2019, flows declined most strongly in Italy, the United States, Brazil and Australia. China was bucking the trend, Zhan said. Most FDI investment in China was in electronic commerce services, specialized technology services, and research and development, Zhan said. (Reuters) US core capital good orders hit six-year high; consumer confidence ebbs – New orders for key US-made capital goods increased to six-year high in September, wrapping up a quarter of potentially record growth in business spending and the economy, thanks to fiscal stimulus aimed at softening the blow from the COVID-19 pandemic. But the report from the Commerce Department on Tuesday also showed shipments of these goods rising modestly last month, supporting expectations of slower economic activity heading into the fourth quarter. That was reinforced by a dip in consumer confidence this month. The reports came ahead of next Tuesday’s fiercely contested presidential election. A more than $3tn government rescue package early this year provided a lifeline for many businesses and the unemployed, helping to boost consumer spending and the housing market. But funding has dried up and new coronavirus infections are surging across the country. Orders for non-defense capital goods excluding aircraft, a closely watched proxy for business spending plans, increased 1.0% last month to the highest level since September 2014. These so-called core capital goods orders rose 2.1% in August. Economists polled by Reuters had forecast core capital goods orders increasing 0.5%. Though core capital goods orders have pulled above their pre-pandemic level, they were down 0.5% YoY in September. Orders last month were lifted by increased demand for primary metals, fabricated metal products and computers and electronic products. But orders for machinery and electrical equipment, appliances and components fell. (Reuters) BRC: Prices in UK shops fall more slowly in October – Prices in British shops fell more slowly this month than in September, reflecting the smallest discounting for non-food items since the start of the coronavirus pandemic, figures from the British Retail Consortium showed. The BRC said its shop price index showed a 1.2% annual fall in prices in October compared with a 1.6% drop in September. Food prices rose by an annual 1.2% in both months, but the fall in non-food prices slowed to 2.7%
- 6. Page 6 of 10 from September’s 3.2%. Official data showed purchases of non- food items exceed pre-pandemic levels last month, but BRC chief executive Helen Dickinson said she expected the squeeze on many retailers’ profit margins to continue. “Given the wider economic context, with stricter restrictions and a possible rise in unemployment, we are likely to see continuing discounts in non-food for months to come,” she said. The BRC also warned prices would rise if Britain failed to secure a zero-tariff trade agreement with the European Union before post-Brexit transition arrangements expire at the end of this year. (Reuters) CBI: UK retail sales slump in October as economy wanes – Britain’s retail recovery, a bright spot in the COVID-hit economy, came to a halt this month after several months of improvement, an industry survey showed. The Confederation of British Industry’s (CBI) monthly gauge of retail sales fell to - 23 in October, its lowest level since June, after hitting an 18- month high of +11 in September. A Reuters poll of economists had pointed to a reading of +1. The figures follow other surveys in recent days that show consumer confidence declined sharply this month amid a second wave of the COVID-19 pandemic. “The fall in retail sales in October is a warning sign of a further loss of momentum in the economy as coronavirus cases pick up and restrictions are tightened across many parts of the country,” CBI economist Ben Jones said. He warned that retailers faced a difficult Christmas trading period. Retailers’ expectations for sales in November fell sharply and they increasingly expect to cut orders to suppliers, the survey showed. (Reuters) Spain to hike taxes on large companies, high earners in 2021 budget – Spain’s left-wing government announced plans on Tuesday to raise taxes on large companies and high earners to fund increased spending on social care and infrastructure as part of its progressive agenda. With the coronavirus-battered economy expected to shrink an unprecedented 11.2% this year and tax revenues due to ebb 7.6%, the government aims to boost 2021 budget revenues by 6.8bn Euros ($8.04bn), giving it more firepower to spend its way out of the crisis. “This budget cannot be postponed. This budget is essential for the modernization and recovery of our economy,” Prime Minister Pedro Sanchez said in a televised statement. Governments around the world have so far said very little about how they plan to pay for the cost of unprecedented levels of state support to virus-hit economies. Even the International Monetary Fund last week said the priority for now was to control the pandemic and then foster economic recovery. Spain’s 2021 budget is due to reduce tax exemptions for dividends from subsidiaries earned by big corporations to 95% from 100%, while real-estate investment trusts will face a minimum tax rate of 15% of earnings, Sanchez said. Previously, such companies benefited from several reductions. However, some of the more radical measures agreed when Sanchez’s Socialists formed a coalition with the far-left Podemos party last year have been watered down. (Reuters) China phases out use of 'X-factor' in managing Yuan value – Chinese banks have suspended the use of a tool used to influence the value of the Yuan, the country’s currency trading system said on Tuesday, in a move analysts took to mean it is willing to allow some weakness in its currency. The People’s Bank of China’s foreign exchange system issued a statement confirming a Reuters report that banks participating in a daily operation to determine the Yuan’s trading mid-point have phased out use of the counter-cyclical factor, or so-called X- factor, in its formula. Some analysts said they were not surprised at the move as the use of this X-factor - an adjustment contributor banks make to the daily trade-weighted reference rate the PBOC uses to guide the Yuan - was meant to dampen depreciation pressure, and its effect has diminished recently as the Yuan rallied. The China Foreign Exchange Trade System said in a statement it would change the price adjustment model of the central parity rate of the Yuan versus the dollar to promote transparency and efficiency. (Reuters) Brazil eyes GDP per capita growth of 37% over next decade – Brazil’s government on Tuesday outlined a long-term roadmap for the economy, based on three scenarios of economic and fiscal reforms that could lift gross domestic product per capita by as much as 37% over the next decade. According to the “Federal Development Strategy” in the Official Gazette, that is the upper end of the scale resulting from a series of “transformative” reforms and educational advances over 2021- 2031 that would deliver average annual GDP growth of 3.5%. This would lift Brazil’s GDP per capita in US dollars above that of other emerging nations such as Argentina, Poland and Croatia by 2031, and closer to Chile and Hungary, countries ranked highly in the Human Development Index. Brazil will go into next year with a record debt and deficit around 95% and 12% of GDP, respectively, due to huge emergency expenditure this year to tackle the COVID-19 pandemic. According to the strategy plan, signed off by President Jair Bolsonaro and Economy Minister Paulo Guedes, the base case is for an accumulated rise in GDP per capita of 19.1% over the next decade, on annual average GDP growth of 2.2%. After the financial damage wrought by COVID-19, “If the necessary reforms are not implemented, the likelihood of a fiscal crisis and economic growth crisis in the coming years will increase significantly,” the plan said. (Reuters) Regional Gulf economies set for steep contractions this year before rebounding – The six-member GCC faces a steep economic contraction this year before partially rebounding in 2021, with most countries facing sharper declines than previously estimated, a quarterly Reuters poll showed. Analysts in the October 13-25 poll maintained their view that the region’s heavy dependence on hydrocarbons left it particularly hard-hit by the coronavirus crisis because of its effect on oil demand and prices. New lockdown measures as infections continue to soar in the United States, Europe and elsewhere, could exacerbate already depressed economic activity. Saudi Arabia, the region’s largest economy, is expected to face a GDP contraction of 5.1% this year and rebound to 3.1% growth next year and 2.7% growth in 2022. A poll conducted three months ago saw the world’s largest oil exporter contracting 5.2% in 2020. “The region is now facing tough policy choices. Fiscal support is still needed to fight persistent and rising infections, already showing up in Europe and the US,” analysts at NBK noted. “But from a medium-term perspective, governments should aim to achieve fiscal and external sector sustainability in the likely
- 7. Page 7 of 10 scenario of low oil prices.” The UAE, which has seen a surge in new COVID-19 cases in the past month or so, is expected to see GDP decline 6.0% this year, grow 2.7% next year and expand 3.8% in 2022. In July, analysts expected a 5.1% decline in 2020 and 2.6% growth in 2021. “The UAE economy will suffer a deeper contraction this year than we anticipated in May,” the Institute of International Finance said in a research note. “Dubai’s economy may contract by at least 8%, more than Abu Dhabi, as its large exposure to tourism, aviation, and other services makes it more vulnerable to the effects of the pandemic,” the IIF said, adding that output declined 9% in the first half of the year and employment dropped by 10%. Median forecasts for Kuwait expected a 6.3% contraction this year, 2.6% growth next year and 3.3% growth in 2022. Three months ago it was seen shrinking 6.1% in 2020 and expanding 2.5% in 2021. Qatar’s forecast for this year was unchanged at a 4.0% contraction, while expectations for growth next year improved to 3.0% from 2.8% and it was seen expanding 3.4% in 2022. Oman and Bahrain’s forecasts were weaker, seen shrinking 4.9% and 4.8% this year respectively from contractions of 4.7% and 4.4% seen in July. Oman is expected to grow 2.5% next year, versus a July estimate of 3.0%, and 2.7% in 2022. Bahrain’s 2.6% growth forecast for 2021 was unchanged and it was expected to grow 2.1% in 2022. “Things are looking less favorable, particularly for leisure and tourism,” Senior Economist at Oxford Economics, Maya Senussi said on Oman. “Non-residents are still barred from visiting as we head into the peak season,” she said, adding analysts generally have a clearer view of how the dual shock has influenced activity. (Reuters) Germany hoping Saudi Arabia will ramp up hydrogen production – Germany needs “enormous” amounts of green hydrogen to action its transformation from a carbon economy and is looking abroad for potential supplies it can’t meet from domestic production, Economy and Energy Minister, Peter Altmaier said on Tuesday. Germany is cooperating with Saudi Arabia on its plans and “at end of day hopes Saudi Arabia will invest heavily in green hydrogen, Germany can offer the technology,” he said. (Bloomberg) Aramco Trading unit ATC to reach 6mn bpd in deals in 3 years – Saudi Aramco’s energy trading business ATC expects to increase its volume of deals to 6mn bpd of oil and refined products within 3 years, unit’s CEO, Ibrahim Al-Buainain said in interview with consultant Gulf Intelligence. ATC currently trades almost 5mn bpd. Target for increase is one year later than was announced in September. Around 40% of ATC’s traded volume this year is bought from and sold to third parties. “We’ve been increasing third-party trading in the market.” (Bloomberg) NCB posts 23.8% YoY rise in net profit to SR3,158mn in 3Q2020 – The National Commercial Bank (NCB) recorded net profit of SR3,158mn in 3Q2020, an increase of 23.8% YoY. Total operating profit rose 12.8% YoY to SR5,638mn in 3Q2020. Total revenue for special commissions/investments fell 6.5% YoY to SR4,792mn in 3Q2020. Total assets stood at SR577.1bn at the end of September 30, 2020 as compared to SR496.6bn at the end of September 30, 2019. Loans and Advances Portfolio (Financing & Investment) stood at SR336.9bn (+20.7% YoY), while customer deposits stood at SR408.5bn (+20.0% YoY) at the end of September 30, 2020. EPS came in at SR2.59 in 9M2020 as compared to SR2.58 in 9M2019. (Tadawul) ALINMA's net profit falls 11.8% YoY to SR629mn in 3Q2020 – Alinma Bank (ALINMA) recorded net profit of SR629mn in 3Q2020, registering decrease of 11.8% YoY. Total operating profit rose 3.3% YoY to SR1,489mn in 3Q2020. Total revenue for special commissions/investments fell 7.3% YoY to SR1,337mn in 3Q2020. Total assets stood at SR147.9bn at the end of September 30, 2020 as compared to SR128.0bn at the end of September 30, 2019. Loans and advances stood at SR105.3bn (+16.0% YoY), while customer deposits stood at SR111.3bn (+11.5% YoY) at the end of September 30, 2020. EPS came in at SR0.79 in 9M2020 as compared to SR1.02 in 9M2019. (Tadawul) Tadawul triples daily trading limits for new listings – Saudi Arabia’s stock market tripled the daily trading limits for companies making their debut as it looks to absorb billions of dollars chasing new listings. Starting November 8, newly listed stocks will be allowed to rise or fall 30% on their first three days of trading, up from the current 10% limit, the exchange known as Tadawul said. The daily limits will revert to 10% from the fourth day. Tadawul’s Nomu-Parallel Market segment, which has lighter listing requirements, will expand daily price fluctuation limits to 30% from 20% for all listed securities. Saudi Arabia has seen a flurry of new share offerings this year, in contrast to some of its neighbors. Grocery chain BinDawood Holding Co. attracted almost $29bn in bids from investors for its $585mn share sale this month, and the stock surged about 10% in each of the first three days of trading. Dr. Sulaiman Al Habib Medical Services Group, the biggest Saudi Arabian listing this year, saw orders for more than 80 times the shares on offer and the stock has almost doubled since the listing in March. (Bloomberg) Dubai airport passenger traffic may fall 70% this year, CEO says – Dubai airport, the world’s busiest for international travel before the coronavirus crisis, could see passenger traffic fall by as much 70% this year, its Chief Executive said. A wave of new infections around the world ahead of the typically busy Christmas and year-end travel season has brought further uncertainty to an industry already decimated by the pandemic. Dubai airport could see passenger traffic fall 55-65% this year to 30-40 million passengers if it continues on its currently trajectory, CEO, Paul Griffiths told Reuters. The airport is handling around a million monthly passengers - more than it had projected - though Griffiths cautioned traffic could fall by as much as 70% this year. Flights have gradually increased since a UAE ban on most passenger services was lifted in June. Dubai state carrier Emirates is flying to around 100 destinations. (Reuters) Dubai to launch 'Nasdaq' market for emerging firms, SMEs – Dubai plans to launch a “Nasdaq Dubai Growth Market” to help emerging companies, and small and medium enterprises (SMEs) attract investors and finance their projects, Crown Prince of the Emirate, Sheikh Hamdan bin Mohammed bin Rashid Al- Maktoum, said on Tuesday. The Nasdaq Dubai Growth Market will allow SMEs to list if they are valued below $250mn, with a minimum operating history of one year, compared to three years for Nasdaq Dubai’s main market, the Dubai Media Office said. Nasdaq Dubai is collaborating with government bodies,
- 8. Page 8 of 10 UAE free zones and expert advisory companies as partners to launch the growth market in early 2021, it said. (Reuters) Dubai’s peak power demand rises in sign of economic recovery – Demand for power in Dubai has risen from last year, according to the head of the emirate’s state-owned utility, a possible sign the economy is recovering from the coronavirus pandemic. Dubai’s summertime peak electricity load rose by 6%, or roughly 500 megawatts, from 2019, the Chief Executive Officer of Dubai Electricity and Water Authority, Saeed Al Tayer said. “We are actually very optimistic because we thought that we would have negative growth,” Al Tayer said on Tuesday. “In the first quarter, it was negative growth. But then when the government decided to return to the offices and return to work,” demand climbed, he said. Chief Executive Officer at Dubai Electricity and Water Authority, Saeed Al Tayer also discussed the projects the company will undertake in the coming months. (Bloomberg) ADNOC pipeline investor Galaxy starts marketing three-part bonds – Galaxy Pipeline Assets, owned by a consortium of investors that took a stake in Abu Dhabi ADNOC’s gas pipeline assets, started marketing a three-part dollar bond on Tuesday, a document showed. The amortizing bonds are split into three tranches ranging from seven and a half to 20 years, according to the document issued by one of the banks leading the deal and seen by Reuters. They are being marketed with initial price guidance ranging from around 1.875% to 3.375%. The issuer is owned by a consortium of investors including GIP, Brookfield, Singapore sovereign wealth fund GIC and European gas infrastructure owner and operator SNAM, which bought a stake in ADNOC’s gas pipeline assets earlier this year. (Reuters) ADNOC pipeline investor Galaxy sells $4bn in three-part bonds – Galaxy Pipeline Assets, owned by a consortium of investors that took a stake in Abu Dhabi National Oil Company’s (ADNOC) gas pipeline assets, sold $4bn in a three-part bond sale on Tuesday, a document showed. It sold $1.1bn in bonds maturing in September 2027 at 1.75%, $1.55bn in a tranche maturing in March 2036 at 2.625% and $1.35bn in bonds maturing in September 2040 at 3.25%, the document from one of the banks arranging the deal showed. Galaxy began marketing the bonds, which are amortizing, with initial price guidance ranging from around 1.875% to 3.375%. Amortizing bonds are structured in a way that gradually reduces their value over a fixed period of time, meaning the borrower pays off the full amount before the final maturity date. (Reuters) NBQ's net profit falls 56.0% YoY to AED48.8mn in 3Q2020 – National Bank of Umm Al-Qaiwain (NBQ) recorded net profit of AED48.8mn in 3Q2020, registering decrease of 56.0% YoY. Total interest income and income from Islamic financing products fell 33.6% YoY to AED97.5mn in 3Q2020. Operating income fell 35.9% YoY to AED75.8mn in 3Q2020. Total assets stood at AED13.6bn at the end of September 30, 2020 as compared to AED14.3bn at the end of December 31, 2019. Loans and advances and Islamic financing receivables stood at AED7.6bn (-7.6% YTD), while customers’ deposits and Islamic customers' deposits stood at AED8.2bn (-8.7% YTD) at the end of September 30, 2020. EPS came in at AED0.03 in 3Q2020 as compared to AED0.06 in 3Q2019. (ADX) Emirate of Sharjah hires banks for tap of 2029 Sukuk – Sharjah, the third-largest Emirate of the UAE, has hired banks to arrange a reopening of its existing $750mn 2029 Sukuk, or Islamic bond, that it sold last year, a document showed. It has hired Mashreqbank as financial advisor and mandated Dubai Islamic Bank, HSBC, Sharjah Islamic Bank and Standard Chartered to arrange investor calls starting on Tuesday. A tap of the $750mn 3.234% Sukuk due on October 23, 2029 will follow, subject to market conditions. A bond tap is where an existing transaction is reopened for subscription using the same documentation as before. Last week, S&P downgraded Sharjah's long-term credit rating to BBB- from BBB, citing a weakening fiscal position. It said it expected the government's interest burden would increase to about 17% of revenue by 2023, up from about 12% in 2020, as interest payments rose in line with higher debt levels. "Sharjah's ability to expand its already-low revenue base remains constrained. The economic fallout from the COVID-19 pandemic and headwinds to economic activity from lower oil prices will materially lower 2020 government revenue compared with 2019," S&P said. (Zawya) CBK cuts some rates, leaves benchmark on hold – Central bank of Kuwait (CBK) decides to maintain the current discount rate at 1.5%, maintaining the current interest rate cap for loans extended to customers in Kuwaiti Dinar. CBK cuts rates of other monetary policy instruments by 0.125% for the entire interest rate yield curve terms matrix, up to the 10-year term. This includes repo, CBK bonds, the term-deposits system, direct intervention instruments, as well as public debt instruments, effective October 28. The decisions also came as part of the CBK’s special measures to cope with the ramifications of the Covid-19 pandemic on economic and banking conditions. (Bloomberg) Moody's: Kuwait is the GCC state most impacted by the low oil price – Kuwait is the GCC sovereign most exposed to the prolonged decline in oil prices caused by the COVID-19 pandemic, with a -29.2% oil and gas revenue shock, Moody’s said, while Bahrain is the least exposed of the GCC states, with a revenue impact of -4.2%. The impact of the coronavirus shock on oil and gas revenue, based on the assumption that oil prices average about $35 per barrel this year. Kuwait was followed by Saudi Arabia with a revenue shock of -12.7%, Oman with - 12.2%, Abu Dhabi with -11% and Qatar with 7.8%. In a webinar hosted by Moody’s on the impact of the pandemic and lower oil prices on GCC sovereigns, VP, Senior Analyst for Moody’s sovereign risk group, Alexander Perjessy said: “The UAE and Qatar are likely to be able to offset a fairly large portion of the oil revenue lost this year through spending cuts. “The fiscal measures implemented in Kuwait and Bahrain will not really offset anything, will only widen the deficits. (Zawya) Kuwait's UPAC receives approval for 132.5% share capital increase – Kuwait-based real estate and facilities management company UPAC has received approval from the Capital Markets Authority (CMA) to increase its share capital by 132.5%, it was announced today. The company, which manages commercial real estate and parking at Kuwait International Airport, and is an investor in Abu Dhabi's $1.2bn mega project Reem Mall, said it had received the approval to increase paid up share capital from KD16.45mn, distributed over 164.5mn shares, to
- 9. Page 9 of 10 KD38.25mn distributed over 382.5mn shares. In a statement to Boursa Kuwait, UPAC said it was in the process of submitting a public offering prospectus to the CMA and that there is no impact on the company's financial position at the present time. (Zawya) Kuwait sells KD200mn 91-day bills; bid-cover at 13.26x – Kuwait sold KD200mn of 91-day bills due on January 26, 2021. Investors offered to buy 13.26 times the amount of securities sold. The bills have a yield of 1.25% and settled on October 27, 2020. (Bloomberg) National Bank of Oman not to exercise call option on $300mn notes – National Bank of Oman cites market conditions, including impact of Covid-19 and economic considerations to manage cost of capital. First call option on the perpetual Tier 1 capital securities is November 18, 2020; next possible call date is May 18, 2021. Coupon for reset period starting November 18 will be the aggregate of the initial margin of 6.193% per year and relevant 5-year reset rate. Bank issued the notes in November 2015 with 7.875% per annum coupon. (Bloomberg) NBB's net profit falls 12.5% YoY to BHD14.0mn in 3Q2020 – National Bank of Bahrain (NBB) recorded net profit of BHD14.0mn in 3Q2020, registering decrease of 12.5% YoY. Net interest income rose 22.2% YoY to BHD27.5mn in 3Q2020. Total operating income rose 20.8% YoY to BHD33.7mn in 3Q2020. Total assets stood at BHD4.2bn at the end of September 30, 2020 as compared to BHD3.2bn at the end of September 30, 2019. Loans and advances stood at BHD2.1bn (+86.3% YoY), while customers’ deposits stood at BHD3.1bn (+50.7% YoY) at the end of September 30, 2020. EPS came in at 8 fils in 3Q2020 as compared to 9 fils in 3Q2019. (Bahrain Bourse) Investcorp board of directors approves fiscal year 2021 preference share issuance – Investcorp held a board of directors meeting on September 30, 2020 to approve the issuance of a new series of preference shares to strengthen the company’s capital and liquidity position and refinance the existing outstanding Series B preference shares (FY2021 Preference Shares Transaction). An EGM will be scheduled at a date to be determined for the purpose of, among others, obtaining the approval of the shareholders for (i) the FY2021 Preference Shares Transaction; (ii) filing the necessary documentation to obtain the permission of the Capital Markets Supervision Directorate of the Central Bank of Bahrain, the Bahrain Bourse and the Ministry of Industry, Commerce and Tourism; and (iii) amending the memorandum and articles of association of Investcorp Holdings to reflect the FY2021 Preference Shares Transaction. (Bahrain Bourse)
- 10. Contacts Saugata Sarkar, CFA, CAIA Shahan Keushgerian Zaid al-Nafoosi, CMT, CFTe Head of Research Senior Research Analyst Senior Research Analyst Tel: (+974) 4476 6534 Tel: (+974) 4476 6509 Tel: (+974) 4476 6535 saugata.sarkar@qnbfs.com.qa shahan.keushgerian@qnbfs.com.qa zaid.alnafoosi@qnbfs.com.qa Mehmet Aksoy, PhD QNB Financial Services Co. W.L.L. Senior Research Analyst Contact Center: (+974) 4476 6666 Tel: (+974) 4476 6589 PO Box 24025 mehmet.aksoy@qnbfs.com.qa Doha, Qatar Disclaimer and Copyright Notice: This publication has been prepared by QNB Financial Services Co. W.L.L. (“QNBFS”) a wholly-owned subsidiary of Qatar National Bank (Q.P.S.C.). QNB FS is regulated by the Qatar Financial Markets Authority and the Qatar Exchange. Qatar National Bank (Q.P.S.C.) is regulated by the Qatar Central Bank. This publication expresses the views and opinions of QNBFS at a given time only. It is not an offer, promotion or recommendation to buy or sell securities or other investments, nor is it intended to constitute legal, tax, accounting, or financial advice. QNBFS accepts no liability whatsoever for any direct or indirect losses arising from use of this report. Any investment decision should depend on the individual circumstances of the investor and be based on specifically engaged investment advice. We therefore strongly advise potential investors to seek independent professional advice before making any investment decision. Although the information in this report has been obtained from sources that QNBFS believes to be reliable, we have not independently verified such information and it may not be accurate or complete. QNBFS does not make any representations or warranties as to the accuracy and completeness of the information it may contain, and declines any liability in that respect. For reports dealing with Technical Analysis, expressed opinions and/or recommendations may be different or contrary to the opinions/recommendations of QNBFS Fundamental Research as a result of depending solely on the historical technical data (price and volume). QNBFS reserves the right to amend the views and opinions expressed in this publication at any time. It may also express viewpoints or make investment decisions that differ significantly from, or even contradict, the views and opinions included in this report. This report may not be reproduced in whole or in part without permission from QNBFS. COPYRIGHT: No part of this document may be reproduced without the explicit written permission of QNBFS. Page 10 of 10 Rebased Performance Daily Index Performance Source: Bloomberg Source: Bloomberg Source: Bloomberg Source: Bloomberg (*$ adjusted returns) 60.0 80.0 100.0 120.0 140.0 160.0 Sep-16 Sep-17 Sep-18 Sep-19 Sep-20 QSE Index S&P Pan Arab S&P GCC 0.5% 0.5% (0.8%) (0.5%) (0.2%) 1.3% 1.1% (1.0%) 0.0% 1.0% 2.0% SaudiArabia Qatar Kuwait Bahrain Oman AbuDhabi Dubai Asset/Currency Performance Close ($) 1D% WTD% YTD% Global Indices Performance Close 1D%* WTD%* YTD%* Gold/Ounce 1,907.99 0.3 0.3 25.8 MSCI World Index 2,381.65 (0.4) (2.0) 1.0 Silver/Ounce 24.37 0.4 (1.0) 36.5 DJ Industrial 27,463.19 (0.8) (3.1) (3.8) Crude Oil (Brent)/Barrel (FM Future) 41.20 1.8 (1.4) (37.6) S&P 500 3,390.68 (0.3) (2.2) 4.9 Crude Oil (WTI)/Barrel (FM Future) 39.57 2.6 (0.7) (35.2) NASDAQ 100 11,431.35 0.6 (1.0) 27.4 Natural Gas (Henry Hub)/MMBtu 3.03 4.5 4.5 45.0 STOXX 600 352.58 (0.9) (2.9) (10.7) LPG Propane (Arab Gulf)/Ton 53.75 0.7 (0.5) 30.3 DAX 12,063.57 (0.9) (4.7) (4.0) LPG Butane (Arab Gulf)/Ton 62.75 2.0 1.6 (4.2) FTSE 100 5,728.99 (0.8) (2.0) (25.2) Euro 1.18 (0.1) (0.5) 5.2 CAC 40 4,730.66 (1.7) (3.8) (16.7) Yen 104.42 (0.4) (0.3) (3.9) Nikkei 23,485.80 0.4 0.2 3.5 GBP 1.30 0.2 0.0 (1.6) MSCI EM 1,133.99 0.3 (0.2) 1.7 CHF 1.10 (0.1) (0.5) 6.5 SHANGHAI SE Composite 3,254.32 0.2 (1.0) 10.8 AUD 0.71 0.1 (0.1) 1.5 HANG SENG 24,787.19 (0.5) (0.5) (11.6) USD Index 92.94 (0.1) 0.2 (3.6) BSE SENSEX 40,522.10 1.3 (0.2) (5.1) RUB 77.29 1.1 1.5 24.7 Bovespa 99,605.50 (2.1) (2.4) (38.9) BRL 0.18 (1.5) (1.6) (29.6) RTS 1,131.36 (1.8) (2.8) (27.0) 121.9 115.8 90.9