QNBFS Daily Market Report August 23, 2020
•
0 likes•198 views

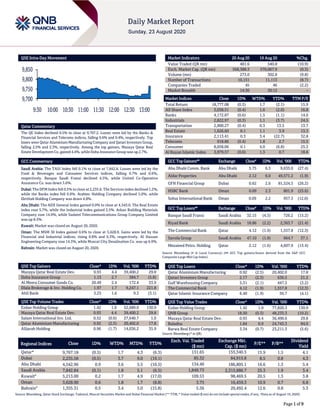
The QE Index declined 0.5% to close at 9,767.2. Losses were led by the Banks & Financial Services and Telecoms indices, falling 0.6% and 0.4%, respectively.

Recommended
Recommended
More Related Content
What's hot
What's hot (20)
Similar to QNBFS Daily Market Report August 23, 2020
Similar to QNBFS Daily Market Report August 23, 2020 (20)
More from QNB Group
More from QNB Group (20)
Recently uploaded
Recently uploaded (20)
QNBFS Daily Market Report August 23, 2020
- 1. Page 1 of 9 QSE Intra-Day Movement Qatar Commentary The QE Index declined 0.5% to close at 9,767.2. Losses were led by the Banks & Financial Services and Telecoms indices, falling 0.6% and 0.4%, respectively. Top losers were Qatar Aluminium Manufacturing Company and Qatari Investors Group, falling 2.5% and 2.3%, respectively. Among the top gainers, Mazaya Qatar Real Estate Development Co. gained 4.4%, while Doha Insurance Group was up 2.7%. GCC Commentary Saudi Arabia: The TASI Index fell 0.1% to close at 7,842.8. Losses were led by the Food & Beverages and Consumer Services indices, falling 0.7% and 0.6%, respectively. Banque Saudi Fransi declined 4.5%, while United Co-Operative Assurance Co. was down 3.6%. Dubai: The DFM Index fell 0.5% to close at 2,235.6. The Services index declined 1.2%, while the Banks index fell 0.9%. Arabtec Holding Company declined 5.0%, while Ekttitab Holding Company was down 4.8%. Abu Dhabi: The ADX General Index gained 0.9% to close at 4,543.0. The Real Estate index rose 5.7%, while the Industrial index gained 2.5%. Arkan Building Materials Company rose 14.9%, while Sudatel Telecommunications Group Company Limited was up 8.5%. Kuwait: Market was closed on August 20, 2020. Oman: The MSM 30 Index gained 0.6% to close at 3,628.9. Gains were led by the Financial and Industrial indices, rising 0.8% and 0.3%, respectively. Al Hassan Engineering Company rose 14.3%, while Muscat City Desalination Co. was up 6.9%. Bahrain: Market was closed on August 20, 2020. QSE Top Gainers Close* 1D% Vol. ‘000 YTD% Mazaya Qatar Real Estate Dev. 0.93 4.4 39,400.2 29.8 Doha Insurance Group 1.13 2.7 384.7 (5.8) Al Meera Consumer Goods Co. 20.49 2.4 172.4 33.9 Dlala Brokerage & Inv. Holding Co. 1.97 1.7 9,247.1 221.8 Ahli Bank 3.23 1.6 9.3 (3.1) QSE Top Volume Trades Close* 1D% Vol. ‘000 YTD% Ezdan Holding Group 1.42 1.0 52,689.0 130.9 Mazaya Qatar Real Estate Dev. 0.93 4.4 39,400.2 29.8 Salam International Inv. Ltd. 0.52 (0.6) 27,640.7 1.0 Qatar Aluminium Manufacturing 0.92 (2.5) 20,402.0 17.8 Alijarah Holding 0.96 (1.7) 14,036.2 35.9 Market Indicators 20 Aug 20 19 Aug 20 %Chg. Value Traded (QR mn) 481.6 540.8 (10.9) Exch. Market Cap. (QR mn) 568,388.3 570,067.9 (0.3) Volume (mn) 273.0 302.8 (9.8) Number of Transactions 10,151 11,113 (8.7) Companies Traded 45 46 (2.2) Market Breadth 14:30 30:12 – Market Indices Close 1D% WTD% YTD% TTM P/E Total Return 18,777.08 (0.5) 1.7 (2.1) 15.9 All Share Index 3,038.51 (0.4) 1.6 (2.0) 16.8 Banks 4,172.87 (0.6) 1.5 (1.1) 14.0 Industrials 2,822.97 (0.3) 1.1 (3.7) 24.5 Transportation 2,900.27 (0.4) 0.3 13.5 13.7 Real Estate 1,626.60 0.1 1.1 3.9 13.3 Insurance 2,113.41 0.3 3.4 (22.7) 32.8 Telecoms 918.86 (0.4) 1.8 2.7 15.5 Consumer 8,058.06 0.1 4.0 (6.8) 25.3 Al Rayan Islamic Index 3,979.57 (0.6) 1.3 0.7 18.6 GCC Top Gainers## Exchange Close# 1D% Vol. ‘000 YTD% Abu Dhabi Comm. Bank Abu Dhabi 5.75 6.5 9,635.0 (27.4) Aldar Properties Abu Dhabi 2.12 6.0 49,571.2 (1.9) GFH Financial Group Dubai 0.62 2.6 81,524.5 (26.2) HSBC Bank Oman 0.09 2.3 801.9 (25.6) Sohar International Bank Oman 0.09 2.2 957.3 (12.0) GCC Top Losers## Exchange Close# 1D% Vol. ‘000 YTD% Banque Saudi Fransi Saudi Arabia 32.15 (4.5) 726.2 (15.2) Riyad Bank Saudi Arabia 18.86 (2.2) 2,363.7 (21.4) The Commercial Bank Qatar 4.12 (1.9) 1,557.8 (12.3) Savola Group Saudi Arabia 47.10 (1.9) 664.7 37.1 Mesaieed Petro. Holding Qatar 2.12 (1.6) 4,607.9 (15.4) Source: Bloomberg (# in Local Currency) (## GCC Top gainers/losers derived from the S&P GCC Composite Large Mid Cap Index) QSE Top Losers Close* 1D% Vol. ‘000 YTD% Qatar Aluminium Manufacturing 0.92 (2.5) 20,402.0 17.8 Qatari Investors Group 2.17 (2.3) 636.5 21.2 Gulf Warehousing Company 5.31 (2.1) 447.3 (3.2) The Commercial Bank 4.12 (1.9) 1,557.8 (12.3) Qatar Islamic Insurance Company 6.40 (1.9) 50.7 (4.1) QSE Top Value Trades Close* 1D% Val. ‘000 YTD% Ezdan Holding Group 1.42 1.0 77,820.3 130.9 QNB Group 18.50 (0.3) 48,233.3 (10.2) Mazaya Qatar Real Estate Dev. 0.93 4.4 36,490.6 29.8 Baladna 1.84 0.9 24,743.3 84.0 Barwa Real Estate Company 3.34 (0.7) 23,211.3 (5.6) Source: Bloomberg (* in QR) Regional Indices Close 1D% WTD% MTD% YTD% Exch. Val. Traded ($ mn) Exchange Mkt. Cap. ($ mn) P/E** P/B** Dividend Yield Qatar* 9,767.18 (0.5) 1.7 4.3 (6.3) 131.65 155,340.5 15.9 1.5 4.1 Dubai 2,235.58 (0.5) 3.7 9.0 (19.1) 85.32 84,915.8 8.5 0.8 4.3 Abu Dhabi 4,542.96 0.9 3.6 5.5 (10.5) 134.40 186,805.1 16.6 1.3 5.4 Saudi Arabia 7,842.84 (0.1) 1.8 5.1 (6.5) 1,849.73 2,315,886.7 25.3 1.9 3.4 Kuwait# 5,213.00 0.2 1.7 4.9 (17.0) 109.53 98,469.5 20.5 1.3 3.8 Oman 3,628.90 0.6 1.8 1.7 (8.8) 3.75 16,459.3 10.9 0.7 6.8 Bahrain# 1,355.31 0.5 3.4 5.0 (15.8) 5.56 20,492.4 12.6 0.8 5.3 Source: Bloomberg, Qatar Stock Exchange, Tadawul, Muscat Securities Market and Dubai Financial Market (** TTM; * Value traded ($ mn) do not include special trades, if any, #Data as of August 19, 2020) 9,700 9,750 9,800 9,850 9:30 10:00 10:30 11:00 11:30 12:00 12:30 13:00
- 2. Page 2 of 9 Qatar Market Commentary The QE Index declined 0.5% to close at 9,767.2. The Banks & Financial Services and Telecoms indices led the losses. The index fell on the back of selling pressure from Arab and Foreigners shareholders despite buying support from Qatari and GCC shareholders. Qatar Aluminium Manufacturing Company and Qatari Investors Group were the top losers, falling 2.5% and 2.3%, respectively. Among the top gainers, Mazaya Qatar Real Estate Development Company gained 4.4%, while Doha Insurance Group was up 2.7%. Volume of shares traded on Thursday fell by 9.8% to 273.0mn from 302.8mn on Wednesday. Further, as compared to the 30-day moving average of 293.8mn, volume for the day was 7.1% lower. Ezdan Holding Group and Mazaya Qatar Real Estate Development Company were the most active stocks, contributing 19.3% and 14.4% to the total volume, respectively. Source: Qatar Stock Exchange (*as a % of traded value) Ratings, Earnings Releases and Global Economic Data Ratings Updates Company Agency Market Type* Old Rating New Rating Rating Change Outlook Outlook Change Bahrain Telecom. Co. Fitch Bahrain LT-IDR BB- B+ Stable – Source: News reports, Bloomberg (* LT – Long Term, IDR – Issuer Default Rating) Earnings Releases Company Market Currency Revenue (mn) 2Q2020 % Change YoY Operating Profit (mn) 2Q2020 % Change YoY Net Profit (mn) 2Q2020 % Change YoY Saudi Research and Marketing Saudi Arabia SR 558.1 0.6% 106.2 21.1% 75.3 -12.0% Saudi Arabian Amiantit Co. Saudi Arabia SR 83.2 -49.1% (37.4) N/A (57.3) N/A Electrical Industries Co. Saudi Arabia SR 109.6 -29.0% (7.7) N/A (11.6) N/A Batic Investments And Logistics Co. Saudi Arabia SR 98.1 -16.8% (5.8) N/A (7.2) N/A Al Sagr Cooperative Insurance Co. Saudi Arabia SR 97.0 3.2% – – 9.2 101.0% Arabian Aramco Total Services Co. Saudi Arabia SR 4,942.4 -50.8% (77.5) N/A (343.9) N/A National Industrialization Co. Saudi Arabia SR 486.3 -33.5% (169.2) N/A (188.8) N/A Al Jouf Agricultural Dev. Co. Saudi Arabia SR 72.0 61.0% 20.1 1487.7% 11.9 919.9% Al-Ahlia Insurance Co. Saudi Arabia SR 47.4 -0.8% – – 2.3 N/A Saudi Enaya Cooperative Insurance Saudi Arabia SR 26.1 -33.3% – – 1.6 -14.3% Baazeem Trading Co. Saudi Arabia SR 71.8 7.5% 8.3 20.3% 6.6 22.9% Source: Company data, DFM, ADX, MSM, TASI, BHB. Global Economic Data Date Market Source Indicator Period Actual Consensus Previous 08/20 US Department of Labor Initial Jobless Claims 15-Aug 1,106k 920k 971k 08/20 US Department of Labor Continuing Claims 08-Aug 14,844k 15,000k 15480k 08/21 US Markit Markit US Manufacturing PMI Aug 53.6 52.0 50.9 08/21 US Markit Markit US Services PMI Aug 54.8 51.0 50.0 08/21 US Markit Markit US Composite PMI Aug 54.7 – 50.3 08/21 UK GfK NOP (UK) GfK Consumer Confidence Aug -27 -25 -27 08/21 UK Markit Markit UK PMI Manufacturing SA Aug 55.3 54.0 53.3 08/21 UK Markit Markit/CIPS UK Services PMI Aug 60.1 57.0 56.5 08/21 UK Markit Markit/CIPS UK Composite PMI Aug 60.3 56.9 57.0 08/21 EU Markit Markit Eurozone Manufacturing PMI Aug 51.7 52.7 51.8 08/21 EU Markit Markit Eurozone Services PMI Aug 50.1 54.5 54.7 Overall Activity Buy %* Sell %* Net (QR) Qatari Individuals 47.30% 45.02% 10,996,905.3 Qatari Institutions 20.71% 13.87% 32,976,057.5 Qatari 68.01% 58.88% 43,972,962.8 GCC Individuals 1.03% 1.03% 41,087.0 GCC Institutions 1.46% 1.12% 1,639,165.6 GCC 2.49% 2.14% 1,680,252.6 Arab Individuals 12.99% 13.18% (891,925.6) Arab Institutions – 0.01% (29,057.0) Arab 12.99% 13.18% (920,982.6) Foreigners Individuals 3.52% 3.38% 658,211.8 Foreigners Institutions 12.98% 22.41% (45,390,444.6) Foreigners 16.50% 25.79% (44,732,232.8)
- 3. Page 3 of 9 08/21 EU Markit Markit Eurozone Composite PMI Aug 51.6 55.0 54.9 Date Market Source Indicator Period Actual Consensus Previous 08/21 EU Markit Markit Eurozone Composite PMI Aug 51.6 55.0 54.9 08/21 EU European Commission Consumer Confidence Aug -14.7 -15.0 -15.0 08/20 Germany German Federal Statistical Office PPI MoM Jul 0.2% 0.1% 0.0% 08/20 Germany German Federal Statistical Office PPI YoY Jul -1.7% -1.8% -1.8% 08/21 Germany Markit Markit/BME Germany Manufacturing PMI Aug 53.0 52.3 51.0 08/21 Germany Markit Markit Germany Services PMI Aug 50.8 55.2 55.6 08/21 Germany Markit Markit/BME Germany Composite PMI Aug 53.7 55.0 55.3 08/21 France Markit Markit France Manufacturing PMI Aug 49.0 53.0 52.4 08/21 France Markit Markit France Services PMI Aug 51.9 56.3 57.3 08/21 France Markit Markit France Composite PMI Aug 51.7 57.0 57.3 08/21 Japan Ministry of Internal Affairs and Communications Natl CPI YoY Jul 0.3% 0.3% 0.1% 08/21 Japan Markit Jibun Bank Japan PMI Services Aug 45 – 45.4 08/21 Japan Markit Jibun Bank Japan PMI Composite Aug 44.9 – 44.9 Source: Bloomberg (s.a. = seasonally adjusted; n.s.a. = non-seasonally adjusted; w.d.a. = working day adjusted) News Qatar QNB launches WhatsApp service to enhance customer experience – QNB, the largest financial institution in the Middle East and Africa, has launched QNB WhatsApp Service to provide customers with a wider range of banking products and services. QNB WhatsApp banking will be a new channel that serves QNB customers and the public by providing general information on the Bank’s products and services as well as a feature to message customer service agents for live support. Customers can easily start using the QNB WhatsApp banking by downloading WhatsApp via IOS or Android Stores and save the WhatsApp number +9744407777 in their contact list. QNB provides unique digital banking services for its customers, including flexible transfers worldwide, scheduling recurring transfers, bill payments, in addition to innovative and secure solutions for Internet and Mobile Banking services. (Press Release) FTSE Russell announces results of its September 2020 semi- annual review – FTSE Russell has announced results of its September 2020 semi-annual review which specifies that Ezdan Holding (ERES) will migrate from Mid Cap to Large Cap, as part of the addition to the large cap category. With respect to addition to the Micro-Cap, Qatar National Cement (QNCD), Islamic Holding (IHGS) and Mannai Corporation (MCCS) have been added to the category. With respect to deletion from the FTSE Indices, Qatari Islamic Insurance (QISI) has been deleted from the Micro-Cap category. The changes will be effective on closing of September 17, 2020 (QSE) QCB: Investments, credit facilities' growth boost QDB assets to nearly QR12bn in 2019 – Spurt in investments and continued growth in credit facilities have scaled up Qatar Development Bank's (QDB) total assets to nearly QR12bn in 2019, QCB has said in a report. In view of the continued thrust on development of SMEs, loans provided by QDB during 2019 recorded a healthy 7% growth, Qatar Central Bank (QCB) said in its latest Financial Stability Report. According to QCB, QDB pursued its role as developmental financial institution with the primary aim to facilitate diversification of the Qatari economy through development of small and medium-sized enterprises (SMEs). Fully owned by the Government, QDB aims to make Qatari SMEs globally competitive through financing, developing skills and capabilities, promoting exports, and providing opportunities domestically and globally. It also facilitates the real estate development and provides housing loans to citizens. “Thrust towards diversification of the economy was reflected in the continued healthy growth of the balance sheet of QDB,” QCB noted. The total assets of QDB increased from QR11bn in 2018 to QR11.9bn by the end of 2019. “The increase in total assets during 2019 was due to spurt in investment and continued growth in credit facilities. In view of the continued thrust on development of SMEs, loans provided by QDB during 2019 recorded a healthy 7% growth,” QCB said. (Gulf-Times.com) QCB: Investment-friendly laws, Doha Metro opening, supply moderation to help stabilize Qatar’s real estate – Foreign investment-friendly laws, Doha Metro opening and moderation in supply will help stabilize Qatar’s real estate sector, Qatar Central Bank (QCB) has said in a report. In the past few years, Qatar has been witnessing several developments that could act as harbinger of a new era in the real estate ecosystem, QCB noted in its just published 11th Financial Stability report. This includes, among others, development of new locations for affordable rental housing and strategically linking them through new intercity highways. “The opening of Doha Metro Lines augurs well for the properties located near metro stations by way of value appreciation of established hubs as well as by value unlocking of new locations under the metro network,” QCB noted. The report noted that recent legislations brought by Qatar during the year like introduction of foreign investment-friendly laws such as legalization of foreign ownership for various asset classes in select locations would provide a fillip to the real estate sector development in the coming years. “Considering the above factors and the moderation in the leading indicator of supply, price in real estate sector is expected to stabilize going forward,” QCB said. According to QCB, the “health of real estate in Qatar is critical to the stability of the financial sector” considering its share in the composition of the economy (6.1% of 2019 GDP). Hence, it is imperative to closely and continuously assess the
- 4. Page 4 of 9 developments in the real estate sector so that vulnerabilities could be identified at an early stage and corrective action can be taken to avoid any shock impacting the stability of the financial sector. Towards this end, the QCB examined (in detail) the developments in the real estate market based on the Real Estate Price Index (REPI) at a quarterly frequency. The QFC corporate banks' liquid assets stood at 9.5% of total assets in 2019, down from 11.1% in 2018 and similarly liquid assets to total funding ratio eased to 10% in 2019 compared to 11% in 2018. "Notwithstanding moderationin the share of liquid assets during 2019, the share of stable deposits improved substantially," it said, highlighting that it went up to 91.2% in 2019 against 79.2% in 2018. (Gulf-Times.com) Building permits issued witness double-digit monthly growth in Qatar – Qatar’s construction sector continued to exhibit positive sentiments with building permits issued witnessing double-digit monthly growth in July as the country entered the third phase of easing of the COVID-19 restrictions, according to the Planning and Statistics Authority (PSA). In its latest data, the PSA also found a double-digit MoM increase in the building completion certificates issued in the review period. The PSA figures suggest that the total number of new building permits issued were 684, of which Al Rayyan constituted 29% or 196 permits, Wakrah (22% or 150), Doha (17% or 116), Al Daayen (16% or 106), Umm Slal (8% or 56), Al Khor (5% or 31), Al Shahaniya (2% or 17) and Al Shamal (2% or 12). On a monthly basis, at the national level, the number of building permits issued grew 20% with Umm Slal reporting 87% surge, Al Khor (41%), Wakrah and Doha (20% each), Al Rayyan (17%) and Al Daayen (6%); while Al Shamal and Al Shahaniya witnessed 8% and 6% declines respectively. The building permits data is of particular importance as it is considered an indicator for the performance of the construction sector which in turn occupies a significant position in the national economy. The PSA data indicates that the new building permits (residential and non-residential) constituted 49% (336 permits) of the total building permits issued this July, additions 47% (320 permits), and fencing 4% (28 permits). Of the new residential buildings’ permits, villas topped the list, accounting for 68% (175 permits) of the total, dwellings of housing loans 21% (54 permits) and apartments 7% (28 permits). (Gulf- Times.com) QFA officially submits bid to host 2027 AFC Asian Cup – The Qatar Football Association (QFA) announced that it has officially submitted its bid to host the 2027 AFC Asian Cup. The QFA sent an integrated file to the AFC, detailing how Qatar fulfills all the hosting requirements for the Cup, a fact supported by numerous tournaments hosted by the country at the continental and global levels in the past, and also by the preparations for the events to come in the future. (Gulf- Times.com) International Markit flash PMI: US business activity surges to early 2019 levels – US business activity snapped back to the highest since early 2019 this month as companies in both the manufacturing and services sectors saw a resurgence in new orders even as new COVID-19 cases remain stubbornly high across the country, a purchasing managers’ survey showed on Friday. Data firm IHS Markit said its flash US Composite PMI Index rose to a reading of 54.7 this month - the highest since February 2019 - from 50.3 in July. Its flash - or preliminary - indicator for the manufacturing sector stood at its highest since January 2019 and for the services sector it was the highest since March 2019. A reading above 50 indicates growth in private sector output. The economy fell into recession in February as the coronavirus began to spread rapidly around the US, triggering widespread business shutdowns and stay-at-home orders. “Driving the overall upturn in output was stronger client demand,” Markit said in its report. “Total new business rose for the first time since February and at a solid rate. Manufacturing firms registered a steeper expansion in new order inflows than in July, while service providers signaled a renewed increase in sales.” The survey’s flash composite new orders index climbed to 54 in August - the highest since March 2019 - from a final reading of 49.7 in July. Foreign sales increased at the fastest rate since September 2014, it said, as more non-US markets reopened their economies. (Reuters) US existing home sales shoot to near 14-year high in July – US home sales rose at a record pace for a second straight month in July and home prices hit a record as historically low interest rates boosted demand for homes even as the coronavirus pandemic put millions of people out of work. The National Association of Realtors said on Friday existing home sales rose 24.7% to a seasonally adjusted annual rate of 5.86mn units last month. Data for June was revised down slightly to a 4.70mn unit pace from the originally reported 4.72mn. July’s rise was the second straight increase, coming on the heels of a record monthly increase in June, and lifted the sales pace above the 5.76mn pace in February before the pandemic triggered a brief cratering in sales. July’s level was the highest since December 2006. Economists polled by Reuters had forecast sales rising 14.7% to a rate of 5.38mn units in July. Existing home sales, which make up about 85% of US home sales, rose 8.7% on a YoY basis in July. (Reuters) US and EU hatch mini-deal to cut lobster, other tariffs – The US and the European Union (EU) on Friday announced a mini-deal valued at around $200mn (152.74mn Pounds) to cut import tariffs on a small range of products, including US lobsters, in a sign of easing transatlantic trade tensions. The two, who have been at odds over aircraft subsidies and US President Donald Trump’s imposition of punitive tariffs on EU steel and aluminum, announced the deal in a joint statement. “The importance of the deal is that it has unleashed positive results elsewhere,” an EU official said. Under the agreement, the EU will remove tariffs of 8%-12% on imports of lobsters, while the US will halve its duties on imports of certain glassware, ceramics, disposable lighters and prepared meals. To comply with World Trade Organization rules, the lowered and removed tariffs will apply to all WTO members, although the products have been chosen so as to maximize the mutual benefits. The whole deal is worth some 168mn Euros, based on 2019 trade. The EU imported some 42mn Euros of US lobsters and exported to the US 126mn Euros of the other products involved. The apparent mismatch is partly because the US will only be halving, not removing, tariffs. Lobsters have been a big concern for Trump, who threatened in June to impose tariffs on Europe and China over lobster duties. (Reuters)
- 5. Page 5 of 9 Rise in US weekly jobless claims clouds labor market recovery – The number of Americans filing a new claim for unemployment benefits rose unexpectedly back above the 1mn mark last week, a setback for a struggling US job market crippled by the coronavirus pandemic. Still, in a sign some rehiring is underway, the rolls of those continuing to receive jobless benefits is slowly declining, the Labor Department reported on Thursday, and other data indicated a recovery from the recession triggered by COVID-19 continues, though at a more fitful pace than earlier. Initial claims for state unemployment benefits rose to a seasonally adjusted 1.106mn for the week ended August 15, from an upwardly revised 971,000 in the prior week. Economists polled by Reuters had forecast 925,000 applications in the latest week. The previous week’s level had marked the first time since March that new claims had registered below 1mn and had fueled some optimism that the pace of layoffs would slow further. Last week’s reversal soured that, and new weekly claims have been above the 1mn mark for 21 of the last 22 weeks. The volatility in benefits activity follows the lapse of an extra $600 weekly unemployment benefit at the end of July. The enhanced benefit had been in place since the spring under the massive coronavirus stimulus package passed by Congress in late March, but Democrats in Congress and the White House have failed to reach agreement on extending it. (Reuters) UK economy rebounding for now, as public borrowing mounts – Britain’s economic recovery from the shock of the COVID-19 pandemic has gathered pace, data showed on Friday, but government borrowing rose past the 2tn Pound mark and fears of future job losses are mounting. Retail sales rose above pre- pandemic levels in July, the first full month for many shops reopening after lockdown, and August’s Purchasing Managers’ Index (PMI) data showed the fastest growth in almost seven years. But Britain’s economy still faces a long recovery after shrinking by a record 20% in the second quarter, the largest decline of any big country. Retail sales in July were 1.4% above year-ago levels and 3.0% above their level before the pandemic, the Office for National Statistics said. August’s preliminary composite PMI, which covers most businesses outside retail, hit its highest level since October 2013. But employers are increasingly planning to shed jobs and were making staff redundant rather than bringing them back from a government- subsidized furlough scheme that expires in October. The Bank of England forecasts unemployment will reach 7.5% by year-end, almost double its most recent reading. Separately, the Confederation of British Industry said manufacturing orders were “severely depressed”, with little improvement in August. Stuttering PMI surveys for the Eurozone — where countries exited lockdown earlier than Britain — suggested the boost from pent-up demand was already fading. Retail sales are only part of overall household spending. A GfK survey showed no improvement in consumer confidence since early July. Within retail, different businesses have had contrasting fortunes. Grocery sales are 3% up on the year and online sales are 50% higher than before the pandemic. But sales volumes at clothing and footwear stores are 25% lower than last year. (Reuters) UK retail sales surge past pre-COVID peak in July – British retail sales surged past their pre-coronavirus level in July, the first full month that shops selling non-essential goods were open since the country went into lockdown in March. Separate government borrowing data showed public debt rose above 2tn Pounds ($2.65tn) in July for the first time and reached 100.5% of gross domestic product - its highest as a share of GDP since 1961. The unexpectedly robust retail sales figures showed the strength of consumer demand even as other parts of the economy are struggling to recover from recent hefty losses. Retail sales volumes rose by 3.6% from June - above all forecasts in a Reuters poll of economists - and were 1.4% higher than in July 2019, the Office for National Statistics said. That represented a sharp recovery from double-digit falls in April and May. Compared with February, before Britain was broadly affected by the pandemic, sales were 3.0% higher. (Reuters) PMI: UK firms see sharp August upturn but job cuts mount – The recovery among British businesses from the shock of the COVID- 19 pandemic quickened again in August, but snowballing job cuts sent an ominous signal for the months ahead, a survey showed on Friday. The early reading of the IHS Markit/CIPS UK Composite Purchasing Managers’ Index (PMI), covering the services and manufacturing sectors, shot up to a nearly seven- year high of 60.3 from 57.0 in July, far above the 50 threshold for growth. A Reuters poll of economists had pointed to a reading of 57.1. While the PMI indicated a further acceleration of growth, it did not signal a return to normal levels of output across businesses, which some economists think could take years. “There were encouraging signs that customer-facing service providers have started to catch up with the rebound seen earlier this summer across the wider economy,” said Tim Moore, economics director at IHS Markit, which compiles the survey. He cited a further easing of lockdown measures and the government’s “Eat Out to Help Out” scheme, which subsidizes restaurant meals, as helping to boost growth during August. Nonetheless, there were widespread worries among companies that the recovery might fade in the coming months, with the government’s job protection scheme set to close at the end of October. The PMI showed companies in both the services and manufacturing sectors cut jobs at a faster pace in August - echoing the almost daily announcements of lay-offs among many of Britain’s biggest companies. The PMI for the services sector, which comprises the bulk of Britain’s economy, rose to a six-year high of 60.1 in August from 56.5 in July - again better than expectations for a reading of 57.0. (Reuters) British public debt tops 2tn Pounds for first time – Britain’s public debt has surpassed 2tn Pounds ($2.65tn) for the first time, underscoring the challenge for finance minister Rishi Sunak, who is under pressure to give even more emergency support for the pandemic-hit economy. Net debt in July, excluding public banks, rose to 2.004tn Pounds. That’s equivalent to 100.5% of Britain’s economic output, the highest since 1961 when the country was still struggling with the costs of fighting World War Two. The debt surge reflects a huge increase in government spending, ranging from its massive coronavirus job subsidy scheme and tax cuts to discounts for restaurant diners, as well the hit to tax revenues from a nationwide lockdown. Debt has leapt by about 200bn Pounds since the coronavirus crisis engulfed Britain. Sunak said the crisis had put the public finances under significant strain, but without the government’s huge spending spree things would have been far worse. Britain’s budget forecasters warned last month that debt would pass the 2tn-Pound mark this year before continuing its sharp rise to
- 6. Page 6 of 9 2.5tn Pounds in the 2022/23 financial year and to 2.6tn Pounds by the mid-2020s. (Reuters) CBI survey: UK manufacturing remains 'severely depressed' – British manufacturing remains “severely depressed”, with new orders still well below normal, according to a survey on Friday that shows a very weak recovery is underway. The Confederation of British Industry’s monthly order book balance rose to -44 in August from -46 in July. A Reuters poll of economists had pointed to a bigger rise to -35. While marking the highest level since March, the survey showed the proportion of manufacturers reporting below-normal levels of orders still outnumbered those reporting above-normal orders by a wide margin. “This has been another difficult month for manufacturers,” said Anna Leach, CBI deputy chief economist. “Activity continues to be poor and order books severely depressed, although the worst of the decline seems to be behind us,” she added. Earlier the IHS Markit/CIPS survey of manufacturers showed month-on-month growth in activity accelerated in August to hit a 2-1/2-year high, though heavy job losses were underway. (Reuters) Small lenders face curbs as UK's COVID-19 rescue scheme winds down – Some small lenders issuing loans on behalf of Britain’s Coronavirus Business Interruption Loan Scheme (CBILS) risk running out of taxpayer-backed cash to lend before a September 30 deadline for applications, three sources told Reuters. The British Business Bank (BBB), which oversees CBILS and provides accreditation to participating lenders, has declined to top up allocations to some small lenders as the scheme draws to an end, said the sources, who declined to be named because the matter was commercially sensitive. Some of these lenders were hoping to lend more than their original allocation in the final weeks of the demand-led, no-capacity scheme and were relying on top-ups to issue timely loans to customers, one of the sources said. A potential scarcity of loans coupled with a looming deadline have raised fears more companies may struggle to get the funds they need. A spokesman for the BBB said it treated each lender request for funds on its merits. (Reuters) EU, Britain trade blame after scant progress towards post-Brexit deal – Britain and the European Union (EU) made scant progress towards a deal on future ties in talks this week, and their chief negotiators blamed each other for the stalemate as time ticks down to an end-of-year deadline. “Those who were hoping for negotiations to move swiftly forward this week will have been disappointed,” the EU’s chief negotiator, Michel Barnier, told a news conference after two full days of talks in Brussels. His British counterpart David Frost said a deal on post-Brexit relations was “still possible” and was still London’s goal but would not be easy to achieve. “There are ... significant areas which remain to be resolved and even where there is a broad understanding between negotiators, there is a lot of detail to work through,” Frost said in a statement. “Time is short for both sides.” British officials said London was willing to talk about any issue and that the EU’s insistence Britain must accept its position on state aid and fisheries meant Brussels was responsible for slowing the talks down. On Jan. 31, Britain became the first country ever to leave the EU, which it had joined in 1973. Their relationship is now governed by a transition arrangement that keeps previous rules in place while they negotiate a new partnership, to be effective from 2021, on everything from trade and transport to energy and security. The EU says Britain can only go on trading freely with its lucrative single market of 450mn people if London accepts “level playing field” rules to guarantee fair competition. (Reuters) EU's Barnier says at this stage deal with Britain seems unlikely – European Union’s (EU) Chief Brexit negotiator said on Friday that talks with Britain this week often appeared to going backwards rather than forwards and, at this point, it looked unlikely that a deal could be clinched before a year-end deadline. “At this stage, an agreement between the UK and the European Union seems unlikely,” Barnier told a news conference after two full days of negotiations in Brussels. “On the European side, we are very concerned about the state of play in our negotiations. The clock is ticking.” (Reuters) Eurozone economic recovery falters in August – The Eurozone’s recovery from its deepest economic downturn on record hit the brakes in August, particularly in services, as pent-up demand unleashed by the easing of coronavirus lockdowns dwindled, a survey showed on Friday. To contain the spread of the virus, which has infected over 22.5mn people globally, governments imposed strict lockdowns - forcing businesses to close and citizens to stay home, bringing economic activity to a near halt. After many of those restrictions were relaxed, activity in the Eurozone expanded in July at the fastest pace since mid-2018. But as infection rates have risen again in parts of the region, some earlier curbs have been reinstated. So in data likely to concern policymakers and diminish hopes for a V-shaped recovery, IHS Markit’s flash Composite Purchasing Managers’ Index sank to 51.6 from July’s final reading of 54.9, below all forecasts in a Reuters poll that predicted no change. The flow of incoming new business for firms slowed and once again some of August’s activity was derived by businesses completing backlogs of work. Germany and France, the bloc’s two biggest economies, also lost economic momentum this month, driven by the services slowdown. Apart from those economies, activity in the bloc decreased marginally in August, IHS Markit said. Growth in the Eurozone’s dominant service sector stalled, with that PMI plummeting to 50.1 from 54.7, below all forecasts in the Reuters poll which predicted a small dip to 54.5. With demand waning,the bloc’s services firms cut headcount for a sixth month and more sharply than in July. Factory activity - which did not suffer quite as sharp a decline as the service industry during the height of the pandemic - expanded for a second month. An index measuring output, which feeds into the composite PMI, rose to 55.7 from 55.3. (Reuters) France delays launch of COVID-19 economic reboot plan to September – The French government said on Saturday it would unveil details of its 100bn Euro ($118bn) plan to reinvigorate the economy in the first week of September, instead of next Tuesday, as it focuses on preparing the new school term. “The recovery plan is ready, the timetable for its implementation still stands,” government spokesman Gabriel Attal said in a statement. Schools are set to reopen on September 1, after most were closed during a two-month lockdown earlier this year to fight the coronavirus, and the government is working to ensure protective measures will be adequate, Attal said. France has already outlined some of the parameters of its crisis measures,
- 7. Page 7 of 9 including cuts to domestic business taxes, investment in promoting jobs for the young and funding for environmental initiatives. (Reuters) Japan's consumer prices mired as deflation specter looms – Japan’s core consumer prices were stubbornly unchanged in July, dashing hopes for a modest rise as the coronavirus pandemic hit household demand and revived fears of a national plunge back into deflation. A slow economic recovery from last quarter’s record slump is expected to weigh on prices as consumer demand collapsed amid resurgent infections, which will in turn hit profits, jobs and business investment, analysts say. The specter of a return to deflation will keep the Bank of Japan (BOJ) under pressure to continue massive monetary stimulus and maintain ultra-low interest rates to support government fiscal spending aimed at battling the health crisis. Japan’s core consumer price index, which includes oil products but excludes volatile fresh food prices, stood flat in July from a year earlier, data by the Ministry of Internal Affairs and Communications showed on Friday. It fell short of a median market forecast for a 0.1% rise, following a flat reading in June. Drops in gasoline prices reflecting weak global demand for crude oil offset gains in food and household durable goods such as electric rice-cookers and air-conditioners, the data showed. (Reuters) Xi: China will step up efforts to make breakthroughs in key technologies – China will step up efforts to make breakthroughs in key technologies, President Xi Jinping said, according to state TV on Friday. Authorities will roll out more support measures to help companies, stabilize jobs and expand employment, said Xi during his inspection tour to the flood-hit province of Anhui, China Central Television reported. (Reuters) India's crude imports fall to lowest in over a decade in July – India’s crude oil imports fell in July to their lowest since March 2010 as fuel demand slowed amid renewed coronavirus-induced lockdowns and closures of refinery units for maintenance, government data showed on Thursday. Crude oil imports last month slumped about 36.4% from a year earlier to 12.34mn tons, or 2.92mn barrels per day, data from the Petroleum Planning and Analysis Cell (PPAC) of the Ministry of Petroleum & Natural Gas showed. That marked a fourth straight monthly decline. Fuel demand in the world’s third-biggest oil importer and consumer also fell, posting a fifth consecutive YoY drop. The country reported a record daily jump of 69,652 coronavirus infections on Thursday, taking the total number of cases to 2.84mn, data from the federal health ministry showed. India is also Asia’s third- biggest economy, which imports and exports refined fuels. Refined product imports surged 46.4% to 4.07mn tons YoY, mainly due to a sharp jump in India’s fuel oil imports. Fuel oil imports rose to record 1.22mn tons in July from 127,000tons a year ago. (Reuters) Brazil posts biggest formal job gain for July since 2012 – Brazil posted its strongest July job growth in eight years, official figures showed on Friday, snapping four consecutive months of job losses as the country continued to relax the coronavirus-fighting lockdown measures from earlier in the year. The addition of a net 131,010 formal jobs in July was driven by industry and construction, which together accounted for over 70% of the overall gains, followed by retail and agribusiness. Services continued to shed jobs, the economy ministry said. Over 1mn jobs were created, while 912,640 positions were lost. July’s figures followed a downwardly-revised 19,579 formal job losses in June, and brings the net loss in the first seven months of the year to 1.1mn. Economy Minister Paulo Guedes said he was “excited” by the “extraordinary” figures. A ‘V-shaped’ recovery is possible, Guedes said, adding that the job numbers justified a recent wave of economists revising their 2020 gross domestic product forecasts upward. (Reuters) Regional Strong sovereign support continues to drive most Islamic bank ratings – The Issuer Default Ratings (IDRs) of Islamic banks in the GCC region are all investment grade, Fitch Ratings said, with 89% of IDRs driven by potential sovereign support either directly or through a parent. The remaining 11% are driven by banks' standalone creditworthiness, as defined by their Viability Ratings (VRs). The outlooks on most IDRs are stable. Sovereign willingness to provide support has remained extremely strong throughout the GCC and little progress towards resolution has been made. Only 35% of VRs are investment grade (this is lower than at conventional banks), with higher risk appetites and weak asset quality as the main shortfalls. The average VR in Saudi Arabia is a 'bbb+' (ranging from 'bb+' to 'a-') but is weaker in Kuwait (bb+) and the UAE (bb). The average VR is 'bbb-' in Qatar. Increased Shari’ah-focused regulation could potentially have credit implications, which we will assess as implementation progresses. (Zawya) OPEC+ needs to offset large May-July oversupply – Oil producing countries in the OPEC+ group that pumped above supply targets from May to July will need to slash output by over a million barrels per day for two months to compensate, according to OPEC sources and an internal OPEC+ report seen by Reuters. The producer group includes members of the OPEC and other oil powers including Russia, who together pledged to make record cuts of 9.7mn bpd in May to end a huge glut in supply as coronavirus lockdowns destroyed fuel demand worldwide. As demand has started to recover, the group tapered the cuts to 7.7mn bpd in August. Some countries such as Iraq and Nigeria failed to meet those targets and are coming under pressure from other OPEC+ members, including de-facto OPEC leader Saudi Arabia, to reduce production to ensure they compensate by the end of September for the oversupply since the cuts were agreed. The volume they need to reduce is the equivalent to 1.15mn bpd over two months, one OPEC source said, or 2.31mn bpd over one month, according to the OPEC+ report. “Those compensation cuts are only for August and September and they are in addition to the current existing output cuts by the members,” the OPEC source said. The extra cuts, if evenly distributed, would mean that the effective reduction in supplies from the group would be around 8.85mn bpd in August and September, the source added. “This means you would be seeing a big draw from the market over those two months,” said the source. (Reuters) Saudi Aramco suspends $10bn China oil refinery venture – Saudi Arabia’s state oil company has suspended a deal to build a $10bn refining and petrochemicals complex in China, according to sources. Saudi Aramco, decided to stop investing in the facility in China’s Northeastern province of Liaoning after negotiations with its Chinese partners, sources said. The uncertain market outlook was behind the decision, they said. The oil-price crash
- 8. Page 8 of 9 and the virus’s impact on energy demand have changed the calculations for energy companies’ projects around the world. Aramco plans deep cuts to its capital spending as it tries to maintain a $75bn dividend amid low crude prices and rising debt. The Kingdom- Aramco’s main recipient of those dividends -- is suffering a major squeeze on its public finances. The joint venture was signed when Crown Prince Mohammed bin Salman was in Beijing in February last year -- and at the time was seen as a landmark deal with a key ally. Saudi Arabia wanted to increase market share in Asia and also has encouraged Chinese investment in the kingdom. (Bloomberg) ET: Saudi Arabia’s PIF may invest $1bn in Jio’s Fiber assets – Saudi Arabia’s Public Investment Fund (PIF) is in discussions with Reliance Industries Ltd. for investing as much as $1bn in its digital unit’s fiber assets, The Economic Times reported. PIF began talks after Abu Dhabi Investment Authority re-engaged with Reliance on a plan to invest about $1bn in its India fiber assets, the newspaper said. (Bloomberg) Saudi crude exports plunge in June to lowest on record – Crude exports from Saudi Arabia, the world’s largest oil exporter, extended a decline in June to the lowest on record, official data showed on Thursday, as global demand remained squeezed by the COVID-19 pandemic. Exports fell 17.3% from the month before to 4.98mn bpd, their lowest since at least January 2002, data from the Joint Organizations Data Initiative (JODI) showed. Total oil shipped from Saudi Arabia, including oil products, fell 18.7% to 6.08mn bpd from 7.48mn bpd in May, while crude stocks rose by 5.8mn barrels to 153.35mn, the official figures showed. International benchmark Brent crude futures have rebounded sharply since plunging to their lowest in two decades in April, as economies gradually reopened and output curbs eased concerns of oversupply. But they remain down about 32% so far this year. To offset the slump in global demand, the Organization of the Petroleum Exporting Countries and its allies, a group known as OPEC+, said record output cuts that began in May would deepen in August and September. The Kingdom’s crude production dropped nearly 12% to 7.48 MoM in June, a trough since December 2002. Saudi’s domestic crude refinery throughput fell 4.7% to 1.84mn bpd in June, while direct crude burn rose by 62,000 bpd to 469,000 bpd. Saudi total oil products demand in June rose by 330,000 bpd to 2.16mn bpd, data on the JODI website showed. (Reuters) Bahri unit signs $410mn pact with Hyundai Mipo for 10 tankers – National Shipping Co. of Saudi Arabia, also known as Bahri, said its unit signed a contract with Hyundai Mipoc Dockyard for 10 chemical tankers for $410mn. The cost of each tanker is estimated at $41mn; capacity 49,999 DWT each. It will be delivered in batches, starting from 1Q2022 until 1Q2023 and will be funded from cash flow and bank financing. (Bloomberg) UAE finance firms' 2Q2020 profits soar to AED885mn – The investment and finance firms listed on local capital markets in the UAE saw their profits jump to around AED885mn during 2Q2020 from as little as AED13mn only in the comparable period last year, according to the figures released by these companies recently. The growth secured by these companies is driven by the steady performance witnessed by the local stock markets which factored into boosting the returns of the investment and financial services sector in general, a Wam news agency report said. There are six financial and investment firms listed on the Abu Dhabi Securities Exchange and five on the Dubai Financial Market, with the latter having seen its firms record net 2Q2020 profits of AED575mn, a growth of 323.4% over the same period last year. Six companies listed on ADX reported AED310mn during the same period. SHUAA Capital is the best performer with net profits of AED266.8mn in the reference period, the report said. (Zawya) Banks cut exposure to Dubai’s MENA energy as virus hits trade – Several banks are reducing their exposure to Dubai-based oil trader MENA Energy DMCC, as the coronavirus hits commodity businesses and global lenders cut funding. BNP Paribas, Natixis and Middle Eastern lenders including Emirates NBD, Emirates Islamic Bank and National Bank of Fujairah have either frozen credit lines or decided to stop dealing with MENA Energy in recent months, according to sources. Virus lockdowns and travel restrictions caused energy demand to collapse this year. (Bloomberg) Kuwait’s state oil company picks advisor to merge units – Kuwait Petroleum Corp. is hiring a consultant to help merge its subsidiaries as the state-run company slashes capital spending by more than 25% over the next five years. KPC will combine its eight business units into four to streamline operations, according to sources. To make the change as smooth as possible, it plans to sign with a consultant next month, sources said. To chop five-year capital spending to $65bn, KPC canceled some projects and postponed others, including exploration. It also pushed back some expected acquisitions by a subsidiary, Kuwait Foreign Petroleum Exploration Co., sources added. Kuwait’s Supreme Petroleum Council, which oversees the OPEC member’s oil industry, has approved the merger plan. The company’s media office couldn’t immediately be reached for comment. Oil sales provide about 90% of Kuwait’s official revenue, and like many of its Gulf Arab neighbors, the country is retrenching amid a 32% drop in crude prices this year. It is also pumping and selling less crude, due to an output-cuts accord between the OPEC and allied producers. (Bloomberg) Fitch downgrades Batelco to 'B+'; with a Stable outlook – Fitch Ratings has downgraded Bahrain Telecommunications Company's (Batelco) Long-Term Issuer Default Rating (LT IDR) to 'B+' from 'BB-'. The Outlook on the LT IDR is Stable. Fitch has also assigned Batelco a senior unsecured rating of 'B+', in line with the company's IDR. This rating action follows Fitch's downgrade on August 14, 2020 of Bahrain's Long-Term Foreign- and Local-Currency IDRs to 'B+' from 'BB-'. The Outlook on these ratings is Stable. Batelco's IDR is constrained by Bahrain's 'B+' sovereign rating as the Bahraini government owns 77% of the company and exerts strong control over it. The company's Standalone Credit Profile (SCP) remains unchanged at 'bb+'. This reflects its leading domestic position in a competitive Bahraini market as well as the political and economic risks of the countries in which Batelco has international operations. Fitch does not expect significant pressures on the SCP from the coronavirus pandemic, due to Batelco's capacity for flexible free cash flows (FCF) and broadly resilient operational exposure. (Fitch Ratings)
- 9. Contacts Saugata Sarkar, CFA, CAIA Shahan Keushgerian Zaid al-Nafoosi, CMT, CFTe Head of Research Senior Research Analyst Senior Research Analyst Tel: (+974) 4476 6534 Tel: (+974) 4476 6509 Tel: (+974) 4476 6535 saugata.sarkar@qnbfs.com.qa shahan.keushgerian@qnbfs.com.qa zaid.alnafoosi@qnbfs.com.qa Mehmet Aksoy, PhD QNB Financial Services Co. W.L.L. Senior Research Analyst Contact Center: (+974) 4476 6666 Tel: (+974) 4476 6589 PO Box 24025 mehmet.aksoy@qnbfs.com.qa Doha, Qatar Disclaimer and Copyright Notice: This publication has been prepared by QNB Financial Services Co. W.L.L. (“QNBFS”) a wholly-owned subsidiary of Qatar National Bank (Q.P.S.C.). QNB FS is regulated by the Qatar Financial Markets Authority and the Qatar Exchange. Qatar National Bank (Q.P.S.C.) is regulated by the Qatar Central Bank. This publication expresses the views and opinions of QNBFS at a given time only. It is not an offer, promotion or recommendation to buy or sell securities or other investments, nor is it intended to constitute legal, tax, accounting, or financial advice. QNBFS accepts no liability whatsoever for any direct or indirect losses arising from use of this report. Any investment decision should depend on the individual circumstances of the investor and be based on specifically engaged investment advice. We therefore strongly advise potential investors to seek independent professional advice before making any investment decision. Although the information in this report has been obtained from sources that QNBFS believes to be reliable, we have not independently verified such information and it may not be accurate or complete. QNBFS does not make any representations or warranties as to the accuracy and completeness of the information it may contain, and declines any liability in that respect. For reports dealing with Technical Analysis, expressed opinions and/or recommendations may be different or contrary to the opinions/recommendations of QNBFS Fundamental Research as a result of depending solely on the historical technical data (price and volume). QNBFS reserves the right to amend the views and opinions expressed in this publication at any time. It may also express viewpoints or make investment decisions that differ significantly from, or even contradict, the views and opinions included in this report. This report may not be reproduced in whole or in part without permission from QNBFS. COPYRIGHT: No part of this document may be reproduced without the explicit written permission of QNBFS. Page 9 of 9 Rebased Performance Daily Index Performance Source: Bloomberg Source: Bloomberg (*Data as of August 19, 2020) Source: Bloomberg Source: Bloomberg (*$ adjusted returns) 60.0 80.0 100.0 120.0 140.0 160.0 Jul-16 Jul-17 Jul-18 Jul-19 Jul-20 QSE Index S&P Pan Arab S&P GCC (0.1%) (0.5%) 0.2% 0.5% 0.6% 0.9% (0.5%)(1.0%) 0.0% 1.0% 2.0% SaudiArabia Qatar Kuwait* Bahrain* Oman AbuDhabi Dubai Asset/Currency Performance Close ($) 1D% WTD% YTD% Global Indices Performance Close 1D%* WTD%* YTD%* Gold/Ounce 1,940.48 (0.3) (0.2) 27.9 MSCI World Index 2,392.11 0.1 0.3 1.4 Silver/Ounce 26.79 (1.7) 1.3 50.1 DJ Industrial 27,930.33 0.7 (0.0) (2.1) Crude Oil (Brent)/Barrel (FM Future) 44.35 (1.2) (1.0) (32.8) S&P 500 3,397.16 0.3 0.7 5.1 Crude Oil (WTI)/Barrel (FM Future) 42.34 (0.6) 0.8 (30.7) NASDAQ 100 11,311.80 0.4 2.7 26.1 Natural Gas (Henry Hub)/MMBtu 2.32 0.0 6.2 11.0 STOXX 600 365.09 (0.8) (1.4) (8.0) LPG Propane (Arab Gulf)/Ton 50.50 (0.7) 1.5 22.4 DAX 12,764.80 (1.2) (1.7) 1.2 LPG Butane (Arab Gulf)/Ton 50.25 0.0 2.6 (24.3) FTSE 100 6,001.89 (1.0) (1.6) (21.5) Euro 1.18 (0.5) (0.4) 5.2 CAC 40 4,896.33 (1.0) (1.9) (14.1) Yen 105.80 0.0 (0.8) (2.6) Nikkei 22,920.30 0.1 (1.0) (0.4) GBP 1.31 (0.9) 0.0 (1.3) MSCI EM 1,091.85 1.0 (0.1) (2.0) CHF 1.10 (0.4) (0.3) 6.2 SHANGHAI SE Composite 3,380.68 0.4 1.1 11.5 AUD 0.72 (0.4) (0.1) 2.0 HANG SENG 25,113.84 1.3 (0.3) (10.5) USD Index 93.25 0.5 0.2 (3.3) BSE SENSEX 38,434.72 0.6 1.3 (11.5) RUB 74.79 1.3 2.6 20.7 Bovespa 101,521.30 (0.2) (3.4) (37.1) BRL 0.18 (1.1) (3.5) (28.5) RTS 1,262.01 (0.8) (4.7) (18.5) 117.5 111.9 98.5