SlideShare a Scribd company logo
1 of 9
Download to read offline
Page 1 of 9
QSE Intra-Day Movement
Qatar Commentary
The QE Index declined 0.5% to close at 10,097.2. Losses were led by the
Transportation and Real Estate indices, falling 2.6% and 0.6%, respectively. Top
losers were QNBGroup and Qatar Gas Transport Company Limited, falling 3.9% and
3.7%, respectively. Among the top gainers, Qatar General Insurance & Reinsurance
Company gained 2.7%, while The Commercial Bank was up 2.4%.
GCC Commentary
Saudi Arabia: The TASI Index fell 1.0% to close at 7,895.6. Losses were led by the
Utilities and Software & Serv. indices, falling 3.9% and 3.1%, respectively. Mobile
Telecom. Co. declined 9.9%, while The Medit. & Gulf Ins. & Reins. was down 5.4%.
Dubai: The DFM Index fell 0.8% to close at 2,742.4. The Consumer Staples and Disc.
index declined 1.8%, while the Real Estate & Construction index fell 1.5%. Emirates
Refreshments declined 10.0%, while Khaleeji Commercial Bank was down 9.8%.
Abu Dhabi: The ADX General Index fell 0.4% to close at 5,073.4. The Investment &
Financial Services index declined 3.7%, while the Telecom. index fell 1.5%. Abu
Dhabi Ship Building Co. declined 6.4%, while Waha Capital was down 5.9%.
Kuwait: The Kuwait All Share Index gained 0.2% to close at 6,222.9. The Consumer
Goods index rose 0.9%, while the Banks index gained 0.3%. Al Mal Investment
Company rose 62.1%, while Investors Holding Group Co. was up 45.6%.
Oman: The MSM 30 Index fell 0.1% to close at 4,105.7. Losses were led by the
Services and Industrial indices, falling 0.5% each. Oman National Engineering &
Investment Co. declined 7.1%, while Renaissance Services was down 4.9%.
Bahrain: The BHB Index gained 0.2% to close at 1,662.9. The Commercial Banks
index rose 0.3%, while the Services index gained 0.1%. Bahrain Duty Free Complex
rose 1.2%, while National Bank of Bahrain was up 0.8%.
QSE Top Gainers Close* 1D% Vol. ‘000 YTD%
Qatar General Ins. & Reins. Co. 2.32 2.7 11.5 (5.7)
The Commercial Bank 4.74 2.4 2,869.8 0.9
Qatar Oman Investment Company 0.56 1.5 1,449.3 (17.0)
Qatar Industrial Manufacturing Co 3.18 1.0 7.5 (10.9)
Vodafone Qatar 1.18 0.9 1,402.7 1.7
QSE Top Volume Trades Close* 1D% Vol. ‘000 YTD%
Ezdan Holding Group 0.60 (0.5) 10,971.7 (2.3)
United Development Company 1.26 0.8 9,259.4 (17.1)
Masraf Al Rayan 4.08 0.0 6,466.6 3.0
Al Khalij Commercial Bank 1.33 0.8 4,735.8 1.5
QNB Group 19.58 (3.9) 4,196.0 (4.9)
Market Indicators 10 Jan 20 09 Jan 20 %Chg.
Value Traded (QR mn) 237.2 159.6 48.6
Exch. Market Cap. (QR mn) 559,543.3 566,740.8 (1.3)
Volume (mn) 73.1 92.8 (21.3)
Number of Transactions 5,256 4,147 26.7
Companies Traded 45 44 2.3
Market Breadth 17:22 13:26 –
Market Indices Close 1D% WTD% YTD% TTM P/E
Total Return 18,669.44 (0.0) (0.6) (2.7) 14.9
All Share Index 3,017.31 (0.2) (0.6) (2.6) 15.4
Banks 4,231.59 (0.2) (0.3) 0.3 14.7
Industrials 2,739.23 0.2 (0.4) (6.6) 21.6
Transportation 2,313.98 (2.6) (3.7) (9.5) 12.1
Real Estate 1,430.42 (0.6) (3.4) (8.6) 10.7
Insurance 2,661.73 0.6 0.4 (2.7) 15.8
Telecoms 866.57 0.5 0.4 (3.2) 14.8
Consumer 8,141.41 (0.3) (0.3) (5.8) 18.0
Al Rayan Islamic Index 3,770.90 (0.0) (1.0) (4.6) 16.2
GCC Top Gainers## Exchange Close# 1D% Vol. ‘000 YTD%
Ahli Bank Oman 0.14 2.9 520.0 10.8
Sahara Int. Petrochemical Saudi Arabia 16.68 2.3 1,937.0 (7.1)
Arabian Centres Co Ltd Saudi Arabia 29.6 1.4 363.3 1.5
Jabal Omar Dev. Co. Saudi Arabia 25.50 1.2 1,064.3 (6.1)
Bank Nizwa Oman 0.10 1.0 1,242.3 5.3
GCC Top Losers## Exchange Close# 1D% Vol. ‘000 YTD%
DP World Dubai 13.18 (4.4) 81.8 0.6
Saudi Electricity Co. Saudi Arabia 18.50 (4.1) 1,033.3 (8.5)
Rabigh Refining & Petro. Saudi Arabia 17.80 (2.7) 1,487.1 (17.8)
National Petrochem. Co. Saudi Arabia 23.54 (2.7) 75.6 (0.8)
Al Rajhi Bank Saudi Arabia 63.10 (2.6) 10,663.8 (3.5)
Source: Bloomberg (# in Local Currency) (## GCC Top gainers/losers derived from the S&P GCC
Composite Large Mid Cap Index)
QSE Top Losers Close* 1D% Vol. ‘000 YTD%
QNB Group 19.58 (3.9) 4,196.0 (4.9)
Qatar Gas Transport Company 2.10 (3.7) 4,032.1 (12.1)
Qatar First Bank 1.05 (2.8) 2,738.5 28.4
Gulf Warehousing Company 4.63 (2.7) 191.9 (15.5)
Qatari German Co for Med. Dev. 0.60 (2.4) 2,907.3 3.6
QSE Top Value Trades Close* 1D% Val. ‘000 YTD%
QNB Group 19.58 (3.9) 81,891.4 (4.9)
Masraf Al Rayan 4.08 0.0 26,349.2 3.0
The Commercial Bank 4.74 2.4 13,541.9 0.9
Industries Qatar 9.98 0.8 12,605.0 (2.9)
United Development Company 1.26 0.8 11,726.8 (17.1)
Source: Bloomberg (* in QR)
Regional Indices Close 1D% WTD% MTD% YTD%
Exch. Val. Traded
($ mn)
Exchange Mkt.
Cap. ($ mn)
P/E** P/B**
Dividend
Yield
Qatar* 10,097.18 (0.5) (1.1) (3.3) (3.1) 64.73 152,699.4 14.9 1.5 4.2
Dubai 2,742.35 (0.8) (1.0) (1.7) (0.8) 49.38 103,028.7 9.5 1.0 4.3
Abu Dhabi 5,073.38 (0.4) (0.3) (1.6) (0.0) 43.08 143,754.3 15.6 1.4 4.9
Saudi Arabia 7,895.64 (1.0) (2.0) (4.3) (5.9) 983.72 2,271,620.2 21.5 1.7 3.4
Kuwait 6,222.90 0.2 (0.8) (1.6) (0.9) 88.23 116,407.4 15.5 1.4 3.4
Oman 4,105.66 (0.1) (0.6) 0.6 3.1 5.37 17,482.2 7.4 0.8 7.3
Bahrain 1,662.92 0.2 0.4 0.3 3.3 3.04 26,083.9 13.5 1.0 4.7
Source: Bloomberg, Qatar Stock Exchange, Tadawul, Muscat Securities Market and Dubai Financial Market (** TTM; * Value traded ($ mn) do not include special trades, if any, Data as of February 10, 2020)
10,000
10,050
10,100
10,150
9:30 10:00 10:30 11:00 11:30 12:00 12:30 13:00
Page 2 of 9
Qatar Market Commentary
 The QE Index declined 0.5% to close at 10,097.2. The Transportation and
Real Estate indices led the losses. The index fell on the back of selling
pressure from GCC and non-Qatari shareholders despite buying support
from Qatari shareholders.
 QNB Group and Qatar Gas Transport Company Limited were the top
losers, falling 3.9% and 3.7%, respectively. Among the top gainers, Qatar
General Insurance & Reinsurance Company gained 2.7%, while The
Commercial Bank was up 2.4%.
 Volume of shares traded on Monday fell by 21.3% to 73.1mn from 92.8mn
on Sunday. Further, as compared to the 30-day moving average of
82.0mn, volume for the day was 10.9% lower. Ezdan Holding Group and
United Development Company were the most active stocks, contributing
15.0% and 12.7% to the total volume, respectively.
Source: Qatar Stock Exchange (* as a % of traded value)
Earnings Releases, Global Economic Data and Earnings Calendar
Earnings Releases
Company Market Currency
Revenue (mn)
4Q2019
% Change
YoY
Operating Profit
(mn) 4Q2019
% Change
YoY
Net Profit
(mn) 4Q2019
% Change
YoY
Abdullah Al Othaim Markets Co. Saudi Arabia SR 2,105.6 8.1% 160.3 5.8% 142.2 33.0%
Tihama Advertising and Public
Relations Co.
Saudi Arabia SR 40.5 4.4% (2.1) N/A (3.5) N/A
Fawaz Abdulaziz Alhokair Co. Saudi Arabia SR 1,289.8 4.6% 152.1 78.5% 36.0 40.1%
Emirate Integrated
Telecommunications Company*
Dubai AED 12,588.0 -6.2% 1,721.4 1.8% 1,723.5 -1.8%
Orient Insurance* Dubai AED 3,881.1 5.5% – – 413.3 5.1%
Dubai Insurance Co.* Dubai AED 970.5 82.5% 68.2 57.7% 75.6 49.8%
DAMAC Properties Dubai Co* Dubai AED 4,399.2 -28.3% – – (36.9) N/A
Islamic Arab Insurance Company* Dubai AED 1,130.3 6.3% 183.6 20.9% 59.0 12278.8%
Orient Unb Takaful* Dubai AED 255.2 34.0% – – 1.1 N/A
AXA Green Crescent Insurance* Abu Dhabi AED 46.3 16.4% 8.4 6.6% 0.2 N/A
Al Dhafra Insurance Co.* Abu Dhabi AED 323.8 -2.9% 52.3 19.2% 79.4 44.4%
Eshraq Properties Co.* Abu Dhabi AED – – – (10.7) N/A
Abu Dhabi National Takaful Co.* Abu Dhabi AED 467.3 21.9% 162.3 20.0% 72.7 6.3%
Abu Dhabi National Oil Co. For
Distribution*
Abu Dhabi AED 21,337.0 -6.8% 2,301.1 2.5% 2,217.7 4.3%
Bahrain Duty Free Shop Complex* Bahrain BHD 37.6 3.3% 6.4 5.2% 7.5 0.4%
Zain Bahrain* Bahrain BHD 62.9 -5.0% 6.3 24.0% 5.3 1.8%
Source: Company data, DFM, ADX, MSM, TASI, BHB. (*Financial for FY2019)
Global Economic Data
Date Market Source Indicator Period Actual Consensus Previous
02/11 UK UK Office for National Statistics Monthly GDP (MoM) Dec 0.3% 0.2% -0.3%
02/11 UK UK Office for National Statistics GDP QoQ 4Q2019 0.0% 0.0% 0.4%
02/11 UK UK Office for National Statistics GDP YoY 4Q2019 1.1% 0.8% 1.1%
02/11 UK UK Office for National Statistics Industrial Production MoM Dec 0.1% 0.3% -1.1%
02/11 UK UK Office for National Statistics Industrial Production YoY Dec -1.8% -0.8% -2.5%
02/11 UK UK Office for National Statistics Manufacturing Production MoM Dec 0.3% 0.5% -1.6%
02/11 UK UK Office for National Statistics Manufacturing Production YoY Dec -2.5% -1.0% -3.3%
02/11 UK UK Office for National Statistics Industrial Production MoM Dec 0.1% 0.3% -1.1%
02/10 China National Bureau of Statistics PPI YoY Jan 0.1% 0.0% -0.5%
02/10 China National Bureau of Statistics CPI YoY Jan 5.4% 4.9% 4.5%
Source: Bloomberg (s.a. = seasonally adjusted; n.s.a. = non-seasonally adjusted; w.d.a. = working day adjusted)
Overall Activity Buy %* Sell %* Net (QR)
Qatari Individuals 16.96% 18.44% (3,524,923.53)
Qatari Institutions 25.77% 35.03% (21,950,483.21)
Qatari 42.73% 53.47% (25,475,406.74)
GCC Individuals 0.91% 1.14% (541,089.33)
GCC Institutions 0.46% 11.85% (27,025,226.97)
GCC 1.37% 12.99% (27,566,316.30)
Non-Qatari Individuals 5.87% 3.99% 4,466,102.97
Non-Qatari Institutions 50.02% 29.55% 48,575,620.07
Non-Qatari 55.89% 33.54% 53,041,723.04
Page 3 of 9
Earnings Calendar
Tickers Company Name Date of reporting 4Q2019 results No. of days remaining Status
QAMC Qatar Aluminum Manufacturing Company 12-Feb-20 0 Due
QCFS Qatar Cinema & Film Distribution Company 12-Feb-20 0 Due
DOHI Doha Insurance Group 12-Feb-20 0 Due
SIIS Salam International Investment Limited 13-Feb-20 1 Due
ORDS Ooredoo 13-Feb-20 1 Due
QEWS Qatar Electricity & Water Company 16-Feb-20 4 Due
DHBK Doha Bank 17-Feb-20 5 Due
QGTS Qatar Gas Transport Company Limited (Nakilat) 17-Feb-20 5 Due
QGRI Qatar General Insurance & Reinsurance Company 17-Feb-20 5 Due
AHCS Aamal Company 18-Feb-20 6 Due
MERS Al Meera Consumer Goods Company 19-Feb-20 7 Due
GISS Gulf International Services 19-Feb-20 7 Due
MPHC Mesaieed Petrochemical Holding Company 20-Feb-20 8 Due
QNNS Qatar Navigation (Milaha) 25-Feb-20 13 Due
QISI Qatar Islamic Insurance Group 26-Feb-20 14 Due
Source: QSE
News
Qatar
 IQCD's net profit declines 55.3% YoY and 6.7% QoQ in 4Q2019,
misses our estimate – Industries Qatar's (IQCD) net profit
declined 55.3% YoY (-6.7% QoQ) to QR538.1mn in 4Q2019,
missing our estimate of QR572.1mn (variation of -5.9%). The
company's revenue came in at QR1,378.3mn in 4Q2019, which
represents an increase of 11.7% YoY. However, on QoQ basis
revenue fell 1.9%. For the year ended 31 December 2019, the
Group recorded a net profit of QR2.6bn as compared to QR5.0bn,
down 49%, while total revenues declined by 16% to reach
QR13.7bn (assuming proportionate consolidation) as compared
QR16.3bn for 2018. The Group recorded EPS of QR0.43 for the
financial year 2019, as compared to QR0.83 for last year.
Financial performance in 2019 was largely impacted by external
macroeconomic factors that were not within the Group’s control.
These adverse conditions directly translated into declining
commodity prices and caused product prices to fall across the
Group. Average selling prices declined by 14% YoY, which
contributed to a decrease of QR2.0bn in the Group’s net profits
for the financial year 2019 as compared to last year. Group sales
volumes were also affected by macro imbalances in supply and
demand, which were also influenced by lower production due to
planned and unplanned maintenance shutdowns. Sales volume
for the Group has declined by 2% YoY, which contributed to a
decline of QR641mn in the Group’s net profit for the year. The
Group’s production volumes as well fell by 1% as compared to
last year, amid the shutdowns. These preventive maintenance
programs ensure HSE standards, plant life, quality assurance
and reliability to maintain long-term operational efficiency
targets. Group operating facilities maintain efficiency and the
Group’s average reliability factor reached 96% amid a focus on
preventive maintenance. In the fourth quarter, Group’s total
revenue declined by 2% to reach QR3.5bn compared to the third
quarter of 2019, while net profit declined by 7% compared to the
third quarter to reach QR539mn, owing to the deteriorating
macro-economic conditions which led to a decline of 11% in
Group’s average selling prices. The decline in profitability was
slightly offset by impairment reversals from an investment in an
associated company. The sales volumes remained resilient inthe
fourth quarter as compared to the third quarter, with an increase
of 10%. The production levels have declined by 3%, due to
maintenance shutdowns. The Group’s financial position
remained robust, with the liquidity position at the end of the
year reaching QR10.7bn in cash and bank balances, after
accounting for a QR3.6bn dividend paid for 2018 during the year.
IQCD Group’s net cash and bank balance including proportionate
share of joint ventures reached QR12.4bn as at December 31,
2019. This is a testament to the Group’s efficient and effective
cash-flow generation capabilities, which provide confidence and
sustainability in turbulent times. At the end of 2019, the Group
was able to settle its entire debt obligation, making the Group
debt-free. Group’s total assets and total equity reached
QR35.9bn and QR34.2bn, respectively, as of December 31, 2019.
After reviewing the year’s financial performance in light of
macroeconomic conditions, the Group’s liquidity position, and
taking into account future investing and financing needs, the
board of directors proposed a total annual dividend distribution
for the year ended December 31, 2019 of QR2.4bn, equivalent to
a payout of QR0.40 per share and representing a payout ratio of
94%.Operational highlights by segment – Profits in the
Petrochemicals segment remained under pressure, with net
profit declining by 47% in 2019 compared to year 2018, to reach
QR1.3bn. This was mainly due to softening demand for
petrochemical products in key markets, excess capacities, new
environmental regulations in selected economies and declining
prices. In the Fertilizers segment, net profit declined 37% from
2018 to reach QR873mn, largely as the result of an overall decline
in selling prices of 9%, amid supply-demand imbalances. This led
to a decrease of 9% in the segment revenues compared to the last
year. The Steel segment reported revenue of QR5.1bn, a
Page 4 of 9
reduction of 12% from the previous year. This reduction was
driven mainly by the effect of lower selling prices, which
declined by 12%, which was slightly offset by a marginal
increase in sales volumes of 1% compared to 2018. (QNB FS
Research, Company Press Release)
 Ooredoo announces date to pay interest to bondholders –
Ooredoo announced that Ooredoo International Finance Limited
(OIFL), its wholly-owned subsidiary, pursuant to the Terms and
Conditions of the Notes and the Final Terms, will pay its Global
Medium Term Note (GMTN) holders’ interest payment on
February 18, 2020 and February 21, 2020. (QSE)
 UDCD’s world-class 9-hole golf course in Gewan Island to be
ready by 2023 – A state-of-the-art 9-hole golf course, being
developed in the upcoming Gewan Island, is expected to be
completed by 2023. The world-class facility is now being primed
to be another popular sports destination in Qatar. The
membership-based golf course will also welcome all visitors and
members, a top official from United Development Company
(UDCD) has stated. UDCD is the master developer of The Pearl-
Qatar and Gewan Island. The company has launched in 2019 the
construction works for its new master development, the Gewan
Island, which features various residential, retail, and
entertainment facilities. (Peninsula Qatar)
 Mannai Trading Co. and Huawei sign MoU to explore Intelligent
Computing and innovation – Mannai Trading Co. has teamed up
with Huawei Intelligent Computing (Huawei) to jointly explore
intelligent computing and the development of innovative cloud,
artificial intelligence (AI), and knowledge-sharing projects. The
two companies signed a Memorandum of Understanding (MoU)
to initiate their cooperation. Through this cooperation, Mannai
Trading Co. and Huawei will build, market, and deliver industry
solutions with the combination of their technologies and
services for both telecommunications and enterprise IT markets.
The collaboration will also see the establishment of joint labs
with Mannai Trading Co. and Huawei in Qatar, which will aim to
display intelligent computing solutions for government,
telecommunications, education, energy, banking, and other
industries. (QSE)
 QCB: Robust growth in loans help Qatar commercial banks post
12.13% jump in domestic credit – According to Qatar Central
Bank (QCB) data, robust growth in loans, especially to trading
and services, helped commercial banks in Qatar to witness a
12.13% YoY expansion in domestic credit at the end of December
2019. The trading sector saw a yearly 58.13% surge to
QR143.25bn, which accounted for 15% of the total domestic
credit during the review period. The commercial banks' credit to
the services sector saw 30.05% YoY increase to QR281.75bn,
which constituted 29% of the total domestic credit at the end of
December 2019. The credit to the general services witnessed a
29.09% yearly increase to QR255.81bn, which accounted for
91% of the total credit to the services sector. In the case of
financial services, it registered an impressive 40.37% growth to
QR25.94bn at the end of December last year. The real estate
sector, which is the third largest credit recipient, however, saw
credit intake fall 2.09% to QR194.65bn, or 20% of total domestic
credit at the end of December 2019. The consumption sector saw
a 7.86% increase in credit intake to QR137.23bn, or 14% of the
total domestic credit. Credit to the sovereign stood at
QR133.79bn, or 14% of the total domestic credit. It however
showed an 11.93% fall YoY in December 2019. Credit to the
contracting sector declined 4.09% YoY to QR35.85bn, which
stood at 4% of the total domestic credit. The industrial sector
received QR25.94bn credit line, which was 3% of the total
domestic credit. It, however, fell 5.71% YoY. (Gulf-Times.com)
 PwC: Qatar's tax regime is progressively maturing – Qatar's tax
regime is progressively maturing with the introduction of new
executive regulations, including the recent one relating to
withholding tax (WHT), according to PricewaterhouseCoopers
(PwC), a global assurance, advisory and tax services company.
PwC Qatar tax leader Sajid Khan said with the expected
introduction of the new tax administration system 'Dhareeba',
there will be a significant focus on how the tax payers manage
their compliance, which would require them to look at their
internal capabilities to meet these obligations. “We are seeing
Qatar’s progression along the tax maturity curve that it started
to move forward with issuing these regulations,” he said.
Discussions centered on some of the latest changes, including
amongst other key changes are those to the new executive
regulations to the Law No 24 of 2018 issued on December 11,
2019, which are expected to transform the tax landscape in
Qatar. Khan said the new executive regulations have brought
significant changes to a number of areas of tax law including the
scope of WHT, reporting and compliance obligations, changes in
terms of some of the entities that are established in Qatar
subsidiaries and joint ventures of listed companies as well as
how to establish the Qatari nationals ownership. (Gulf-
Times.com)
 Al-Kaabi: Qatar thrust to LNG development helps global shift to
less carbon-intensive energy – HE the Minister of State for
Energy Affairs Saad Sherida Al-Kaabi said natural gas will be the
only form of hydrocarbons to increase its share during the next
30 years while fossil fuels will continue to dominate the global
energy mix during the period. “Today, the share of natural gas in
the global energy mix stands at about 22%. By 2050, this is
expected to rise to 27%, according to the outlook, which is being
launched today,” Al-Kaabi said during the launch of ‘GECF
Global Gas Outlook 2050’. He said natural gas has a key role to
play in addressing the global concerns on environmental
pollution and climate change. “It is versatile, flexible, economic
and clean. More and more countries are moving away from
burning coal and nuclear and are building infrastructure for
cleaner alternatives including natural gas. I am often asked
about renewables and whether we see them as a threat to gas.
The answer is 'no'. We believe that natural gas and renewables
are complementary. As the cleanest fossil fuel, natural gas
comes in handy when the sun is not shining. And when the wind
is not blowing.” He added, “We in Qatar are moving forward with
implementing our mega projects that will see our LNG
production rise from 77mn tons per year to 126mn tons per year
by 2027. This will not only enhance our ability and flexibility to
meet additional demand but also help the shift to less carbon-
intensive energy in many parts of the world. In parallel, Qatar
remains focused on achieving the highest environmental
standards in its LNG industry to significantly reduce emissions
by applying the best available industry technology and CO2
sequestration.” (Gulf-Times.com)
Page 5 of 9
 Qatar among leading long-term LNG export growth drivers –
Qatar and four other producing countries will lead the growth in
liquefied natural gas (LNG) export capacity over the next three
decades during which $9.7tn has been earmarked for investment
in the gas sector. Besides Qatar, the US, Australia, Russia and
Mozambique are projected to lead the growth in export capacity.
With more than 120mn tons per year of liquefaction capacity
under construction and another 260mn tpy planned, the share of
LNG exports will rise from the current 37.2% to 45.2% of total
exports by 2030, and to 50.3% by 2050. Gas production in Gas
Exporting Countries Forum (GECF) countries will grow by almost
50% by 2050 to over 2.5tcm, underlining the continued
importance of the group, according to the "Global Gas Outlook
2050" released in Doha. Growth in LNG trade is the main driving
force and will exceed total pipeline trade by 2050, whereas in
2018 it was only just over half pipeline trade, the outlook said.
The LNG sector is expected to grow at 2.9% to 1,077bcm by 2050,
while pipeline trade will expand more slowly at a rate of 1.2% per
year to reach 1,063bcm by 2050. (Gulf-Times.com)
 Three more stadiums to be launched this year – Supreme
Committee for Delivery and Legacy’s (SC) General Secretary,
Hassan Al-Thawadi revealed that the infrastructure
development for the 2022 FIFA World Cup is at an advanced
stage with many of the works to be completed by this year.
“Three more stadiums will be completed this year, all the major
expressways are to be completed by the end of this year and
Doha Metro- already functional - will be fully operational this
year,” he stated. (Gulf-Times.com)
 Shura Council approves draft law on medical treatment abroad
for Qataris – The Shura Council held its regular weekly meeting
under the chairmanship of HE the Speaker Ahmed bin Abdullah
bin Zaid Al-Mahmoud. The Council discussed the Services and
Public Utilities Committee's report on a draft law on organizing
medical treatment abroad for Qatari citizens. Under the draft
law's provisions, the state will bear the cost of such medical
treatment and other related expenses. (Gulf-Times.com)
International
 US household debt tops $14tn and reaches new record –
American households added $193bn of debt in the fourth
quarter, driven by a surge in mortgage loans, and overall debt
levels rose to a new record at $14.15tn, the Federal Reserve Bank
of New York said. Mortgage balances rose by $120bn in the
fourth quarter to $9.56tn, the New York Fed said in its quarterly
report on household debt. Mortgage originations - pushed up by
an increase in refinancing - also rose to $752bn in the fourth
quarter, reaching the highest volume since the fourth quarter of
2005, the report found. Non-housing debt, including auto loans,
credit cards and student loans, rose by $79bn. (Reuters)
 US job openings hit two-year low, point to slowdown in job
growth – The US job openings dropped for a second straight
month in December to hit their lowest level in two years, while
hiring increased marginally, suggesting a recent acceleration in
job growth was unlikely to be sustained. The report from the
Labor Department on Tuesday also showed a pick-up in layoffs
at the end of the year. Though job openings remain relatively
high, economists said the sharp declines at the end of 2019 were
potentially warning signals for the longest economic expansion
on record, now in its 11th year. Job openings, a measure of labor
demand, decreased 364,000 to 6.4mn, the lowest reading since
December 2017, the Labor Department said in its monthly Job
Openings and Labor Turnover Survey (JOLTS). The second
straight monthly decline in job openings followed a 574,000
plunge in November, which was the biggest drop since August
2015. Vacancies dropped by 14.9% in 2019. They peaked at
7.6mn in November 2018. Some economists said while the steep
decline in job openings from the peak was concerning, they
noted that vacancies continued to outpace the number of
unemployed Americans, which was 5.9mn in January. (Reuters)
 Trump's $4.8tn budget gets chilly reception from Congress – The
White House presented the budget as a blueprint for the
president’s policy priorities. It includes funding to build a wall on
the US border with Mexico and fight the opioid crisis, but cuts
billions of dollars from safety net programs under the banner of
welfare reform. The budget is largely a political document that
serves as a starting point for negotiations with Congress. With
an eye toward reducing debt and deficits, Trump once again
proposed steep cuts to housing, environmental, transportation
and other programs that have been rejected by lawmakers in
past years. Democrats said Trump’s proposal upended his
promise in last week’s State of the Union speech to always
protect the popular Social Security pension plan and the
Medicare health plan for seniors. Trump’s budget would reduce
Medicare spending by lowering drug costs and tightening
eligibility requirements for Social Security’s disability program.
It also would enact new work requirements for people who get
food stamps or use the Medicaid health plan for the poor. Last
year Trump signed a two-year budget deal with Congress that
increased federal spending on defense and several other
domestic programs, adding to a growing government debt.
Trump’s proposed budget for fiscal 2021 includes $2bn to fund
further construction on the border wall with Mexico, a project
that is especially popular with his political base, and funding for
an infrastructure bill that is unlikely to be passed by Democrats
and Republicans in Congress. It forecasts $4.6tn in deficit
reduction over 10 years and assumes economic growth at an
annual rate of roughly 3% for years to come. The Congressional
Budget Office predicts the US economy will grow 2.2% in the
current fiscal year, which ends September 30, and grow less than
2.0% in future years. The economy grew 2.3% in calendar year
2019. (Reuters)
 UK economy flat-lined in fourth quarter before post-election
bounce – Britain’s economy flat-lined in the final three months
of 2019, when the country was in a deadlock over Brexit thatwas
only broken by Prime Minister Boris Johnson’s December
election victory, leading to some signs of a recovery early this
year. Official figures released showed zero growth in the fourth
quarter compared with the third, matching the median forecast
in a Reuters poll of economists. In annual terms, growth was
1.1%, stronger than the poll forecast of 0.8% after upward
revisions to growth in some previous quarters. However, the last
time annual growth was weaker for a calendar quarter was in
mid-2012. The data also showed quarterly growth in household
spending - which has helped drive Britain’s economy for most of
the period since the 2016 Brexit referendum - was the slowest in
four years, rising by just 0.1%. Business investment dropped
1.0% over the same period, the biggest fall since late 2016. There
have been previous signs that consumers reined in their
Page 6 of 9
spending in late 2019, and industry figures published earlier on
Tuesday suggested only a modest increase in January. (Reuters)
 BRC: UK shoppers still wary about spending in January – Britons
kept a tight grip on their spending last month last month, a
survey showed, suggesting that shoppers have not felt the jump
in confidence reported by many companies since December’s
election broke the Brexit logjam. Total retail spending edged up
by an annual 0.4% in January, the British Retail Consortium
(BRC) said. The average increase over the past 12 months was
just 0.2%, the lowest since BRC’s records began in 1995, while
like-for-like retail sales in January, excluding changes in floor
space from one year to the next, were flat. A separate survey by
Barclaycard, which covers a broader range spending, was more
upbeat, showing an annual 3.9% jump in spending by consumers
in January, boosted by spending on fuel and at supermarkets.
(Reuters)
 Sentix: Eurozone’s investor morale falls in February on corona-
virus fears – Investor morale inthe Eurozone fell for the first time
in four months in February over fears that China will not be able
to contain the corona-virus outbreak, a survey showed on
Monday. Sentix’s index for the Eurozone fell to 5.2 from 7.6 in
January. The Reuters consensus forecast was for a fall to 4.1. The
slight drop reflects the fact that investors think the economic
damage from the novel virus has been mostly limited to China,
said Sentix chief Manfred Huebner, adding that the global
economy was getting impetus from the US. (Reuters)
 China 2019 fiscal spending up 8.1%, faster than economic
growth – China’s fiscal spending climbed 8.1% in 2019 from the
previous year, the finance ministry said on Monday, outpacing
economic growth as policymakers sought to ward off a sharper
slowdown. Fiscal revenues increased an annual 3.8% last year,
dragged by a 1.0% rise in tax receipts due to huge tax cuts, the
finance ministry said a statement. Fiscal expenditures were
23.89tn Yuan in 2019, while revenues were 19.04tn Yuan, the
ministry said. Tax and fee cuts exceeded 2.3tn Yuan ($329.5bn)
in 2019, the ministry said, adding that it would continue to
implement tax and fee reductions this year. The ministry said it
would closely watch changes in tax burdens on firms in various
sectors, especially in light of the impact from the corona-virus
outbreak. Non-tax revenues, including incomes from state-
owned firms, fines and confiscations, jumped 20.2%, the
ministry said. The finance ministry has allocated the 2020 local
government special bond quota worth 1.29tn Yuan, including
one trillion Yuan front-loaded in November, it said. Local
governments have completed 55.4% of the bond quota, the
ministry said. China’s economy grew 6.1% in 2019, the weakest
pace in nearly three decades. (Reuters)
 IMF: China can top up stimulus but must focus on reform – China
has room to take fiscal stimulus measures if its economy slows
further but should not lose sight of structural reforms and steps
to address rapid credit growth, a senior International Monetary
Fund (IMF) official said. Changyong Rhee, director of the IMF’s
Asia and Pacific Department, said while it was too early to assess
the impact of the coronavirus outbreak on Asian economies, it
added to risks to the region’s growth outlook. (Reuters)
Regional
 UAE, Saudi Arabia, Qatar among top 10 logistics markets in
Agility's Index – The UAE, Saudi Arabia and Qatar are among the
top 10 logistics markets in the 2020 Agility Emerging Markets
Logistics Index. China and India lead the list, at first and second
place, respectively. The Arabian Gulf countries outperformed
most other emerging market regions in the 11th annual Agility
Index which was put together by the Kuwait-headquartered
logistics firm Agility in partnership with the British research
company Transport Intelligence. The index is a broad gauge of
competitiveness based on logistics strength and business
fundamentals, said a statement from the company. In the GCC,
the UAE (3), Saudi Arabia (6), Qatar (7), Oman (14), Bahrain (15)
and Kuwait (19) were ranked highly in the index. For the first
time since its launch in 2008, the UAE featured in the top 10 list
of all three individual sub-indices of the Index – domestic
logistics, business fundamentals and international logistics. The
jump in the rankings is the result of the country’s continuedopen
financial sector, transparent regulatory system and corruption
protection frameworks and its progress towards a
comprehensive national SME development strategy, according
to Agility. (Zawya)
 S&P: Three factors could hit GCC insurers in 2020 – Intensifying
competition, increasing asset risk, and more onerous and costly
regulations are among the key risks that could affect GCC
insurers' earnings and credit conditions in 2020, S&P Global
Ratings (S&P) stated in a new report. “Despite these challenges,
our ratings are still supported by insurers' robust capital
positions,” said S&P’s credit analyst, Emir Mujkic, commenting
on the "Competition, Asset Risk, And Regulation: The Three
Factors That Could Hit GCC Insurers In 2020," report published
on RatingsDirect. “We anticipate that pressure on some rated
entities will gradually ease, since a number of companies have
strengthened their internal controls and governance
arrangements, or de-risked their asset portfolios following years
of weakening capital and liquidity buffers. However, we expect
that a number of smaller, unprofitable, and/or undercapitalized
insurers will struggle to meet increasing regulatory demands,"
he added. “It is likely that some will have to raise new capital,
consolidate through mergers, or even exit the market entirely.
This could particularly be the case in Saudi Arabia and Kuwait,
where new regulations including higher capital requirements are
likely to be adopted in the near future," Mujkic concluded.
(Zawya)
 Saudi Arabia's PIF plans to have 1,000 employees by end of year
– Saudi Arabia’s sovereign wealth fund Public Investment Fund
(PIF) plans to have over 1,000 employees by the end of this year
from 700 currently, Head of Corporate Finance, Alireza Zaimi
said. He was speaking at a conference in Abu Dhabi. PIF is Saudi
Crown Prince Mohammed bin Salman’s vehicle to boost Saudi
investments at home and abroad, as he seeks to diversify the oil-
heavy economy. (Reuters)
 RJHI posts 169.6% YoY rise in net profit to SR10,159mn in
FY2019 – Al Rajhi Bank (RJHI) recorded net profit of SR10,159mn
in FY2019, an increase of 169.6% YoY. Total operating profit rose
12.5% YoY to SR19,484mn in FY2019. Total revenue for special
commissions/investments rose 13.1% YoY to SR16,963mn in
FY2019. Total assets stood at SR384.1bn at the end of December
31, 2019 as compared to SR364.0bn at the end of December 31,
2018. Loans and advances stood at SR249.7bn (+7.7% YoY),
while customer deposits stood at SR312.4bn (+6.3% YoY) at the
Page 7 of 9
end of December 31, 2019. EPS came in at SR4.06 in FY2019 as
compared to SR1.51 in FY2018. (Tadawul)
 Riyad Bank hires banks for Dollar Sukuk issue – Saudi Arabia’s
Riyad Bank has hired international and regional banks to
arrange the potential issuance of dollar-denominated Sukuk, the
bank stated. The country’s fourth-largest bank has hired
JPMorgan, Riyad Capital, Standard Chartered, First Abu Dhabi
Bank and HSBC to lead the deal. The tier 2 Sukuk sales would be
the first debt issuance under the bank’s program to issue primary
and secondary bonds. The program’s maximum value is $3bn.
(Reuters)
 Saudi Arabia’s ACWA Power sees IPO sooner rather than later –
Saudi Arabia’s ACWA Power International is committed to a
plan to sell shares and sees an initial public offering sooner than
later, the company’s CEO, Paddy Padmanathan said. The record
share sale by Saudi oil giant Saudi Aramco last year created a
better opportunity for ACWA Power to list stocks since it drove
attention to the nation’s market, he said. Saudi Arabia’s Public
Investment Fund (PIF) is set to increase its holding in ACWA
Power to 45% by the end of the quarter, he added. The power
company aims to expand its global presence to 16 countries this
year from 12 now as it opens in nations like Ethiopia, Uzbekistan
and Kazakhstan, he said. Padmanathan did not give a specific
time for the planned IPO. (Bloomberg)
 Dubai January PMI at 50.6 as compared to 52.3 in December –
Dubai's non-oil private sector economy saw a further weakening
of sales growth in January, which slowed to a near four-year low,
prompting a much softer expansion in output and falling job
numbers. Business expectations deteriorated further, while
output charges were again lowered amid efforts to reinvigorate
new orders. The headline IHS Markit Dubai Purchasing
Managers' Index (PMI) is derived from individual diffusion
indices which measure changes in output, new orders,
employment, suppliers’ delivery times and stocks of purchased
goods. The survey covers the Dubai non-oil private sector
economy, with additional sector data published for travel &
tourism, wholesale & retail and construction. The seasonally
adjusted IHS Markit Dubai Purchasing Managers' Index (PMI)
fell from 52.3 in December to 50.6 in January, signaling the
weakest improvement in the health of the non-oil private sector
since February 2016. Growth primarily eased due to a weaker
expansion in business activity and subsequent drop in job
numbers. At the sub-sector level, there was a modest
improvement in the travel & tourism industry. However,
deteriorations in the construction and wholesale & retail sectors
placed downward pressure on the headline index. Output in the
Dubai non-oil economy expanded only modestly at the start of
the year. The rate of growth slowed to the weakest in the current
47-month sequence. According to surveyed firms, activity was
subdued by soft new business volumes. New orders followed a
similar trend to output, with latest data indicating the weakest
increase in demand for nearly four years. According to panelists,
this was mainly due to slow market conditions. Weaker demand
growth impacted hiring activity in January, with employment
falling for the first time since last August. Staff numbers were
reportedly lowered in order to streamline costs. The rate of job
losses was marginal but nevertheless the joint strongest in the
ten-year series history. Meanwhile, average prices set by non-oil
private sector firms declined further at the start of 2020, as has
been the case in each month since May 2018. However, the drop
in prices was the softest for four months. Despite some
companies raising salaries, the overall increase in cost burdens
was marginal in January. In particular, firms noted little pressure
on purchase prices due to soft market demand. Input stocks
continued to increase during the month, extending the current
run of growth that began in November 2018. However, the pace
of expansion was the softest for four months. Meanwhile, firms
registered a second successive month of improving delivery
times, albeit one that was only modest. Lastly, business
expectations slipped in January on the back of softer activity
growth. That said, firms generally regarded the coming 12
months with optimism, citing hopes of market stabilization and
new projects in the year ahead. (Markit)
 Dubai's oversupplied property sector to add more new homes in
2020 – Dubai is expected to this year see the biggest number of
new homes completed in more than a decade, adding to pressure
on a once-booming but now struggling property sector already
weakened by excess supply. The Middle East financial hub,
where the private sector shrank in January for the first time since
2009, has faced a slowing real estate market for most of the past
decade. A total of 62,500 residential units are scheduled to be
completed this year, Knight Frank said, adding that would be the
biggest number of new units since 2008 even though not all were
ultimately expected to be finished. “In the short to medium term
this influx of supply will continue to put pressure on prices and
rents,” Knight Frank said in a report. There were 70,885 new
housing units delivered in 2008, just before Dubai was hit by a
credit crisis sparked by a collapse in its booming real estate
sector - a key contributor to state revenue in a country which
does not have the oil wealth of its Gulf neighbors. Residential
sales prices fell an average of 6% in 2019, as an estimated 35,171
new units were delivered, compared to a 8.6% drop in 2018,
Knight Frank said. Apartment prices on average fell by 8.2% last
year while prices of traditional style houses, known as ‘villas’,
fell 7.3%. Rents dropped 8.1%. Housing prices are down at least
a quarter since 2014, driven by oversupply. Dubai has tried to
stem the downturn by creating a commission in September to
regulate the sector though it is not clear what action has been
taken. (Reuters)
 Abu Dhabi fund Mubadala sees commodities ‘fizzle’ due to virus
– Commodities markets aresetto fizzle as the coronavirus crimps
business worldwide, according to a top executive at Abu Dhabi’s
government-run fund Mubadala Investment Co. Falling
commodity prices are a risk for emerging economies that rely on
the production of raw materials, and investors in these markets
should “be a little bit cautious,” Mubadala Deputy Chief
Executive Officer, Waleed Al Mokarrab Al Muhairi said. The
uncertain outlook for the coronavirus makes it harder for
investors to decide where to put their money, he said. The
disease is hurting economic expansion as airlines cancel flights
and factories look elsewhere for components they would have
bought from China, where the coronavirus originated. Growth in
demand for oil was already fragile amid a supply glut, and
benchmark Brent crude has tumbled 18% this year.
“Commodities are going to be impacted. You see that in
aluminum, you see that in iron ore, you see that in oil,” he said.
Manufacturers are already shifting some operations and supply
Page 8 of 9
chains away from China, he said. Middle Eastern oil-producers
need to continue efforts to diversify their economies and prepare
for a future when sales of crude generate less income, Al Muhairi
said. (Bloomberg)
 Fitch places TAQA on rating watch ‘Positive’ – Fitch Ratings has
placed Abu Dhabi National Energy Company (TAQA) long-term
issuer default rating (IDR) and senior unsecured debt rating of 'A'
on rating watch ‘Positive’ (RWP). The RWP follows the
announcement by Abu Dhabi Power Corporation (ADPower) of
an offer to the board of TAQA to transfer its water and electricity
assets in exchanges for shares. The ADPower offer sets out an
assets transfer valued at about AED120bn at end-2018. In
exchange, TAQA would issue ADPower a convertible
instrument, convertible into 106,367,950,000 ordinary shares in
TAQA upon closing of the transaction. The RWP reflects Fitch's
belief that TAQA's rating could benefit from increased indirect
government shareholding, and strengthening of the links under
Fitch's Government-Related Entities Rating (GRE) criteria
between TAQA and Abu Dhabi (AA/Stable). The RWP also
reflects the transfer of regulated transmission and distribution
assets, resulting in a possible improvement in TAQA's
Standalone Credit Profile. However, we have yet to understand
and assess TAQA's financial policy after the transaction and
expect to resolve the RWP once it closes, which may be in
2H2020. (Bloomberg)
 NBQ posts 3.8% YoY rise in net profit to AED424.4mn in FY2019
– National Bank of Umm Al-Qaiwain (NBQ) recorded net profit
of AED424.4mn in FY2019, an increase of 3.8% YoY. Total
revenues rose 0.8% YoY to AED750.9mn in FY2019. Net
operating profit fell 1.9% YoY to AED501.7mn in FY2019. Total
assets stood at AED14.3bn at the end of December 31, 2019 as
compared to AED14.7bn at the end of December 31, 2018. EPS
came in at AED0.23 in FY2019 as compared to AED0.22 in
FY2018. (ADX)
 Kuwait’s foreign reserves at KD12.09bn by end of 2019 –
Kuwait’s foreign reserves increased by 7.2% YoY in December
2019 to KD12.09bn, compared with KD11.28bn in December
2018, according to official data by the Central Bank of Kuwait
(CBK). On a monthly basis, reserves went down by 1.27% in
December, compared with KD12.25bn last November. Data
shows that reserves do not include foreign assets of the Kuwait
Investment Authority (KIA). By the end of last year, Kuwait's
currency deposits registered KD11.33bn, while special drawing
right (SDR) amounted to KD563.9mn and reserves at the
International Monetary Fund (IMF) reached KD165.7mn.
Meanwhile, gold reserves totaled KD31.7mn. (Zawya)
 Boubyan Bank starts marketing five-year Dollar Sukuk –
Kuwait’s Boubyan Bank has started marketing five-year US
Dollar-denominated Sukuk, or Islamic bonds, at around 150 basis
points (bps) over mid-swaps, a document showed. HSBC and
Standard Chartered were hired as joint global coordinators for
the deal. Bank ABC, Boubyan Capital, First Abu Dhabi Bank,
Islamic Corporation for the Development of the Private Sector,
KFH Capital, Kuwait International Bank and Warba Bank are
also involved in arranging the deal. Boubyan Bank met fixed
income investors in Dubai and London ahead of the potential
benchmark debt sale, which is expected to close later on
Tuesday. Benchmark bonds are generally meant to be upwards
of $500mn. (Reuters)
 Bahrain Bourse issues resolution to list T-Bills and Sukuk –
Bahrain Bourse (BHB) issued Resolution No (4) for the year 2020
to list Treasury Bills (T-Bill) and short-term Islamic lease (Ijarah)
Sukuk that are issued by the Central Bank of Bahrain on behalf
of the Government of Bahrain for the year 2020 at Bahrain
Bourse on the issuance date. According to the resolution, 58
Treasury Bills and 10 short-term Islamic lease Sukuk issues will
be listed during the year 2020 unless stated otherwise. The total
value of the T-Bill issues is BHD4.01bn, while the total value of
the short-term Islamic lease Sukuk issues is BHD260mn.
(Zawya)
 Bahrain sells BHD70mn 91-day bills; bid-cover at 1.83x – Bahrain
sold BHD70mn of 91 day bills due on May 13, 2020. Investors
offered to buy 1.83 times the amount of securities sold. The bills
were sold at a price of 99.373, having a yield of 2.5% and will
settle on February 12, 2020. (Bloomberg)
Contacts
Saugata Sarkar, CFA, CAIA Shahan Keushgerian Zaid al-Nafoosi, CMT, CFTe
Head of Research Senior Research Analyst Senior Research Analyst
Tel: (+974) 4476 6534 Tel: (+974) 4476 6509 Tel: (+974) 4476 6535
saugata.sarkar@qnbfs.com.qa shahan.keushgerian@qnbfs.com.qa zaid.alnafoosi@qnbfs.com.qa
Mehmet Aksoy, PhD QNB Financial Services Co. W.L.L.
Senior Research Analyst Contact Center: (+974) 4476 6666
Tel: (+974) 4476 6589 PO Box 24025
mehmet.aksoy@qnbfs.com.qa Doha, Qatar
Disclaimer and Copyright Notice: This publication has been prepared by QNB Financial Services Co. W.L.L. (“QNB FS”) a wholly-owned subsidiary of Qatar National Bank (Q.P.S.C.). QNB FS is
regulated by the Qatar Financial Markets Authority and the Qatar Exchange. Qatar National Bank (Q.P.S.C.) is regulated by the Qatar Central Bank. This publication expresses the views and
opinions of QNB FS at a given time only. It is not an offer, promotion or recommendation to buy or sell securities or other investments, nor is it intended to constitute legal, tax, accounting, or
financial advice. QNB FS accepts no liability whatsoever for any direct or indirect losses arising from use of this report. Any investment decision should depend on the individual circumstances of
the investor and be based on specifically engaged investment advice. We therefore strongly advise potential investors to seek independent professional advice before making any investment
decision. Although the information in this report has been obtained from sources that QNB FS believes to be reliable, we have not independently verified such information and it may not be accurate
or complete. QNB FS does not make any representations or warranties as to the accuracy and completeness of the information it may contain, and declines any liability in that respect. For reports
dealing with Technical Analysis, expressed opinions and/or recommendations may be different or contrary to the opinions/recommendations of QNB FS Fundamental Research as a result of
depending solely on the historical technical data (price and volume). QNB FS reserves the right to amend the views and opinions expressed in this publication at any time. It may also express
viewpoints or make investment decisions that differ significantly from, or even contradict, the views and opinions included in this report. This report may not be reproduced in whole or in part
without permission from QNB FS.
COPYRIGHT: No part of this document may be reproduced without the explicit written permission of QNB FS.
Page 9 of 9
Rebased Performance Daily Index Performance
Source: Bloomberg Source: Bloomberg (*Data as of February 10, 2020)
Source: Bloomberg Source: Bloomberg (*$ adjusted returns, #
Market was closed on February 11, 2020)
60.0
80.0
100.0
120.0
140.0
Jan-16 Jan-17 Jan-18 Jan-19 Jan-20
QSEIndex S&PPanArab S&PGCC
(1.0%)
(0.5%)
0.2% 0.2%
(0.1%)
(0.4%)
(0.8%)
(1.5%)
(1.0%)
(0.5%)
0.0%
0.5%
SaudiArabia
Qatar*
Kuwait
Bahrain
Oman
AbuDhabi
Dubai
Asset/Currency Performance Close ($) 1D% WTD% YTD% Global Indices Performance Close 1D%* WTD%* YTD%*
Gold/Ounce 1,567.89 (0.3) (0.2) 3.3 MSCI World Index 2,421.26 0.3 0.7 2.7
Silver/Ounce 17.65 (0.7) (0.3) (1.1) DJ Industrial 29,276.34 (0.0) 0.6 2.6
Crude Oil (Brent)/Barrel (FM Future) 54.01 1.4 (0.8) (18.2) S&P 500 3,357.75 0.2 0.9 3.9
Crude Oil (WTI)/Barrel (FM Future) 49.94 0.7 (0.8) (18.2) NASDAQ 100 9,638.94 0.1 1.2 7.4
Natural Gas (Henry Hub)/MMBtu 1.82 (1.6) (3.2) (12.9) STOXX 600 428.48 1.0 0.8 0.2
LPG Propane (Arab Gulf)/Ton 37.25 0.0 (3.2) (9.7) DAX 13,627.84 1.1 0.7 0.2
LPG Butane (Arab Gulf)/Ton 51.00 0.0 1.0 (23.2) FTSE 100 7,499.44 1.0 0.8 (2.9)
Euro 1.09 0.0 (0.3) (2.6) CAC 40 6,054.76 0.8 0.2 (1.5)
Yen 109.79 0.0 0.0 1.1 Nikkei# 23,685.98 0.0 (0.5) (0.6)
GBP 1.30 0.3 0.5 (2.3) MSCI EM 1,099.41 1.1 0.7 (1.4)
CHF 1.02 0.2 0.2 (0.8) SHANGHAI SE Composite 2,901.67 0.7 1.4 (4.9)
AUD 0.67 0.4 0.6 (4.4) HANG SENG 27,583.88 1.3 0.6 (1.9)
USD Index 98.72 (0.1) 0.0 2.4 BSE SENSEX 41,216.14 0.6 0.5 (0.2)
RUB 63.38 (1.2) (1.2) 2.2 Bovespa 115,370.60 2.2 0.9 (7.6)
BRL 0.23 (0.1) (0.2) (7.2) RTS 1,539.56 2.4 1.4 (0.6)
119.9
114.9
96.8

More Related Content

What's hot

QNBFS Daily Market Report February 10, 2021
QNBFS Daily Market Report February 10, 2021QNBFS Daily Market Report February 10, 2021
QNBFS Daily Market Report February 10, 2021QNB Group
 
QNBFS Daily Market Report October 17, 2021
QNBFS Daily Market Report October 17, 2021QNBFS Daily Market Report October 17, 2021
QNBFS Daily Market Report October 17, 2021QNB Group
 
QNBFS Daily Market Report March 30, 2020
QNBFS Daily Market Report March 30, 2020QNBFS Daily Market Report March 30, 2020
QNBFS Daily Market Report March 30, 2020QNB Group
 
QNBFS Daily Market Report October 11, 2021
QNBFS Daily Market Report October 11, 2021QNBFS Daily Market Report October 11, 2021
QNBFS Daily Market Report October 11, 2021QNB Group
 
16 October Daily market report
16 October Daily market report16 October Daily market report
16 October Daily market reportQNB Group
 
QNBFS Daily Market Report March 20, 2022
QNBFS Daily Market Report March 20, 2022QNBFS Daily Market Report March 20, 2022
QNBFS Daily Market Report March 20, 2022QNB Group
 
15 July Daily market report
15 July Daily market report 15 July Daily market report
15 July Daily market report QNB Group
 
QNBFS Daily Market Report March 14, 2022
QNBFS Daily Market Report March 14, 2022QNBFS Daily Market Report March 14, 2022
QNBFS Daily Market Report March 14, 2022QNB Group
 
QNBFS Daily Market Report October 20, 2021
QNBFS Daily Market Report October 20, 2021QNBFS Daily Market Report October 20, 2021
QNBFS Daily Market Report October 20, 2021QNB Group
 
QNBFS Daily Market Report October 25, 2021
QNBFS Daily Market Report October 25, 2021QNBFS Daily Market Report October 25, 2021
QNBFS Daily Market Report October 25, 2021QNB Group
 
10 March Daily market report
10 March Daily market report 10 March Daily market report
10 March Daily market report QNB Group
 
QNBFS Daily Market Report August 16, 2021
QNBFS Daily Market Report August 16, 2021QNBFS Daily Market Report August 16, 2021
QNBFS Daily Market Report August 16, 2021QNB Group
 
QNBFS Daily Market Report February 22, 2017
QNBFS Daily Market Report February 22, 2017QNBFS Daily Market Report February 22, 2017
QNBFS Daily Market Report February 22, 2017QNB Group
 
QNBFS Daily Market Report February 16, 2022
QNBFS Daily Market Report February 16, 2022QNBFS Daily Market Report February 16, 2022
QNBFS Daily Market Report February 16, 2022QNB Group
 
QNBFS Daily Market Report July 15, 2018
QNBFS Daily Market Report July 15, 2018QNBFS Daily Market Report July 15, 2018
QNBFS Daily Market Report July 15, 2018QNB Group
 
QNBFS Daily Market Report July 01, 2021
QNBFS Daily Market Report July 01, 2021QNBFS Daily Market Report July 01, 2021
QNBFS Daily Market Report July 01, 2021QNB Group
 
QNBFS Daily Market Report September 13, 2021
QNBFS Daily Market Report September 13, 2021QNBFS Daily Market Report September 13, 2021
QNBFS Daily Market Report September 13, 2021QNB Group
 
QNBFS Daily Market Report August 12, 2021
QNBFS Daily Market Report August 12, 2021QNBFS Daily Market Report August 12, 2021
QNBFS Daily Market Report August 12, 2021QNB Group
 
QNBFS Daily Market Report March 31, 2020
QNBFS Daily Market Report March 31, 2020QNBFS Daily Market Report March 31, 2020
QNBFS Daily Market Report March 31, 2020QNB Group
 
QNBFS Daily Market Report February 28, 2022
QNBFS Daily Market Report February 28, 2022QNBFS Daily Market Report February 28, 2022
QNBFS Daily Market Report February 28, 2022QNB Group
 

What's hot (20)

QNBFS Daily Market Report February 10, 2021
QNBFS Daily Market Report February 10, 2021QNBFS Daily Market Report February 10, 2021
QNBFS Daily Market Report February 10, 2021
 
QNBFS Daily Market Report October 17, 2021
QNBFS Daily Market Report October 17, 2021QNBFS Daily Market Report October 17, 2021
QNBFS Daily Market Report October 17, 2021
 
QNBFS Daily Market Report March 30, 2020
QNBFS Daily Market Report March 30, 2020QNBFS Daily Market Report March 30, 2020
QNBFS Daily Market Report March 30, 2020
 
QNBFS Daily Market Report October 11, 2021
QNBFS Daily Market Report October 11, 2021QNBFS Daily Market Report October 11, 2021
QNBFS Daily Market Report October 11, 2021
 
16 October Daily market report
16 October Daily market report16 October Daily market report
16 October Daily market report
 
QNBFS Daily Market Report March 20, 2022
QNBFS Daily Market Report March 20, 2022QNBFS Daily Market Report March 20, 2022
QNBFS Daily Market Report March 20, 2022
 
15 July Daily market report
15 July Daily market report 15 July Daily market report
15 July Daily market report
 
QNBFS Daily Market Report March 14, 2022
QNBFS Daily Market Report March 14, 2022QNBFS Daily Market Report March 14, 2022
QNBFS Daily Market Report March 14, 2022
 
QNBFS Daily Market Report October 20, 2021
QNBFS Daily Market Report October 20, 2021QNBFS Daily Market Report October 20, 2021
QNBFS Daily Market Report October 20, 2021
 
QNBFS Daily Market Report October 25, 2021
QNBFS Daily Market Report October 25, 2021QNBFS Daily Market Report October 25, 2021
QNBFS Daily Market Report October 25, 2021
 
10 March Daily market report
10 March Daily market report 10 March Daily market report
10 March Daily market report
 
QNBFS Daily Market Report August 16, 2021
QNBFS Daily Market Report August 16, 2021QNBFS Daily Market Report August 16, 2021
QNBFS Daily Market Report August 16, 2021
 
QNBFS Daily Market Report February 22, 2017
QNBFS Daily Market Report February 22, 2017QNBFS Daily Market Report February 22, 2017
QNBFS Daily Market Report February 22, 2017
 
QNBFS Daily Market Report February 16, 2022
QNBFS Daily Market Report February 16, 2022QNBFS Daily Market Report February 16, 2022
QNBFS Daily Market Report February 16, 2022
 
QNBFS Daily Market Report July 15, 2018
QNBFS Daily Market Report July 15, 2018QNBFS Daily Market Report July 15, 2018
QNBFS Daily Market Report July 15, 2018
 
QNBFS Daily Market Report July 01, 2021
QNBFS Daily Market Report July 01, 2021QNBFS Daily Market Report July 01, 2021
QNBFS Daily Market Report July 01, 2021
 
QNBFS Daily Market Report September 13, 2021
QNBFS Daily Market Report September 13, 2021QNBFS Daily Market Report September 13, 2021
QNBFS Daily Market Report September 13, 2021
 
QNBFS Daily Market Report August 12, 2021
QNBFS Daily Market Report August 12, 2021QNBFS Daily Market Report August 12, 2021
QNBFS Daily Market Report August 12, 2021
 
QNBFS Daily Market Report March 31, 2020
QNBFS Daily Market Report March 31, 2020QNBFS Daily Market Report March 31, 2020
QNBFS Daily Market Report March 31, 2020
 
QNBFS Daily Market Report February 28, 2022
QNBFS Daily Market Report February 28, 2022QNBFS Daily Market Report February 28, 2022
QNBFS Daily Market Report February 28, 2022
 

Similar to QNBFS Daily Market Report February 12, 2020

QNBFS Daily Market Report March 4, 2019
QNBFS Daily Market Report March 4, 2019QNBFS Daily Market Report March 4, 2019
QNBFS Daily Market Report March 4, 2019QNB Group
 
QNBFS Daily Market Report November 03, 2019
QNBFS Daily Market Report November 03, 2019QNBFS Daily Market Report November 03, 2019
QNBFS Daily Market Report November 03, 2019QNB Group
 
QNBFS Daily Market Report April 28, 2019
QNBFS Daily Market Report April 28, 2019QNBFS Daily Market Report April 28, 2019
QNBFS Daily Market Report April 28, 2019QNB Group
 
QNBFS Daily Market Report October 14, 2020
QNBFS Daily Market Report October 14, 2020QNBFS Daily Market Report October 14, 2020
QNBFS Daily Market Report October 14, 2020QNB Group
 
QNBFS Daily Market Report May 09, 2018
QNBFS Daily Market Report May 09, 2018 QNBFS Daily Market Report May 09, 2018
QNBFS Daily Market Report May 09, 2018 QNB Group
 
8 May Daily market report
8 May Daily market report 8 May Daily market report
8 May Daily market report QNB Group
 
QNBFS Daily Market Report October 28, 2020
QNBFS Daily Market Report October 28, 2020QNBFS Daily Market Report October 28, 2020
QNBFS Daily Market Report October 28, 2020QNB Group
 
QNBFS Daily Market Report November 07, 2021
QNBFS Daily Market Report November 07, 2021QNBFS Daily Market Report November 07, 2021
QNBFS Daily Market Report November 07, 2021QNB Group
 
QNBFS Daily Market Report November 08, 2021
QNBFS Daily Market Report November 08, 2021QNBFS Daily Market Report November 08, 2021
QNBFS Daily Market Report November 08, 2021QNB Group
 
QNBFS Daily Market Report July 28, 2020
QNBFS Daily Market Report July 28, 2020QNBFS Daily Market Report July 28, 2020
QNBFS Daily Market Report July 28, 2020QNB Group
 
QNBFS Daily Market Report July 30, 2019
QNBFS Daily Market Report July 30, 2019QNBFS Daily Market Report July 30, 2019
QNBFS Daily Market Report July 30, 2019QNB Group
 
QNBFS Daily Market Report February 16, 2021
QNBFS Daily Market Report February 16, 2021QNBFS Daily Market Report February 16, 2021
QNBFS Daily Market Report February 16, 2021QNB Group
 
QNBFS Daily Market Report February 16, 2020
QNBFS Daily Market Report February 16, 2020QNBFS Daily Market Report February 16, 2020
QNBFS Daily Market Report February 16, 2020QNB Group
 
QNBFS Daily Market Report March 28, 2021
QNBFS Daily Market Report March 28, 2021QNBFS Daily Market Report March 28, 2021
QNBFS Daily Market Report March 28, 2021QNB Group
 
QNBFS Daily Market Report October 29, 2019
QNBFS Daily Market Report October 29, 2019QNBFS Daily Market Report October 29, 2019
QNBFS Daily Market Report October 29, 2019QNB Group
 
QNBFS Daily Market Report November 11, 2018
QNBFS Daily Market Report November 11, 2018QNBFS Daily Market Report November 11, 2018
QNBFS Daily Market Report November 11, 2018QNB Group
 
QNBFS Daily Market Report July 26, 2020
QNBFS Daily Market Report July 26, 2020QNBFS Daily Market Report July 26, 2020
QNBFS Daily Market Report July 26, 2020QNB Group
 
QNBFS Daily Market Report February 14, 2021
QNBFS Daily Market Report February 14, 2021QNBFS Daily Market Report February 14, 2021
QNBFS Daily Market Report February 14, 2021QNB Group
 
QNBFS Daily Market Report October 12, 2020
QNBFS Daily Market Report October 12, 2020QNBFS Daily Market Report October 12, 2020
QNBFS Daily Market Report October 12, 2020QNB Group
 
QNBFS Daily Market Report April 12, 2018
QNBFS Daily Market Report April 12, 2018QNBFS Daily Market Report April 12, 2018
QNBFS Daily Market Report April 12, 2018QNB Group
 

Similar to QNBFS Daily Market Report February 12, 2020 (20)

QNBFS Daily Market Report March 4, 2019
QNBFS Daily Market Report March 4, 2019QNBFS Daily Market Report March 4, 2019
QNBFS Daily Market Report March 4, 2019
 
QNBFS Daily Market Report November 03, 2019
QNBFS Daily Market Report November 03, 2019QNBFS Daily Market Report November 03, 2019
QNBFS Daily Market Report November 03, 2019
 
QNBFS Daily Market Report April 28, 2019
QNBFS Daily Market Report April 28, 2019QNBFS Daily Market Report April 28, 2019
QNBFS Daily Market Report April 28, 2019
 
QNBFS Daily Market Report October 14, 2020
QNBFS Daily Market Report October 14, 2020QNBFS Daily Market Report October 14, 2020
QNBFS Daily Market Report October 14, 2020
 
QNBFS Daily Market Report May 09, 2018
QNBFS Daily Market Report May 09, 2018 QNBFS Daily Market Report May 09, 2018
QNBFS Daily Market Report May 09, 2018
 
8 May Daily market report
8 May Daily market report 8 May Daily market report
8 May Daily market report
 
QNBFS Daily Market Report October 28, 2020
QNBFS Daily Market Report October 28, 2020QNBFS Daily Market Report October 28, 2020
QNBFS Daily Market Report October 28, 2020
 
QNBFS Daily Market Report November 07, 2021
QNBFS Daily Market Report November 07, 2021QNBFS Daily Market Report November 07, 2021
QNBFS Daily Market Report November 07, 2021
 
QNBFS Daily Market Report November 08, 2021
QNBFS Daily Market Report November 08, 2021QNBFS Daily Market Report November 08, 2021
QNBFS Daily Market Report November 08, 2021
 
QNBFS Daily Market Report July 28, 2020
QNBFS Daily Market Report July 28, 2020QNBFS Daily Market Report July 28, 2020
QNBFS Daily Market Report July 28, 2020
 
QNBFS Daily Market Report July 30, 2019
QNBFS Daily Market Report July 30, 2019QNBFS Daily Market Report July 30, 2019
QNBFS Daily Market Report July 30, 2019
 
QNBFS Daily Market Report February 16, 2021
QNBFS Daily Market Report February 16, 2021QNBFS Daily Market Report February 16, 2021
QNBFS Daily Market Report February 16, 2021
 
QNBFS Daily Market Report February 16, 2020
QNBFS Daily Market Report February 16, 2020QNBFS Daily Market Report February 16, 2020
QNBFS Daily Market Report February 16, 2020
 
QNBFS Daily Market Report March 28, 2021
QNBFS Daily Market Report March 28, 2021QNBFS Daily Market Report March 28, 2021
QNBFS Daily Market Report March 28, 2021
 
QNBFS Daily Market Report October 29, 2019
QNBFS Daily Market Report October 29, 2019QNBFS Daily Market Report October 29, 2019
QNBFS Daily Market Report October 29, 2019
 
QNBFS Daily Market Report November 11, 2018
QNBFS Daily Market Report November 11, 2018QNBFS Daily Market Report November 11, 2018
QNBFS Daily Market Report November 11, 2018
 
QNBFS Daily Market Report July 26, 2020
QNBFS Daily Market Report July 26, 2020QNBFS Daily Market Report July 26, 2020
QNBFS Daily Market Report July 26, 2020
 
QNBFS Daily Market Report February 14, 2021
QNBFS Daily Market Report February 14, 2021QNBFS Daily Market Report February 14, 2021
QNBFS Daily Market Report February 14, 2021
 
QNBFS Daily Market Report October 12, 2020
QNBFS Daily Market Report October 12, 2020QNBFS Daily Market Report October 12, 2020
QNBFS Daily Market Report October 12, 2020
 
QNBFS Daily Market Report April 12, 2018
QNBFS Daily Market Report April 12, 2018QNBFS Daily Market Report April 12, 2018
QNBFS Daily Market Report April 12, 2018
 

More from QNB Group

QNBFS Daily Market Report December 24, 2023
QNBFS Daily Market Report December 24, 2023QNBFS Daily Market Report December 24, 2023
QNBFS Daily Market Report December 24, 2023QNB Group
 
QNBFS Daily Market Report November 29, 2023
QNBFS Daily Market Report November 29, 2023QNBFS Daily Market Report November 29, 2023
QNBFS Daily Market Report November 29, 2023QNB Group
 
QNBFS Weekly Market Report November 23, 2023
QNBFS Weekly Market Report November 23, 2023QNBFS Weekly Market Report November 23, 2023
QNBFS Weekly Market Report November 23, 2023QNB Group
 
QNBFS Weekly Market Report November 16, 2023
QNBFS Weekly Market Report November 16, 2023QNBFS Weekly Market Report November 16, 2023
QNBFS Weekly Market Report November 16, 2023QNB Group
 
QNBFS Daily Technical Trader Qatar - November 14, 2023 التحليل الفني اليومي ل...
QNBFS Daily Technical Trader Qatar - November 14, 2023 التحليل الفني اليومي ل...QNBFS Daily Technical Trader Qatar - November 14, 2023 التحليل الفني اليومي ل...
QNBFS Daily Technical Trader Qatar - November 14, 2023 التحليل الفني اليومي ل...QNB Group
 
QNBFS Daily Technical Trader Qatar - November 06, 2023 التحليل الفني اليومي ل...
QNBFS Daily Technical Trader Qatar - November 06, 2023 التحليل الفني اليومي ل...QNBFS Daily Technical Trader Qatar - November 06, 2023 التحليل الفني اليومي ل...
QNBFS Daily Technical Trader Qatar - November 06, 2023 التحليل الفني اليومي ل...QNB Group
 
QNBFS Daily Market Report October 30, 2023
QNBFS Daily Market Report October 30, 2023QNBFS Daily Market Report October 30, 2023
QNBFS Daily Market Report October 30, 2023QNB Group
 
QNBFS Daily Technical Trader Qatar - October 25, 2023 التحليل الفني اليومي لب...
QNBFS Daily Technical Trader Qatar - October 25, 2023 التحليل الفني اليومي لب...QNBFS Daily Technical Trader Qatar - October 25, 2023 التحليل الفني اليومي لب...
QNBFS Daily Technical Trader Qatar - October 25, 2023 التحليل الفني اليومي لب...QNB Group
 
QNBFS Daily Technical Trader Qatar - October 10, 2023 التحليل الفني اليومي لب...
QNBFS Daily Technical Trader Qatar - October 10, 2023 التحليل الفني اليومي لب...QNBFS Daily Technical Trader Qatar - October 10, 2023 التحليل الفني اليومي لب...
QNBFS Daily Technical Trader Qatar - October 10, 2023 التحليل الفني اليومي لب...QNB Group
 
QNBFS Daily Technical Trader Qatar - October 11, 2023 التحليل الفني اليومي لب...
QNBFS Daily Technical Trader Qatar - October 11, 2023 التحليل الفني اليومي لب...QNBFS Daily Technical Trader Qatar - October 11, 2023 التحليل الفني اليومي لب...
QNBFS Daily Technical Trader Qatar - October 11, 2023 التحليل الفني اليومي لب...QNB Group
 
QNBFS Daily Technical Trader Qatar - October 10, 2023 التحليل الفني اليومي لب...
QNBFS Daily Technical Trader Qatar - October 10, 2023 التحليل الفني اليومي لب...QNBFS Daily Technical Trader Qatar - October 10, 2023 التحليل الفني اليومي لب...
QNBFS Daily Technical Trader Qatar - October 10, 2023 التحليل الفني اليومي لب...QNB Group
 
QNBFS Daily Market Report October 04, 2023
QNBFS Daily Market Report October 04, 2023QNBFS Daily Market Report October 04, 2023
QNBFS Daily Market Report October 04, 2023QNB Group
 
QNBFS Daily Technical Trader Qatar - October 04, 2023 التحليل الفني اليومي لب...
QNBFS Daily Technical Trader Qatar - October 04, 2023 التحليل الفني اليومي لب...QNBFS Daily Technical Trader Qatar - October 04, 2023 التحليل الفني اليومي لب...
QNBFS Daily Technical Trader Qatar - October 04, 2023 التحليل الفني اليومي لب...QNB Group
 
QNBFS Daily Technical Trader Qatar - September 28, 2023 التحليل الفني اليومي ...
QNBFS Daily Technical Trader Qatar - September 28, 2023 التحليل الفني اليومي ...QNBFS Daily Technical Trader Qatar - September 28, 2023 التحليل الفني اليومي ...
QNBFS Daily Technical Trader Qatar - September 28, 2023 التحليل الفني اليومي ...QNB Group
 
QNBFS Daily Market Report September 24, 2023
QNBFS Daily Market Report September 24, 2023QNBFS Daily Market Report September 24, 2023
QNBFS Daily Market Report September 24, 2023QNB Group
 
QNBFS Daily Technical Trader Qatar - September 24, 2023 التحليل الفني اليومي ...
QNBFS Daily Technical Trader Qatar - September 24, 2023 التحليل الفني اليومي ...QNBFS Daily Technical Trader Qatar - September 24, 2023 التحليل الفني اليومي ...
QNBFS Daily Technical Trader Qatar - September 24, 2023 التحليل الفني اليومي ...QNB Group
 
QNBFS Daily Technical Trader Qatar - September 19, 2023 التحليل الفني اليومي ...
QNBFS Daily Technical Trader Qatar - September 19, 2023 التحليل الفني اليومي ...QNBFS Daily Technical Trader Qatar - September 19, 2023 التحليل الفني اليومي ...
QNBFS Daily Technical Trader Qatar - September 19, 2023 التحليل الفني اليومي ...QNB Group
 
QNBFS Daily Market Report September 17, 2023
QNBFS Daily Market Report September 17, 2023QNBFS Daily Market Report September 17, 2023
QNBFS Daily Market Report September 17, 2023QNB Group
 
QNBFS Weekly Market Report September 07, 2023
QNBFS Weekly Market Report September 07, 2023QNBFS Weekly Market Report September 07, 2023
QNBFS Weekly Market Report September 07, 2023QNB Group
 
QNBFS Daily Technical Trader Qatar - September 07, 2023 التحليل الفني اليومي ...
QNBFS Daily Technical Trader Qatar - September 07, 2023 التحليل الفني اليومي ...QNBFS Daily Technical Trader Qatar - September 07, 2023 التحليل الفني اليومي ...
QNBFS Daily Technical Trader Qatar - September 07, 2023 التحليل الفني اليومي ...QNB Group
 

More from QNB Group (20)

QNBFS Daily Market Report December 24, 2023
QNBFS Daily Market Report December 24, 2023QNBFS Daily Market Report December 24, 2023
QNBFS Daily Market Report December 24, 2023
 
QNBFS Daily Market Report November 29, 2023
QNBFS Daily Market Report November 29, 2023QNBFS Daily Market Report November 29, 2023
QNBFS Daily Market Report November 29, 2023
 
QNBFS Weekly Market Report November 23, 2023
QNBFS Weekly Market Report November 23, 2023QNBFS Weekly Market Report November 23, 2023
QNBFS Weekly Market Report November 23, 2023
 
QNBFS Weekly Market Report November 16, 2023
QNBFS Weekly Market Report November 16, 2023QNBFS Weekly Market Report November 16, 2023
QNBFS Weekly Market Report November 16, 2023
 
QNBFS Daily Technical Trader Qatar - November 14, 2023 التحليل الفني اليومي ل...
QNBFS Daily Technical Trader Qatar - November 14, 2023 التحليل الفني اليومي ل...QNBFS Daily Technical Trader Qatar - November 14, 2023 التحليل الفني اليومي ل...
QNBFS Daily Technical Trader Qatar - November 14, 2023 التحليل الفني اليومي ل...
 
QNBFS Daily Technical Trader Qatar - November 06, 2023 التحليل الفني اليومي ل...
QNBFS Daily Technical Trader Qatar - November 06, 2023 التحليل الفني اليومي ل...QNBFS Daily Technical Trader Qatar - November 06, 2023 التحليل الفني اليومي ل...
QNBFS Daily Technical Trader Qatar - November 06, 2023 التحليل الفني اليومي ل...
 
QNBFS Daily Market Report October 30, 2023
QNBFS Daily Market Report October 30, 2023QNBFS Daily Market Report October 30, 2023
QNBFS Daily Market Report October 30, 2023
 
QNBFS Daily Technical Trader Qatar - October 25, 2023 التحليل الفني اليومي لب...
QNBFS Daily Technical Trader Qatar - October 25, 2023 التحليل الفني اليومي لب...QNBFS Daily Technical Trader Qatar - October 25, 2023 التحليل الفني اليومي لب...
QNBFS Daily Technical Trader Qatar - October 25, 2023 التحليل الفني اليومي لب...
 
QNBFS Daily Technical Trader Qatar - October 10, 2023 التحليل الفني اليومي لب...
QNBFS Daily Technical Trader Qatar - October 10, 2023 التحليل الفني اليومي لب...QNBFS Daily Technical Trader Qatar - October 10, 2023 التحليل الفني اليومي لب...
QNBFS Daily Technical Trader Qatar - October 10, 2023 التحليل الفني اليومي لب...
 
QNBFS Daily Technical Trader Qatar - October 11, 2023 التحليل الفني اليومي لب...
QNBFS Daily Technical Trader Qatar - October 11, 2023 التحليل الفني اليومي لب...QNBFS Daily Technical Trader Qatar - October 11, 2023 التحليل الفني اليومي لب...
QNBFS Daily Technical Trader Qatar - October 11, 2023 التحليل الفني اليومي لب...
 
QNBFS Daily Technical Trader Qatar - October 10, 2023 التحليل الفني اليومي لب...
QNBFS Daily Technical Trader Qatar - October 10, 2023 التحليل الفني اليومي لب...QNBFS Daily Technical Trader Qatar - October 10, 2023 التحليل الفني اليومي لب...
QNBFS Daily Technical Trader Qatar - October 10, 2023 التحليل الفني اليومي لب...
 
QNBFS Daily Market Report October 04, 2023
QNBFS Daily Market Report October 04, 2023QNBFS Daily Market Report October 04, 2023
QNBFS Daily Market Report October 04, 2023
 
QNBFS Daily Technical Trader Qatar - October 04, 2023 التحليل الفني اليومي لب...
QNBFS Daily Technical Trader Qatar - October 04, 2023 التحليل الفني اليومي لب...QNBFS Daily Technical Trader Qatar - October 04, 2023 التحليل الفني اليومي لب...
QNBFS Daily Technical Trader Qatar - October 04, 2023 التحليل الفني اليومي لب...
 
QNBFS Daily Technical Trader Qatar - September 28, 2023 التحليل الفني اليومي ...
QNBFS Daily Technical Trader Qatar - September 28, 2023 التحليل الفني اليومي ...QNBFS Daily Technical Trader Qatar - September 28, 2023 التحليل الفني اليومي ...
QNBFS Daily Technical Trader Qatar - September 28, 2023 التحليل الفني اليومي ...
 
QNBFS Daily Market Report September 24, 2023
QNBFS Daily Market Report September 24, 2023QNBFS Daily Market Report September 24, 2023
QNBFS Daily Market Report September 24, 2023
 
QNBFS Daily Technical Trader Qatar - September 24, 2023 التحليل الفني اليومي ...
QNBFS Daily Technical Trader Qatar - September 24, 2023 التحليل الفني اليومي ...QNBFS Daily Technical Trader Qatar - September 24, 2023 التحليل الفني اليومي ...
QNBFS Daily Technical Trader Qatar - September 24, 2023 التحليل الفني اليومي ...
 
QNBFS Daily Technical Trader Qatar - September 19, 2023 التحليل الفني اليومي ...
QNBFS Daily Technical Trader Qatar - September 19, 2023 التحليل الفني اليومي ...QNBFS Daily Technical Trader Qatar - September 19, 2023 التحليل الفني اليومي ...
QNBFS Daily Technical Trader Qatar - September 19, 2023 التحليل الفني اليومي ...
 
QNBFS Daily Market Report September 17, 2023
QNBFS Daily Market Report September 17, 2023QNBFS Daily Market Report September 17, 2023
QNBFS Daily Market Report September 17, 2023
 
QNBFS Weekly Market Report September 07, 2023
QNBFS Weekly Market Report September 07, 2023QNBFS Weekly Market Report September 07, 2023
QNBFS Weekly Market Report September 07, 2023
 
QNBFS Daily Technical Trader Qatar - September 07, 2023 التحليل الفني اليومي ...
QNBFS Daily Technical Trader Qatar - September 07, 2023 التحليل الفني اليومي ...QNBFS Daily Technical Trader Qatar - September 07, 2023 التحليل الفني اليومي ...
QNBFS Daily Technical Trader Qatar - September 07, 2023 التحليل الفني اليومي ...
 

Recently uploaded

AfRESFullPaper22018EmpiricalPerformanceofRealEstateInvestmentTrustsandShareho...
AfRESFullPaper22018EmpiricalPerformanceofRealEstateInvestmentTrustsandShareho...AfRESFullPaper22018EmpiricalPerformanceofRealEstateInvestmentTrustsandShareho...
AfRESFullPaper22018EmpiricalPerformanceofRealEstateInvestmentTrustsandShareho...yordanosyohannes2
 
原版1:1复刻堪萨斯大学毕业证KU毕业证留信学历认证
原版1:1复刻堪萨斯大学毕业证KU毕业证留信学历认证原版1:1复刻堪萨斯大学毕业证KU毕业证留信学历认证
原版1:1复刻堪萨斯大学毕业证KU毕业证留信学历认证jdkhjh
 
House of Commons ; CDC schemes overview document
House of Commons ; CDC schemes overview documentHouse of Commons ; CDC schemes overview document
House of Commons ; CDC schemes overview documentHenry Tapper
 
Monthly Market Risk Update: April 2024 [SlideShare]
Monthly Market Risk Update: April 2024 [SlideShare]Monthly Market Risk Update: April 2024 [SlideShare]
Monthly Market Risk Update: April 2024 [SlideShare]Commonwealth
 
Quantitative Analysis of Retail Sector Companies
Quantitative Analysis of Retail Sector CompaniesQuantitative Analysis of Retail Sector Companies
Quantitative Analysis of Retail Sector Companiesprashantbhati354
 
Financial Leverage Definition, Advantages, and Disadvantages
Financial Leverage Definition, Advantages, and DisadvantagesFinancial Leverage Definition, Advantages, and Disadvantages
Financial Leverage Definition, Advantages, and Disadvantagesjayjaymabutot13
 
magnetic-pensions-a-new-blueprint-for-the-dc-landscape.pdf
magnetic-pensions-a-new-blueprint-for-the-dc-landscape.pdfmagnetic-pensions-a-new-blueprint-for-the-dc-landscape.pdf
magnetic-pensions-a-new-blueprint-for-the-dc-landscape.pdfHenry Tapper
 
Log your LOA pain with Pension Lab's brilliant campaign
Log your LOA pain with Pension Lab's brilliant campaignLog your LOA pain with Pension Lab's brilliant campaign
Log your LOA pain with Pension Lab's brilliant campaignHenry Tapper
 
VIP Call Girls LB Nagar ( Hyderabad ) Phone 8250192130 | ₹5k To 25k With Room...
VIP Call Girls LB Nagar ( Hyderabad ) Phone 8250192130 | ₹5k To 25k With Room...VIP Call Girls LB Nagar ( Hyderabad ) Phone 8250192130 | ₹5k To 25k With Room...
VIP Call Girls LB Nagar ( Hyderabad ) Phone 8250192130 | ₹5k To 25k With Room...Suhani Kapoor
 
call girls in Nand Nagri (DELHI) 🔝 >༒9953330565🔝 genuine Escort Service 🔝✔️✔️
call girls in  Nand Nagri (DELHI) 🔝 >༒9953330565🔝 genuine Escort Service 🔝✔️✔️call girls in  Nand Nagri (DELHI) 🔝 >༒9953330565🔝 genuine Escort Service 🔝✔️✔️
call girls in Nand Nagri (DELHI) 🔝 >༒9953330565🔝 genuine Escort Service 🔝✔️✔️9953056974 Low Rate Call Girls In Saket, Delhi NCR
 
How Automation is Driving Efficiency Through the Last Mile of Reporting
How Automation is Driving Efficiency Through the Last Mile of ReportingHow Automation is Driving Efficiency Through the Last Mile of Reporting
How Automation is Driving Efficiency Through the Last Mile of ReportingAggregage
 
Q3 2024 Earnings Conference Call and Webcast Slides
Q3 2024 Earnings Conference Call and Webcast SlidesQ3 2024 Earnings Conference Call and Webcast Slides
Q3 2024 Earnings Conference Call and Webcast SlidesMarketing847413
 
原版1:1复刻温哥华岛大学毕业证Vancouver毕业证留信学历认证
原版1:1复刻温哥华岛大学毕业证Vancouver毕业证留信学历认证原版1:1复刻温哥华岛大学毕业证Vancouver毕业证留信学历认证
原版1:1复刻温哥华岛大学毕业证Vancouver毕业证留信学历认证rjrjkk
 
SBP-Market-Operations and market managment
SBP-Market-Operations and market managmentSBP-Market-Operations and market managment
SBP-Market-Operations and market managmentfactical
 
Classical Theory of Macroeconomics by Adam Smith
Classical Theory of Macroeconomics by Adam SmithClassical Theory of Macroeconomics by Adam Smith
Classical Theory of Macroeconomics by Adam SmithAdamYassin2
 
Bladex 1Q24 Earning Results Presentation
Bladex 1Q24 Earning Results PresentationBladex 1Q24 Earning Results Presentation
Bladex 1Q24 Earning Results PresentationBladex
 
Interimreport1 January–31 March2024 Elo Mutual Pension Insurance Company
Interimreport1 January–31 March2024 Elo Mutual Pension Insurance CompanyInterimreport1 January–31 March2024 Elo Mutual Pension Insurance Company
Interimreport1 January–31 March2024 Elo Mutual Pension Insurance CompanyTyöeläkeyhtiö Elo
 
Lundin Gold April 2024 Corporate Presentation v4.pdf
Lundin Gold April 2024 Corporate Presentation v4.pdfLundin Gold April 2024 Corporate Presentation v4.pdf
Lundin Gold April 2024 Corporate Presentation v4.pdfAdnet Communications
 
Stock Market Brief Deck for 4/24/24 .pdf
Stock Market Brief Deck for 4/24/24 .pdfStock Market Brief Deck for 4/24/24 .pdf
Stock Market Brief Deck for 4/24/24 .pdfMichael Silva
 

Recently uploaded (20)

AfRESFullPaper22018EmpiricalPerformanceofRealEstateInvestmentTrustsandShareho...
AfRESFullPaper22018EmpiricalPerformanceofRealEstateInvestmentTrustsandShareho...AfRESFullPaper22018EmpiricalPerformanceofRealEstateInvestmentTrustsandShareho...
AfRESFullPaper22018EmpiricalPerformanceofRealEstateInvestmentTrustsandShareho...
 
原版1:1复刻堪萨斯大学毕业证KU毕业证留信学历认证
原版1:1复刻堪萨斯大学毕业证KU毕业证留信学历认证原版1:1复刻堪萨斯大学毕业证KU毕业证留信学历认证
原版1:1复刻堪萨斯大学毕业证KU毕业证留信学历认证
 
House of Commons ; CDC schemes overview document
House of Commons ; CDC schemes overview documentHouse of Commons ; CDC schemes overview document
House of Commons ; CDC schemes overview document
 
Monthly Market Risk Update: April 2024 [SlideShare]
Monthly Market Risk Update: April 2024 [SlideShare]Monthly Market Risk Update: April 2024 [SlideShare]
Monthly Market Risk Update: April 2024 [SlideShare]
 
Quantitative Analysis of Retail Sector Companies
Quantitative Analysis of Retail Sector CompaniesQuantitative Analysis of Retail Sector Companies
Quantitative Analysis of Retail Sector Companies
 
Financial Leverage Definition, Advantages, and Disadvantages
Financial Leverage Definition, Advantages, and DisadvantagesFinancial Leverage Definition, Advantages, and Disadvantages
Financial Leverage Definition, Advantages, and Disadvantages
 
magnetic-pensions-a-new-blueprint-for-the-dc-landscape.pdf
magnetic-pensions-a-new-blueprint-for-the-dc-landscape.pdfmagnetic-pensions-a-new-blueprint-for-the-dc-landscape.pdf
magnetic-pensions-a-new-blueprint-for-the-dc-landscape.pdf
 
Log your LOA pain with Pension Lab's brilliant campaign
Log your LOA pain with Pension Lab's brilliant campaignLog your LOA pain with Pension Lab's brilliant campaign
Log your LOA pain with Pension Lab's brilliant campaign
 
VIP Call Girls LB Nagar ( Hyderabad ) Phone 8250192130 | ₹5k To 25k With Room...
VIP Call Girls LB Nagar ( Hyderabad ) Phone 8250192130 | ₹5k To 25k With Room...VIP Call Girls LB Nagar ( Hyderabad ) Phone 8250192130 | ₹5k To 25k With Room...
VIP Call Girls LB Nagar ( Hyderabad ) Phone 8250192130 | ₹5k To 25k With Room...
 
call girls in Nand Nagri (DELHI) 🔝 >༒9953330565🔝 genuine Escort Service 🔝✔️✔️
call girls in  Nand Nagri (DELHI) 🔝 >༒9953330565🔝 genuine Escort Service 🔝✔️✔️call girls in  Nand Nagri (DELHI) 🔝 >༒9953330565🔝 genuine Escort Service 🔝✔️✔️
call girls in Nand Nagri (DELHI) 🔝 >༒9953330565🔝 genuine Escort Service 🔝✔️✔️
 
How Automation is Driving Efficiency Through the Last Mile of Reporting
How Automation is Driving Efficiency Through the Last Mile of ReportingHow Automation is Driving Efficiency Through the Last Mile of Reporting
How Automation is Driving Efficiency Through the Last Mile of Reporting
 
Q3 2024 Earnings Conference Call and Webcast Slides
Q3 2024 Earnings Conference Call and Webcast SlidesQ3 2024 Earnings Conference Call and Webcast Slides
Q3 2024 Earnings Conference Call and Webcast Slides
 
🔝+919953056974 🔝young Delhi Escort service Pusa Road
🔝+919953056974 🔝young Delhi Escort service Pusa Road🔝+919953056974 🔝young Delhi Escort service Pusa Road
🔝+919953056974 🔝young Delhi Escort service Pusa Road
 
原版1:1复刻温哥华岛大学毕业证Vancouver毕业证留信学历认证
原版1:1复刻温哥华岛大学毕业证Vancouver毕业证留信学历认证原版1:1复刻温哥华岛大学毕业证Vancouver毕业证留信学历认证
原版1:1复刻温哥华岛大学毕业证Vancouver毕业证留信学历认证
 
SBP-Market-Operations and market managment
SBP-Market-Operations and market managmentSBP-Market-Operations and market managment
SBP-Market-Operations and market managment
 
Classical Theory of Macroeconomics by Adam Smith
Classical Theory of Macroeconomics by Adam SmithClassical Theory of Macroeconomics by Adam Smith
Classical Theory of Macroeconomics by Adam Smith
 
Bladex 1Q24 Earning Results Presentation
Bladex 1Q24 Earning Results PresentationBladex 1Q24 Earning Results Presentation
Bladex 1Q24 Earning Results Presentation
 
Interimreport1 January–31 March2024 Elo Mutual Pension Insurance Company
Interimreport1 January–31 March2024 Elo Mutual Pension Insurance CompanyInterimreport1 January–31 March2024 Elo Mutual Pension Insurance Company
Interimreport1 January–31 March2024 Elo Mutual Pension Insurance Company
 
Lundin Gold April 2024 Corporate Presentation v4.pdf
Lundin Gold April 2024 Corporate Presentation v4.pdfLundin Gold April 2024 Corporate Presentation v4.pdf
Lundin Gold April 2024 Corporate Presentation v4.pdf
 
Stock Market Brief Deck for 4/24/24 .pdf
Stock Market Brief Deck for 4/24/24 .pdfStock Market Brief Deck for 4/24/24 .pdf
Stock Market Brief Deck for 4/24/24 .pdf
 

QNBFS Daily Market Report February 12, 2020

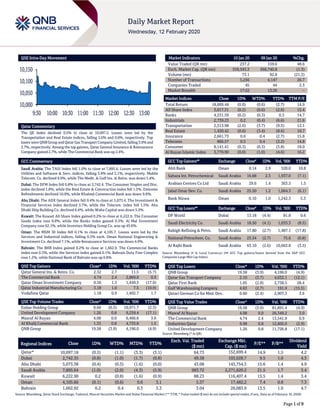
  • 1. Page 1 of 9 QSE Intra-Day Movement Qatar Commentary The QE Index declined 0.5% to close at 10,097.2. Losses were led by the Transportation and Real Estate indices, falling 2.6% and 0.6%, respectively. Top losers were QNBGroup and Qatar Gas Transport Company Limited, falling 3.9% and 3.7%, respectively. Among the top gainers, Qatar General Insurance & Reinsurance Company gained 2.7%, while The Commercial Bank was up 2.4%. GCC Commentary Saudi Arabia: The TASI Index fell 1.0% to close at 7,895.6. Losses were led by the Utilities and Software & Serv. indices, falling 3.9% and 3.1%, respectively. Mobile Telecom. Co. declined 9.9%, while The Medit. & Gulf Ins. & Reins. was down 5.4%. Dubai: The DFM Index fell 0.8% to close at 2,742.4. The Consumer Staples and Disc. index declined 1.8%, while the Real Estate & Construction index fell 1.5%. Emirates Refreshments declined 10.0%, while Khaleeji Commercial Bank was down 9.8%. Abu Dhabi: The ADX General Index fell 0.4% to close at 5,073.4. The Investment & Financial Services index declined 3.7%, while the Telecom. index fell 1.5%. Abu Dhabi Ship Building Co. declined 6.4%, while Waha Capital was down 5.9%. Kuwait: The Kuwait All Share Index gained 0.2% to close at 6,222.9. The Consumer Goods index rose 0.9%, while the Banks index gained 0.3%. Al Mal Investment Company rose 62.1%, while Investors Holding Group Co. was up 45.6%. Oman: The MSM 30 Index fell 0.1% to close at 4,105.7. Losses were led by the Services and Industrial indices, falling 0.5% each. Oman National Engineering & Investment Co. declined 7.1%, while Renaissance Services was down 4.9%. Bahrain: The BHB Index gained 0.2% to close at 1,662.9. The Commercial Banks index rose 0.3%, while the Services index gained 0.1%. Bahrain Duty Free Complex rose 1.2%, while National Bank of Bahrain was up 0.8%. QSE Top Gainers Close* 1D% Vol. ‘000 YTD% Qatar General Ins. & Reins. Co. 2.32 2.7 11.5 (5.7) The Commercial Bank 4.74 2.4 2,869.8 0.9 Qatar Oman Investment Company 0.56 1.5 1,449.3 (17.0) Qatar Industrial Manufacturing Co 3.18 1.0 7.5 (10.9) Vodafone Qatar 1.18 0.9 1,402.7 1.7 QSE Top Volume Trades Close* 1D% Vol. ‘000 YTD% Ezdan Holding Group 0.60 (0.5) 10,971.7 (2.3) United Development Company 1.26 0.8 9,259.4 (17.1) Masraf Al Rayan 4.08 0.0 6,466.6 3.0 Al Khalij Commercial Bank 1.33 0.8 4,735.8 1.5 QNB Group 19.58 (3.9) 4,196.0 (4.9) Market Indicators 10 Jan 20 09 Jan 20 %Chg. Value Traded (QR mn) 237.2 159.6 48.6 Exch. Market Cap. (QR mn) 559,543.3 566,740.8 (1.3) Volume (mn) 73.1 92.8 (21.3) Number of Transactions 5,256 4,147 26.7 Companies Traded 45 44 2.3 Market Breadth 17:22 13:26 – Market Indices Close 1D% WTD% YTD% TTM P/E Total Return 18,669.44 (0.0) (0.6) (2.7) 14.9 All Share Index 3,017.31 (0.2) (0.6) (2.6) 15.4 Banks 4,231.59 (0.2) (0.3) 0.3 14.7 Industrials 2,739.23 0.2 (0.4) (6.6) 21.6 Transportation 2,313.98 (2.6) (3.7) (9.5) 12.1 Real Estate 1,430.42 (0.6) (3.4) (8.6) 10.7 Insurance 2,661.73 0.6 0.4 (2.7) 15.8 Telecoms 866.57 0.5 0.4 (3.2) 14.8 Consumer 8,141.41 (0.3) (0.3) (5.8) 18.0 Al Rayan Islamic Index 3,770.90 (0.0) (1.0) (4.6) 16.2 GCC Top Gainers## Exchange Close# 1D% Vol. ‘000 YTD% Ahli Bank Oman 0.14 2.9 520.0 10.8 Sahara Int. Petrochemical Saudi Arabia 16.68 2.3 1,937.0 (7.1) Arabian Centres Co Ltd Saudi Arabia 29.6 1.4 363.3 1.5 Jabal Omar Dev. Co. Saudi Arabia 25.50 1.2 1,064.3 (6.1) Bank Nizwa Oman 0.10 1.0 1,242.3 5.3 GCC Top Losers## Exchange Close# 1D% Vol. ‘000 YTD% DP World Dubai 13.18 (4.4) 81.8 0.6 Saudi Electricity Co. Saudi Arabia 18.50 (4.1) 1,033.3 (8.5) Rabigh Refining & Petro. Saudi Arabia 17.80 (2.7) 1,487.1 (17.8) National Petrochem. Co. Saudi Arabia 23.54 (2.7) 75.6 (0.8) Al Rajhi Bank Saudi Arabia 63.10 (2.6) 10,663.8 (3.5) Source: Bloomberg (# in Local Currency) (## GCC Top gainers/losers derived from the S&P GCC Composite Large Mid Cap Index) QSE Top Losers Close* 1D% Vol. ‘000 YTD% QNB Group 19.58 (3.9) 4,196.0 (4.9) Qatar Gas Transport Company 2.10 (3.7) 4,032.1 (12.1) Qatar First Bank 1.05 (2.8) 2,738.5 28.4 Gulf Warehousing Company 4.63 (2.7) 191.9 (15.5) Qatari German Co for Med. Dev. 0.60 (2.4) 2,907.3 3.6 QSE Top Value Trades Close* 1D% Val. ‘000 YTD% QNB Group 19.58 (3.9) 81,891.4 (4.9) Masraf Al Rayan 4.08 0.0 26,349.2 3.0 The Commercial Bank 4.74 2.4 13,541.9 0.9 Industries Qatar 9.98 0.8 12,605.0 (2.9) United Development Company 1.26 0.8 11,726.8 (17.1) Source: Bloomberg (* in QR) Regional Indices Close 1D% WTD% MTD% YTD% Exch. Val. Traded ($ mn) Exchange Mkt. Cap. ($ mn) P/E** P/B** Dividend Yield Qatar* 10,097.18 (0.5) (1.1) (3.3) (3.1) 64.73 152,699.4 14.9 1.5 4.2 Dubai 2,742.35 (0.8) (1.0) (1.7) (0.8) 49.38 103,028.7 9.5 1.0 4.3 Abu Dhabi 5,073.38 (0.4) (0.3) (1.6) (0.0) 43.08 143,754.3 15.6 1.4 4.9 Saudi Arabia 7,895.64 (1.0) (2.0) (4.3) (5.9) 983.72 2,271,620.2 21.5 1.7 3.4 Kuwait 6,222.90 0.2 (0.8) (1.6) (0.9) 88.23 116,407.4 15.5 1.4 3.4 Oman 4,105.66 (0.1) (0.6) 0.6 3.1 5.37 17,482.2 7.4 0.8 7.3 Bahrain 1,662.92 0.2 0.4 0.3 3.3 3.04 26,083.9 13.5 1.0 4.7 Source: Bloomberg, Qatar Stock Exchange, Tadawul, Muscat Securities Market and Dubai Financial Market (** TTM; * Value traded ($ mn) do not include special trades, if any, Data as of February 10, 2020) 10,000 10,050 10,100 10,150 9:30 10:00 10:30 11:00 11:30 12:00 12:30 13:00
  • 2. Page 2 of 9 Qatar Market Commentary  The QE Index declined 0.5% to close at 10,097.2. The Transportation and Real Estate indices led the losses. The index fell on the back of selling pressure from GCC and non-Qatari shareholders despite buying support from Qatari shareholders.  QNB Group and Qatar Gas Transport Company Limited were the top losers, falling 3.9% and 3.7%, respectively. Among the top gainers, Qatar General Insurance & Reinsurance Company gained 2.7%, while The Commercial Bank was up 2.4%.  Volume of shares traded on Monday fell by 21.3% to 73.1mn from 92.8mn on Sunday. Further, as compared to the 30-day moving average of 82.0mn, volume for the day was 10.9% lower. Ezdan Holding Group and United Development Company were the most active stocks, contributing 15.0% and 12.7% to the total volume, respectively. Source: Qatar Stock Exchange (* as a % of traded value) Earnings Releases, Global Economic Data and Earnings Calendar Earnings Releases Company Market Currency Revenue (mn) 4Q2019 % Change YoY Operating Profit (mn) 4Q2019 % Change YoY Net Profit (mn) 4Q2019 % Change YoY Abdullah Al Othaim Markets Co. Saudi Arabia SR 2,105.6 8.1% 160.3 5.8% 142.2 33.0% Tihama Advertising and Public Relations Co. Saudi Arabia SR 40.5 4.4% (2.1) N/A (3.5) N/A Fawaz Abdulaziz Alhokair Co. Saudi Arabia SR 1,289.8 4.6% 152.1 78.5% 36.0 40.1% Emirate Integrated Telecommunications Company* Dubai AED 12,588.0 -6.2% 1,721.4 1.8% 1,723.5 -1.8% Orient Insurance* Dubai AED 3,881.1 5.5% – – 413.3 5.1% Dubai Insurance Co.* Dubai AED 970.5 82.5% 68.2 57.7% 75.6 49.8% DAMAC Properties Dubai Co* Dubai AED 4,399.2 -28.3% – – (36.9) N/A Islamic Arab Insurance Company* Dubai AED 1,130.3 6.3% 183.6 20.9% 59.0 12278.8% Orient Unb Takaful* Dubai AED 255.2 34.0% – – 1.1 N/A AXA Green Crescent Insurance* Abu Dhabi AED 46.3 16.4% 8.4 6.6% 0.2 N/A Al Dhafra Insurance Co.* Abu Dhabi AED 323.8 -2.9% 52.3 19.2% 79.4 44.4% Eshraq Properties Co.* Abu Dhabi AED – – – (10.7) N/A Abu Dhabi National Takaful Co.* Abu Dhabi AED 467.3 21.9% 162.3 20.0% 72.7 6.3% Abu Dhabi National Oil Co. For Distribution* Abu Dhabi AED 21,337.0 -6.8% 2,301.1 2.5% 2,217.7 4.3% Bahrain Duty Free Shop Complex* Bahrain BHD 37.6 3.3% 6.4 5.2% 7.5 0.4% Zain Bahrain* Bahrain BHD 62.9 -5.0% 6.3 24.0% 5.3 1.8% Source: Company data, DFM, ADX, MSM, TASI, BHB. (*Financial for FY2019) Global Economic Data Date Market Source Indicator Period Actual Consensus Previous 02/11 UK UK Office for National Statistics Monthly GDP (MoM) Dec 0.3% 0.2% -0.3% 02/11 UK UK Office for National Statistics GDP QoQ 4Q2019 0.0% 0.0% 0.4% 02/11 UK UK Office for National Statistics GDP YoY 4Q2019 1.1% 0.8% 1.1% 02/11 UK UK Office for National Statistics Industrial Production MoM Dec 0.1% 0.3% -1.1% 02/11 UK UK Office for National Statistics Industrial Production YoY Dec -1.8% -0.8% -2.5% 02/11 UK UK Office for National Statistics Manufacturing Production MoM Dec 0.3% 0.5% -1.6% 02/11 UK UK Office for National Statistics Manufacturing Production YoY Dec -2.5% -1.0% -3.3% 02/11 UK UK Office for National Statistics Industrial Production MoM Dec 0.1% 0.3% -1.1% 02/10 China National Bureau of Statistics PPI YoY Jan 0.1% 0.0% -0.5% 02/10 China National Bureau of Statistics CPI YoY Jan 5.4% 4.9% 4.5% Source: Bloomberg (s.a. = seasonally adjusted; n.s.a. = non-seasonally adjusted; w.d.a. = working day adjusted) Overall Activity Buy %* Sell %* Net (QR) Qatari Individuals 16.96% 18.44% (3,524,923.53) Qatari Institutions 25.77% 35.03% (21,950,483.21) Qatari 42.73% 53.47% (25,475,406.74) GCC Individuals 0.91% 1.14% (541,089.33) GCC Institutions 0.46% 11.85% (27,025,226.97) GCC 1.37% 12.99% (27,566,316.30) Non-Qatari Individuals 5.87% 3.99% 4,466,102.97 Non-Qatari Institutions 50.02% 29.55% 48,575,620.07 Non-Qatari 55.89% 33.54% 53,041,723.04
  • 3. Page 3 of 9 Earnings Calendar Tickers Company Name Date of reporting 4Q2019 results No. of days remaining Status QAMC Qatar Aluminum Manufacturing Company 12-Feb-20 0 Due QCFS Qatar Cinema & Film Distribution Company 12-Feb-20 0 Due DOHI Doha Insurance Group 12-Feb-20 0 Due SIIS Salam International Investment Limited 13-Feb-20 1 Due ORDS Ooredoo 13-Feb-20 1 Due QEWS Qatar Electricity & Water Company 16-Feb-20 4 Due DHBK Doha Bank 17-Feb-20 5 Due QGTS Qatar Gas Transport Company Limited (Nakilat) 17-Feb-20 5 Due QGRI Qatar General Insurance & Reinsurance Company 17-Feb-20 5 Due AHCS Aamal Company 18-Feb-20 6 Due MERS Al Meera Consumer Goods Company 19-Feb-20 7 Due GISS Gulf International Services 19-Feb-20 7 Due MPHC Mesaieed Petrochemical Holding Company 20-Feb-20 8 Due QNNS Qatar Navigation (Milaha) 25-Feb-20 13 Due QISI Qatar Islamic Insurance Group 26-Feb-20 14 Due Source: QSE News Qatar  IQCD's net profit declines 55.3% YoY and 6.7% QoQ in 4Q2019, misses our estimate – Industries Qatar's (IQCD) net profit declined 55.3% YoY (-6.7% QoQ) to QR538.1mn in 4Q2019, missing our estimate of QR572.1mn (variation of -5.9%). The company's revenue came in at QR1,378.3mn in 4Q2019, which represents an increase of 11.7% YoY. However, on QoQ basis revenue fell 1.9%. For the year ended 31 December 2019, the Group recorded a net profit of QR2.6bn as compared to QR5.0bn, down 49%, while total revenues declined by 16% to reach QR13.7bn (assuming proportionate consolidation) as compared QR16.3bn for 2018. The Group recorded EPS of QR0.43 for the financial year 2019, as compared to QR0.83 for last year. Financial performance in 2019 was largely impacted by external macroeconomic factors that were not within the Group’s control. These adverse conditions directly translated into declining commodity prices and caused product prices to fall across the Group. Average selling prices declined by 14% YoY, which contributed to a decrease of QR2.0bn in the Group’s net profits for the financial year 2019 as compared to last year. Group sales volumes were also affected by macro imbalances in supply and demand, which were also influenced by lower production due to planned and unplanned maintenance shutdowns. Sales volume for the Group has declined by 2% YoY, which contributed to a decline of QR641mn in the Group’s net profit for the year. The Group’s production volumes as well fell by 1% as compared to last year, amid the shutdowns. These preventive maintenance programs ensure HSE standards, plant life, quality assurance and reliability to maintain long-term operational efficiency targets. Group operating facilities maintain efficiency and the Group’s average reliability factor reached 96% amid a focus on preventive maintenance. In the fourth quarter, Group’s total revenue declined by 2% to reach QR3.5bn compared to the third quarter of 2019, while net profit declined by 7% compared to the third quarter to reach QR539mn, owing to the deteriorating macro-economic conditions which led to a decline of 11% in Group’s average selling prices. The decline in profitability was slightly offset by impairment reversals from an investment in an associated company. The sales volumes remained resilient inthe fourth quarter as compared to the third quarter, with an increase of 10%. The production levels have declined by 3%, due to maintenance shutdowns. The Group’s financial position remained robust, with the liquidity position at the end of the year reaching QR10.7bn in cash and bank balances, after accounting for a QR3.6bn dividend paid for 2018 during the year. IQCD Group’s net cash and bank balance including proportionate share of joint ventures reached QR12.4bn as at December 31, 2019. This is a testament to the Group’s efficient and effective cash-flow generation capabilities, which provide confidence and sustainability in turbulent times. At the end of 2019, the Group was able to settle its entire debt obligation, making the Group debt-free. Group’s total assets and total equity reached QR35.9bn and QR34.2bn, respectively, as of December 31, 2019. After reviewing the year’s financial performance in light of macroeconomic conditions, the Group’s liquidity position, and taking into account future investing and financing needs, the board of directors proposed a total annual dividend distribution for the year ended December 31, 2019 of QR2.4bn, equivalent to a payout of QR0.40 per share and representing a payout ratio of 94%.Operational highlights by segment – Profits in the Petrochemicals segment remained under pressure, with net profit declining by 47% in 2019 compared to year 2018, to reach QR1.3bn. This was mainly due to softening demand for petrochemical products in key markets, excess capacities, new environmental regulations in selected economies and declining prices. In the Fertilizers segment, net profit declined 37% from 2018 to reach QR873mn, largely as the result of an overall decline in selling prices of 9%, amid supply-demand imbalances. This led to a decrease of 9% in the segment revenues compared to the last year. The Steel segment reported revenue of QR5.1bn, a
  • 4. Page 4 of 9 reduction of 12% from the previous year. This reduction was driven mainly by the effect of lower selling prices, which declined by 12%, which was slightly offset by a marginal increase in sales volumes of 1% compared to 2018. (QNB FS Research, Company Press Release)  Ooredoo announces date to pay interest to bondholders – Ooredoo announced that Ooredoo International Finance Limited (OIFL), its wholly-owned subsidiary, pursuant to the Terms and Conditions of the Notes and the Final Terms, will pay its Global Medium Term Note (GMTN) holders’ interest payment on February 18, 2020 and February 21, 2020. (QSE)  UDCD’s world-class 9-hole golf course in Gewan Island to be ready by 2023 – A state-of-the-art 9-hole golf course, being developed in the upcoming Gewan Island, is expected to be completed by 2023. The world-class facility is now being primed to be another popular sports destination in Qatar. The membership-based golf course will also welcome all visitors and members, a top official from United Development Company (UDCD) has stated. UDCD is the master developer of The Pearl- Qatar and Gewan Island. The company has launched in 2019 the construction works for its new master development, the Gewan Island, which features various residential, retail, and entertainment facilities. (Peninsula Qatar)  Mannai Trading Co. and Huawei sign MoU to explore Intelligent Computing and innovation – Mannai Trading Co. has teamed up with Huawei Intelligent Computing (Huawei) to jointly explore intelligent computing and the development of innovative cloud, artificial intelligence (AI), and knowledge-sharing projects. The two companies signed a Memorandum of Understanding (MoU) to initiate their cooperation. Through this cooperation, Mannai Trading Co. and Huawei will build, market, and deliver industry solutions with the combination of their technologies and services for both telecommunications and enterprise IT markets. The collaboration will also see the establishment of joint labs with Mannai Trading Co. and Huawei in Qatar, which will aim to display intelligent computing solutions for government, telecommunications, education, energy, banking, and other industries. (QSE)  QCB: Robust growth in loans help Qatar commercial banks post 12.13% jump in domestic credit – According to Qatar Central Bank (QCB) data, robust growth in loans, especially to trading and services, helped commercial banks in Qatar to witness a 12.13% YoY expansion in domestic credit at the end of December 2019. The trading sector saw a yearly 58.13% surge to QR143.25bn, which accounted for 15% of the total domestic credit during the review period. The commercial banks' credit to the services sector saw 30.05% YoY increase to QR281.75bn, which constituted 29% of the total domestic credit at the end of December 2019. The credit to the general services witnessed a 29.09% yearly increase to QR255.81bn, which accounted for 91% of the total credit to the services sector. In the case of financial services, it registered an impressive 40.37% growth to QR25.94bn at the end of December last year. The real estate sector, which is the third largest credit recipient, however, saw credit intake fall 2.09% to QR194.65bn, or 20% of total domestic credit at the end of December 2019. The consumption sector saw a 7.86% increase in credit intake to QR137.23bn, or 14% of the total domestic credit. Credit to the sovereign stood at QR133.79bn, or 14% of the total domestic credit. It however showed an 11.93% fall YoY in December 2019. Credit to the contracting sector declined 4.09% YoY to QR35.85bn, which stood at 4% of the total domestic credit. The industrial sector received QR25.94bn credit line, which was 3% of the total domestic credit. It, however, fell 5.71% YoY. (Gulf-Times.com)  PwC: Qatar's tax regime is progressively maturing – Qatar's tax regime is progressively maturing with the introduction of new executive regulations, including the recent one relating to withholding tax (WHT), according to PricewaterhouseCoopers (PwC), a global assurance, advisory and tax services company. PwC Qatar tax leader Sajid Khan said with the expected introduction of the new tax administration system 'Dhareeba', there will be a significant focus on how the tax payers manage their compliance, which would require them to look at their internal capabilities to meet these obligations. “We are seeing Qatar’s progression along the tax maturity curve that it started to move forward with issuing these regulations,” he said. Discussions centered on some of the latest changes, including amongst other key changes are those to the new executive regulations to the Law No 24 of 2018 issued on December 11, 2019, which are expected to transform the tax landscape in Qatar. Khan said the new executive regulations have brought significant changes to a number of areas of tax law including the scope of WHT, reporting and compliance obligations, changes in terms of some of the entities that are established in Qatar subsidiaries and joint ventures of listed companies as well as how to establish the Qatari nationals ownership. (Gulf- Times.com)  Al-Kaabi: Qatar thrust to LNG development helps global shift to less carbon-intensive energy – HE the Minister of State for Energy Affairs Saad Sherida Al-Kaabi said natural gas will be the only form of hydrocarbons to increase its share during the next 30 years while fossil fuels will continue to dominate the global energy mix during the period. “Today, the share of natural gas in the global energy mix stands at about 22%. By 2050, this is expected to rise to 27%, according to the outlook, which is being launched today,” Al-Kaabi said during the launch of ‘GECF Global Gas Outlook 2050’. He said natural gas has a key role to play in addressing the global concerns on environmental pollution and climate change. “It is versatile, flexible, economic and clean. More and more countries are moving away from burning coal and nuclear and are building infrastructure for cleaner alternatives including natural gas. I am often asked about renewables and whether we see them as a threat to gas. The answer is 'no'. We believe that natural gas and renewables are complementary. As the cleanest fossil fuel, natural gas comes in handy when the sun is not shining. And when the wind is not blowing.” He added, “We in Qatar are moving forward with implementing our mega projects that will see our LNG production rise from 77mn tons per year to 126mn tons per year by 2027. This will not only enhance our ability and flexibility to meet additional demand but also help the shift to less carbon- intensive energy in many parts of the world. In parallel, Qatar remains focused on achieving the highest environmental standards in its LNG industry to significantly reduce emissions by applying the best available industry technology and CO2 sequestration.” (Gulf-Times.com)
  • 5. Page 5 of 9  Qatar among leading long-term LNG export growth drivers – Qatar and four other producing countries will lead the growth in liquefied natural gas (LNG) export capacity over the next three decades during which $9.7tn has been earmarked for investment in the gas sector. Besides Qatar, the US, Australia, Russia and Mozambique are projected to lead the growth in export capacity. With more than 120mn tons per year of liquefaction capacity under construction and another 260mn tpy planned, the share of LNG exports will rise from the current 37.2% to 45.2% of total exports by 2030, and to 50.3% by 2050. Gas production in Gas Exporting Countries Forum (GECF) countries will grow by almost 50% by 2050 to over 2.5tcm, underlining the continued importance of the group, according to the "Global Gas Outlook 2050" released in Doha. Growth in LNG trade is the main driving force and will exceed total pipeline trade by 2050, whereas in 2018 it was only just over half pipeline trade, the outlook said. The LNG sector is expected to grow at 2.9% to 1,077bcm by 2050, while pipeline trade will expand more slowly at a rate of 1.2% per year to reach 1,063bcm by 2050. (Gulf-Times.com)  Three more stadiums to be launched this year – Supreme Committee for Delivery and Legacy’s (SC) General Secretary, Hassan Al-Thawadi revealed that the infrastructure development for the 2022 FIFA World Cup is at an advanced stage with many of the works to be completed by this year. “Three more stadiums will be completed this year, all the major expressways are to be completed by the end of this year and Doha Metro- already functional - will be fully operational this year,” he stated. (Gulf-Times.com)  Shura Council approves draft law on medical treatment abroad for Qataris – The Shura Council held its regular weekly meeting under the chairmanship of HE the Speaker Ahmed bin Abdullah bin Zaid Al-Mahmoud. The Council discussed the Services and Public Utilities Committee's report on a draft law on organizing medical treatment abroad for Qatari citizens. Under the draft law's provisions, the state will bear the cost of such medical treatment and other related expenses. (Gulf-Times.com) International  US household debt tops $14tn and reaches new record – American households added $193bn of debt in the fourth quarter, driven by a surge in mortgage loans, and overall debt levels rose to a new record at $14.15tn, the Federal Reserve Bank of New York said. Mortgage balances rose by $120bn in the fourth quarter to $9.56tn, the New York Fed said in its quarterly report on household debt. Mortgage originations - pushed up by an increase in refinancing - also rose to $752bn in the fourth quarter, reaching the highest volume since the fourth quarter of 2005, the report found. Non-housing debt, including auto loans, credit cards and student loans, rose by $79bn. (Reuters)  US job openings hit two-year low, point to slowdown in job growth – The US job openings dropped for a second straight month in December to hit their lowest level in two years, while hiring increased marginally, suggesting a recent acceleration in job growth was unlikely to be sustained. The report from the Labor Department on Tuesday also showed a pick-up in layoffs at the end of the year. Though job openings remain relatively high, economists said the sharp declines at the end of 2019 were potentially warning signals for the longest economic expansion on record, now in its 11th year. Job openings, a measure of labor demand, decreased 364,000 to 6.4mn, the lowest reading since December 2017, the Labor Department said in its monthly Job Openings and Labor Turnover Survey (JOLTS). The second straight monthly decline in job openings followed a 574,000 plunge in November, which was the biggest drop since August 2015. Vacancies dropped by 14.9% in 2019. They peaked at 7.6mn in November 2018. Some economists said while the steep decline in job openings from the peak was concerning, they noted that vacancies continued to outpace the number of unemployed Americans, which was 5.9mn in January. (Reuters)  Trump's $4.8tn budget gets chilly reception from Congress – The White House presented the budget as a blueprint for the president’s policy priorities. It includes funding to build a wall on the US border with Mexico and fight the opioid crisis, but cuts billions of dollars from safety net programs under the banner of welfare reform. The budget is largely a political document that serves as a starting point for negotiations with Congress. With an eye toward reducing debt and deficits, Trump once again proposed steep cuts to housing, environmental, transportation and other programs that have been rejected by lawmakers in past years. Democrats said Trump’s proposal upended his promise in last week’s State of the Union speech to always protect the popular Social Security pension plan and the Medicare health plan for seniors. Trump’s budget would reduce Medicare spending by lowering drug costs and tightening eligibility requirements for Social Security’s disability program. It also would enact new work requirements for people who get food stamps or use the Medicaid health plan for the poor. Last year Trump signed a two-year budget deal with Congress that increased federal spending on defense and several other domestic programs, adding to a growing government debt. Trump’s proposed budget for fiscal 2021 includes $2bn to fund further construction on the border wall with Mexico, a project that is especially popular with his political base, and funding for an infrastructure bill that is unlikely to be passed by Democrats and Republicans in Congress. It forecasts $4.6tn in deficit reduction over 10 years and assumes economic growth at an annual rate of roughly 3% for years to come. The Congressional Budget Office predicts the US economy will grow 2.2% in the current fiscal year, which ends September 30, and grow less than 2.0% in future years. The economy grew 2.3% in calendar year 2019. (Reuters)  UK economy flat-lined in fourth quarter before post-election bounce – Britain’s economy flat-lined in the final three months of 2019, when the country was in a deadlock over Brexit thatwas only broken by Prime Minister Boris Johnson’s December election victory, leading to some signs of a recovery early this year. Official figures released showed zero growth in the fourth quarter compared with the third, matching the median forecast in a Reuters poll of economists. In annual terms, growth was 1.1%, stronger than the poll forecast of 0.8% after upward revisions to growth in some previous quarters. However, the last time annual growth was weaker for a calendar quarter was in mid-2012. The data also showed quarterly growth in household spending - which has helped drive Britain’s economy for most of the period since the 2016 Brexit referendum - was the slowest in four years, rising by just 0.1%. Business investment dropped 1.0% over the same period, the biggest fall since late 2016. There have been previous signs that consumers reined in their
  • 6. Page 6 of 9 spending in late 2019, and industry figures published earlier on Tuesday suggested only a modest increase in January. (Reuters)  BRC: UK shoppers still wary about spending in January – Britons kept a tight grip on their spending last month last month, a survey showed, suggesting that shoppers have not felt the jump in confidence reported by many companies since December’s election broke the Brexit logjam. Total retail spending edged up by an annual 0.4% in January, the British Retail Consortium (BRC) said. The average increase over the past 12 months was just 0.2%, the lowest since BRC’s records began in 1995, while like-for-like retail sales in January, excluding changes in floor space from one year to the next, were flat. A separate survey by Barclaycard, which covers a broader range spending, was more upbeat, showing an annual 3.9% jump in spending by consumers in January, boosted by spending on fuel and at supermarkets. (Reuters)  Sentix: Eurozone’s investor morale falls in February on corona- virus fears – Investor morale inthe Eurozone fell for the first time in four months in February over fears that China will not be able to contain the corona-virus outbreak, a survey showed on Monday. Sentix’s index for the Eurozone fell to 5.2 from 7.6 in January. The Reuters consensus forecast was for a fall to 4.1. The slight drop reflects the fact that investors think the economic damage from the novel virus has been mostly limited to China, said Sentix chief Manfred Huebner, adding that the global economy was getting impetus from the US. (Reuters)  China 2019 fiscal spending up 8.1%, faster than economic growth – China’s fiscal spending climbed 8.1% in 2019 from the previous year, the finance ministry said on Monday, outpacing economic growth as policymakers sought to ward off a sharper slowdown. Fiscal revenues increased an annual 3.8% last year, dragged by a 1.0% rise in tax receipts due to huge tax cuts, the finance ministry said a statement. Fiscal expenditures were 23.89tn Yuan in 2019, while revenues were 19.04tn Yuan, the ministry said. Tax and fee cuts exceeded 2.3tn Yuan ($329.5bn) in 2019, the ministry said, adding that it would continue to implement tax and fee reductions this year. The ministry said it would closely watch changes in tax burdens on firms in various sectors, especially in light of the impact from the corona-virus outbreak. Non-tax revenues, including incomes from state- owned firms, fines and confiscations, jumped 20.2%, the ministry said. The finance ministry has allocated the 2020 local government special bond quota worth 1.29tn Yuan, including one trillion Yuan front-loaded in November, it said. Local governments have completed 55.4% of the bond quota, the ministry said. China’s economy grew 6.1% in 2019, the weakest pace in nearly three decades. (Reuters)  IMF: China can top up stimulus but must focus on reform – China has room to take fiscal stimulus measures if its economy slows further but should not lose sight of structural reforms and steps to address rapid credit growth, a senior International Monetary Fund (IMF) official said. Changyong Rhee, director of the IMF’s Asia and Pacific Department, said while it was too early to assess the impact of the coronavirus outbreak on Asian economies, it added to risks to the region’s growth outlook. (Reuters) Regional  UAE, Saudi Arabia, Qatar among top 10 logistics markets in Agility's Index – The UAE, Saudi Arabia and Qatar are among the top 10 logistics markets in the 2020 Agility Emerging Markets Logistics Index. China and India lead the list, at first and second place, respectively. The Arabian Gulf countries outperformed most other emerging market regions in the 11th annual Agility Index which was put together by the Kuwait-headquartered logistics firm Agility in partnership with the British research company Transport Intelligence. The index is a broad gauge of competitiveness based on logistics strength and business fundamentals, said a statement from the company. In the GCC, the UAE (3), Saudi Arabia (6), Qatar (7), Oman (14), Bahrain (15) and Kuwait (19) were ranked highly in the index. For the first time since its launch in 2008, the UAE featured in the top 10 list of all three individual sub-indices of the Index – domestic logistics, business fundamentals and international logistics. The jump in the rankings is the result of the country’s continuedopen financial sector, transparent regulatory system and corruption protection frameworks and its progress towards a comprehensive national SME development strategy, according to Agility. (Zawya)  S&P: Three factors could hit GCC insurers in 2020 – Intensifying competition, increasing asset risk, and more onerous and costly regulations are among the key risks that could affect GCC insurers' earnings and credit conditions in 2020, S&P Global Ratings (S&P) stated in a new report. “Despite these challenges, our ratings are still supported by insurers' robust capital positions,” said S&P’s credit analyst, Emir Mujkic, commenting on the "Competition, Asset Risk, And Regulation: The Three Factors That Could Hit GCC Insurers In 2020," report published on RatingsDirect. “We anticipate that pressure on some rated entities will gradually ease, since a number of companies have strengthened their internal controls and governance arrangements, or de-risked their asset portfolios following years of weakening capital and liquidity buffers. However, we expect that a number of smaller, unprofitable, and/or undercapitalized insurers will struggle to meet increasing regulatory demands," he added. “It is likely that some will have to raise new capital, consolidate through mergers, or even exit the market entirely. This could particularly be the case in Saudi Arabia and Kuwait, where new regulations including higher capital requirements are likely to be adopted in the near future," Mujkic concluded. (Zawya)  Saudi Arabia's PIF plans to have 1,000 employees by end of year – Saudi Arabia’s sovereign wealth fund Public Investment Fund (PIF) plans to have over 1,000 employees by the end of this year from 700 currently, Head of Corporate Finance, Alireza Zaimi said. He was speaking at a conference in Abu Dhabi. PIF is Saudi Crown Prince Mohammed bin Salman’s vehicle to boost Saudi investments at home and abroad, as he seeks to diversify the oil- heavy economy. (Reuters)  RJHI posts 169.6% YoY rise in net profit to SR10,159mn in FY2019 – Al Rajhi Bank (RJHI) recorded net profit of SR10,159mn in FY2019, an increase of 169.6% YoY. Total operating profit rose 12.5% YoY to SR19,484mn in FY2019. Total revenue for special commissions/investments rose 13.1% YoY to SR16,963mn in FY2019. Total assets stood at SR384.1bn at the end of December 31, 2019 as compared to SR364.0bn at the end of December 31, 2018. Loans and advances stood at SR249.7bn (+7.7% YoY), while customer deposits stood at SR312.4bn (+6.3% YoY) at the
  • 7. Page 7 of 9 end of December 31, 2019. EPS came in at SR4.06 in FY2019 as compared to SR1.51 in FY2018. (Tadawul)  Riyad Bank hires banks for Dollar Sukuk issue – Saudi Arabia’s Riyad Bank has hired international and regional banks to arrange the potential issuance of dollar-denominated Sukuk, the bank stated. The country’s fourth-largest bank has hired JPMorgan, Riyad Capital, Standard Chartered, First Abu Dhabi Bank and HSBC to lead the deal. The tier 2 Sukuk sales would be the first debt issuance under the bank’s program to issue primary and secondary bonds. The program’s maximum value is $3bn. (Reuters)  Saudi Arabia’s ACWA Power sees IPO sooner rather than later – Saudi Arabia’s ACWA Power International is committed to a plan to sell shares and sees an initial public offering sooner than later, the company’s CEO, Paddy Padmanathan said. The record share sale by Saudi oil giant Saudi Aramco last year created a better opportunity for ACWA Power to list stocks since it drove attention to the nation’s market, he said. Saudi Arabia’s Public Investment Fund (PIF) is set to increase its holding in ACWA Power to 45% by the end of the quarter, he added. The power company aims to expand its global presence to 16 countries this year from 12 now as it opens in nations like Ethiopia, Uzbekistan and Kazakhstan, he said. Padmanathan did not give a specific time for the planned IPO. (Bloomberg)  Dubai January PMI at 50.6 as compared to 52.3 in December – Dubai's non-oil private sector economy saw a further weakening of sales growth in January, which slowed to a near four-year low, prompting a much softer expansion in output and falling job numbers. Business expectations deteriorated further, while output charges were again lowered amid efforts to reinvigorate new orders. The headline IHS Markit Dubai Purchasing Managers' Index (PMI) is derived from individual diffusion indices which measure changes in output, new orders, employment, suppliers’ delivery times and stocks of purchased goods. The survey covers the Dubai non-oil private sector economy, with additional sector data published for travel & tourism, wholesale & retail and construction. The seasonally adjusted IHS Markit Dubai Purchasing Managers' Index (PMI) fell from 52.3 in December to 50.6 in January, signaling the weakest improvement in the health of the non-oil private sector since February 2016. Growth primarily eased due to a weaker expansion in business activity and subsequent drop in job numbers. At the sub-sector level, there was a modest improvement in the travel & tourism industry. However, deteriorations in the construction and wholesale & retail sectors placed downward pressure on the headline index. Output in the Dubai non-oil economy expanded only modestly at the start of the year. The rate of growth slowed to the weakest in the current 47-month sequence. According to surveyed firms, activity was subdued by soft new business volumes. New orders followed a similar trend to output, with latest data indicating the weakest increase in demand for nearly four years. According to panelists, this was mainly due to slow market conditions. Weaker demand growth impacted hiring activity in January, with employment falling for the first time since last August. Staff numbers were reportedly lowered in order to streamline costs. The rate of job losses was marginal but nevertheless the joint strongest in the ten-year series history. Meanwhile, average prices set by non-oil private sector firms declined further at the start of 2020, as has been the case in each month since May 2018. However, the drop in prices was the softest for four months. Despite some companies raising salaries, the overall increase in cost burdens was marginal in January. In particular, firms noted little pressure on purchase prices due to soft market demand. Input stocks continued to increase during the month, extending the current run of growth that began in November 2018. However, the pace of expansion was the softest for four months. Meanwhile, firms registered a second successive month of improving delivery times, albeit one that was only modest. Lastly, business expectations slipped in January on the back of softer activity growth. That said, firms generally regarded the coming 12 months with optimism, citing hopes of market stabilization and new projects in the year ahead. (Markit)  Dubai's oversupplied property sector to add more new homes in 2020 – Dubai is expected to this year see the biggest number of new homes completed in more than a decade, adding to pressure on a once-booming but now struggling property sector already weakened by excess supply. The Middle East financial hub, where the private sector shrank in January for the first time since 2009, has faced a slowing real estate market for most of the past decade. A total of 62,500 residential units are scheduled to be completed this year, Knight Frank said, adding that would be the biggest number of new units since 2008 even though not all were ultimately expected to be finished. “In the short to medium term this influx of supply will continue to put pressure on prices and rents,” Knight Frank said in a report. There were 70,885 new housing units delivered in 2008, just before Dubai was hit by a credit crisis sparked by a collapse in its booming real estate sector - a key contributor to state revenue in a country which does not have the oil wealth of its Gulf neighbors. Residential sales prices fell an average of 6% in 2019, as an estimated 35,171 new units were delivered, compared to a 8.6% drop in 2018, Knight Frank said. Apartment prices on average fell by 8.2% last year while prices of traditional style houses, known as ‘villas’, fell 7.3%. Rents dropped 8.1%. Housing prices are down at least a quarter since 2014, driven by oversupply. Dubai has tried to stem the downturn by creating a commission in September to regulate the sector though it is not clear what action has been taken. (Reuters)  Abu Dhabi fund Mubadala sees commodities ‘fizzle’ due to virus – Commodities markets aresetto fizzle as the coronavirus crimps business worldwide, according to a top executive at Abu Dhabi’s government-run fund Mubadala Investment Co. Falling commodity prices are a risk for emerging economies that rely on the production of raw materials, and investors in these markets should “be a little bit cautious,” Mubadala Deputy Chief Executive Officer, Waleed Al Mokarrab Al Muhairi said. The uncertain outlook for the coronavirus makes it harder for investors to decide where to put their money, he said. The disease is hurting economic expansion as airlines cancel flights and factories look elsewhere for components they would have bought from China, where the coronavirus originated. Growth in demand for oil was already fragile amid a supply glut, and benchmark Brent crude has tumbled 18% this year. “Commodities are going to be impacted. You see that in aluminum, you see that in iron ore, you see that in oil,” he said. Manufacturers are already shifting some operations and supply
  • 8. Page 8 of 9 chains away from China, he said. Middle Eastern oil-producers need to continue efforts to diversify their economies and prepare for a future when sales of crude generate less income, Al Muhairi said. (Bloomberg)  Fitch places TAQA on rating watch ‘Positive’ – Fitch Ratings has placed Abu Dhabi National Energy Company (TAQA) long-term issuer default rating (IDR) and senior unsecured debt rating of 'A' on rating watch ‘Positive’ (RWP). The RWP follows the announcement by Abu Dhabi Power Corporation (ADPower) of an offer to the board of TAQA to transfer its water and electricity assets in exchanges for shares. The ADPower offer sets out an assets transfer valued at about AED120bn at end-2018. In exchange, TAQA would issue ADPower a convertible instrument, convertible into 106,367,950,000 ordinary shares in TAQA upon closing of the transaction. The RWP reflects Fitch's belief that TAQA's rating could benefit from increased indirect government shareholding, and strengthening of the links under Fitch's Government-Related Entities Rating (GRE) criteria between TAQA and Abu Dhabi (AA/Stable). The RWP also reflects the transfer of regulated transmission and distribution assets, resulting in a possible improvement in TAQA's Standalone Credit Profile. However, we have yet to understand and assess TAQA's financial policy after the transaction and expect to resolve the RWP once it closes, which may be in 2H2020. (Bloomberg)  NBQ posts 3.8% YoY rise in net profit to AED424.4mn in FY2019 – National Bank of Umm Al-Qaiwain (NBQ) recorded net profit of AED424.4mn in FY2019, an increase of 3.8% YoY. Total revenues rose 0.8% YoY to AED750.9mn in FY2019. Net operating profit fell 1.9% YoY to AED501.7mn in FY2019. Total assets stood at AED14.3bn at the end of December 31, 2019 as compared to AED14.7bn at the end of December 31, 2018. EPS came in at AED0.23 in FY2019 as compared to AED0.22 in FY2018. (ADX)  Kuwait’s foreign reserves at KD12.09bn by end of 2019 – Kuwait’s foreign reserves increased by 7.2% YoY in December 2019 to KD12.09bn, compared with KD11.28bn in December 2018, according to official data by the Central Bank of Kuwait (CBK). On a monthly basis, reserves went down by 1.27% in December, compared with KD12.25bn last November. Data shows that reserves do not include foreign assets of the Kuwait Investment Authority (KIA). By the end of last year, Kuwait's currency deposits registered KD11.33bn, while special drawing right (SDR) amounted to KD563.9mn and reserves at the International Monetary Fund (IMF) reached KD165.7mn. Meanwhile, gold reserves totaled KD31.7mn. (Zawya)  Boubyan Bank starts marketing five-year Dollar Sukuk – Kuwait’s Boubyan Bank has started marketing five-year US Dollar-denominated Sukuk, or Islamic bonds, at around 150 basis points (bps) over mid-swaps, a document showed. HSBC and Standard Chartered were hired as joint global coordinators for the deal. Bank ABC, Boubyan Capital, First Abu Dhabi Bank, Islamic Corporation for the Development of the Private Sector, KFH Capital, Kuwait International Bank and Warba Bank are also involved in arranging the deal. Boubyan Bank met fixed income investors in Dubai and London ahead of the potential benchmark debt sale, which is expected to close later on Tuesday. Benchmark bonds are generally meant to be upwards of $500mn. (Reuters)  Bahrain Bourse issues resolution to list T-Bills and Sukuk – Bahrain Bourse (BHB) issued Resolution No (4) for the year 2020 to list Treasury Bills (T-Bill) and short-term Islamic lease (Ijarah) Sukuk that are issued by the Central Bank of Bahrain on behalf of the Government of Bahrain for the year 2020 at Bahrain Bourse on the issuance date. According to the resolution, 58 Treasury Bills and 10 short-term Islamic lease Sukuk issues will be listed during the year 2020 unless stated otherwise. The total value of the T-Bill issues is BHD4.01bn, while the total value of the short-term Islamic lease Sukuk issues is BHD260mn. (Zawya)  Bahrain sells BHD70mn 91-day bills; bid-cover at 1.83x – Bahrain sold BHD70mn of 91 day bills due on May 13, 2020. Investors offered to buy 1.83 times the amount of securities sold. The bills were sold at a price of 99.373, having a yield of 2.5% and will settle on February 12, 2020. (Bloomberg)
  • 9. Contacts Saugata Sarkar, CFA, CAIA Shahan Keushgerian Zaid al-Nafoosi, CMT, CFTe Head of Research Senior Research Analyst Senior Research Analyst Tel: (+974) 4476 6534 Tel: (+974) 4476 6509 Tel: (+974) 4476 6535 saugata.sarkar@qnbfs.com.qa shahan.keushgerian@qnbfs.com.qa zaid.alnafoosi@qnbfs.com.qa Mehmet Aksoy, PhD QNB Financial Services Co. W.L.L. Senior Research Analyst Contact Center: (+974) 4476 6666 Tel: (+974) 4476 6589 PO Box 24025 mehmet.aksoy@qnbfs.com.qa Doha, Qatar Disclaimer and Copyright Notice: This publication has been prepared by QNB Financial Services Co. W.L.L. (“QNB FS”) a wholly-owned subsidiary of Qatar National Bank (Q.P.S.C.). QNB FS is regulated by the Qatar Financial Markets Authority and the Qatar Exchange. Qatar National Bank (Q.P.S.C.) is regulated by the Qatar Central Bank. This publication expresses the views and opinions of QNB FS at a given time only. It is not an offer, promotion or recommendation to buy or sell securities or other investments, nor is it intended to constitute legal, tax, accounting, or financial advice. QNB FS accepts no liability whatsoever for any direct or indirect losses arising from use of this report. Any investment decision should depend on the individual circumstances of the investor and be based on specifically engaged investment advice. We therefore strongly advise potential investors to seek independent professional advice before making any investment decision. Although the information in this report has been obtained from sources that QNB FS believes to be reliable, we have not independently verified such information and it may not be accurate or complete. QNB FS does not make any representations or warranties as to the accuracy and completeness of the information it may contain, and declines any liability in that respect. For reports dealing with Technical Analysis, expressed opinions and/or recommendations may be different or contrary to the opinions/recommendations of QNB FS Fundamental Research as a result of depending solely on the historical technical data (price and volume). QNB FS reserves the right to amend the views and opinions expressed in this publication at any time. It may also express viewpoints or make investment decisions that differ significantly from, or even contradict, the views and opinions included in this report. This report may not be reproduced in whole or in part without permission from QNB FS. COPYRIGHT: No part of this document may be reproduced without the explicit written permission of QNB FS. Page 9 of 9 Rebased Performance Daily Index Performance Source: Bloomberg Source: Bloomberg (*Data as of February 10, 2020) Source: Bloomberg Source: Bloomberg (*$ adjusted returns, # Market was closed on February 11, 2020) 60.0 80.0 100.0 120.0 140.0 Jan-16 Jan-17 Jan-18 Jan-19 Jan-20 QSEIndex S&PPanArab S&PGCC (1.0%) (0.5%) 0.2% 0.2% (0.1%) (0.4%) (0.8%) (1.5%) (1.0%) (0.5%) 0.0% 0.5% SaudiArabia Qatar* Kuwait Bahrain Oman AbuDhabi Dubai Asset/Currency Performance Close ($) 1D% WTD% YTD% Global Indices Performance Close 1D%* WTD%* YTD%* Gold/Ounce 1,567.89 (0.3) (0.2) 3.3 MSCI World Index 2,421.26 0.3 0.7 2.7 Silver/Ounce 17.65 (0.7) (0.3) (1.1) DJ Industrial 29,276.34 (0.0) 0.6 2.6 Crude Oil (Brent)/Barrel (FM Future) 54.01 1.4 (0.8) (18.2) S&P 500 3,357.75 0.2 0.9 3.9 Crude Oil (WTI)/Barrel (FM Future) 49.94 0.7 (0.8) (18.2) NASDAQ 100 9,638.94 0.1 1.2 7.4 Natural Gas (Henry Hub)/MMBtu 1.82 (1.6) (3.2) (12.9) STOXX 600 428.48 1.0 0.8 0.2 LPG Propane (Arab Gulf)/Ton 37.25 0.0 (3.2) (9.7) DAX 13,627.84 1.1 0.7 0.2 LPG Butane (Arab Gulf)/Ton 51.00 0.0 1.0 (23.2) FTSE 100 7,499.44 1.0 0.8 (2.9) Euro 1.09 0.0 (0.3) (2.6) CAC 40 6,054.76 0.8 0.2 (1.5) Yen 109.79 0.0 0.0 1.1 Nikkei# 23,685.98 0.0 (0.5) (0.6) GBP 1.30 0.3 0.5 (2.3) MSCI EM 1,099.41 1.1 0.7 (1.4) CHF 1.02 0.2 0.2 (0.8) SHANGHAI SE Composite 2,901.67 0.7 1.4 (4.9) AUD 0.67 0.4 0.6 (4.4) HANG SENG 27,583.88 1.3 0.6 (1.9) USD Index 98.72 (0.1) 0.0 2.4 BSE SENSEX 41,216.14 0.6 0.5 (0.2) RUB 63.38 (1.2) (1.2) 2.2 Bovespa 115,370.60 2.2 0.9 (7.6) BRL 0.23 (0.1) (0.2) (7.2) RTS 1,539.56 2.4 1.4 (0.6) 119.9 114.9 96.8