QNBFS Daily Market Report February 9, 2017
•
0 likes•114 views

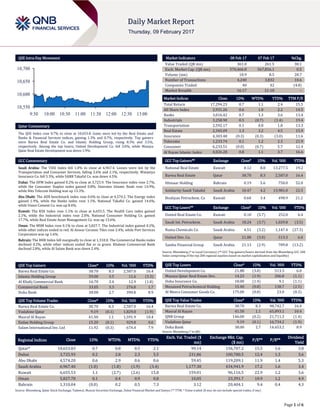
The QSE Index rose 0.7% to close at 10,653.8.

Recommended
Recommended
More Related Content
What's hot
What's hot (19)
Viewers also liked
Viewers also liked (20)
Similar to QNBFS Daily Market Report February 9, 2017
Similar to QNBFS Daily Market Report February 9, 2017 (20)
More from QNB Group
More from QNB Group (20)
Recently uploaded
Recently uploaded (20)
QNBFS Daily Market Report February 9, 2017
- 1. Page 1 of 6 QSE Intra-Day Movement Qatar Commentary The QSE Index rose 0.7% to close at 10,653.8. Gains were led by the Real Estate and Banks & Financial Services indices, gaining 1.3% and 0.7%, respectively. Top gainers were Barwa Real Estate Co. and Islamic Holding Group, rising 8.3% and 3.5%, respectively. Among the top losers, United Development Co. fell 3.0%, while Mazaya Qatar Real Estate Development was down 1.9%. GCC Commentary Saudi Arabia: The TASI Index fell 1.0% to close at 6,967.4. Losses were led by the Transportation and Consumer Services, falling 2.6% and 2.1%, respectively. Wataniya Insurance Co. fell 5.3%, while SABB Takaful Co. was down 4.5%. Dubai: The DFM Index gained 0.2% to close at 3,725.9. The Insurance index rose 2.7%, while the Consumer Staples index gained 0.8%. Emirates Islamic Bank rose 14.9%, while Hits Telecom Holding was up 13.3%. Abu Dhabi: The ADX benchmark index rose 0.6% to close at 4,574.2. The Energy index gained 1.9%, while the Banks index rose 1.1%. National Takaful Co. gained 14.6%, while Union Cement Co. was up 8.4%. Kuwait: The KSE Index rose 1.1% to close at 6,655.5. The Health Care index gained 2.1%, while the Industrial index rose 2.0%. National Consumer Holding Co. gained 17.7%, while Real Estate Asset Management Co. was up 13.6%. Oman: The MSM Index rose 0.1% to close at 5,827.7. The Industrial index gained 0.2%, while other indices ended in red. Al Anwar Ceramic Tiles rose 2.4%, while Port Services Corporation was up 1.6%. Bahrain: The BHB Index fell marginally to close at 1,310.0. The Commercial Banks index declined 0.2%, while other indices ended flat or in green. Khaleeji Commercial Bank declined 2.8%, while Al Salam Bank was down 2.4%. QSE Top Gainers Close* 1D% Vol. ‘000 YTD% Barwa Real Estate Co. 38.70 8.3 2,587.0 16.4 Islamic Holding Group 59.00 3.5 11.6 (3.3) Al Khalij Commercial Bank 16.70 3.4 12.9 (1.8) Commercial Bank 33.05 3.3 276.8 1.7 Doha Bank 38.00 2.7 390.8 8.9 QSE Top Volume Trades Close* 1D% Vol. ‘000 YTD% Barwa Real Estate Co. 38.70 8.3 2,587.0 16.4 Vodafone Qatar 9.19 (0.1) 1,829.8 (1.9) Masraf Al Rayan 41.50 1.1 1,591.9 10.4 Ezdan Holding Group 15.20 (0.1) 929.8 0.6 Salam International Inv. Ltd 11.92 (0.3) 674.4 7.9 Market Indicators 08 Feb 17 07 Feb 17 %Chg. Value Traded (QR mn) 361.0 261.5 38.1 Exch. Market Cap. (QR mn) 570,466.8 567,856.1 0.5 Volume (mn) 10.9 8.5 28.7 Number of Transactions 4,240 3,832 10.6 Companies Traded 40 42 (4.8) Market Breadth 16:17 21:18 – Market Indices Close 1D% WTD% YTD% TTM P/E Total Return 17,294.23 0.7 1.1 2.4 15.5 All Share Index 2,931.26 0.6 1.0 2.2 14.5 Banks 3,016.42 0.7 1.3 3.6 13.4 Industrials 3,258.90 0.5 (0.7) (1.4) 19.4 Transportation 2,592.17 0.1 0.8 1.8 13.3 Real Estate 2,345.09 1.3 3.2 4.5 15.9 Insurance 4,303.48 (0.3) (0.3) (3.0) 11.6 Telecoms 1,233.74 0.1 1.2 2.3 21.9 Consumer 6,233.51 (0.0) (0.7) 5.7 12.4 Al Rayan Islamic Index 4,026.28 0.8 1.1 3.7 16.6 GCC Top Gainers## Exchange Close# 1D% Vol. ‘000 YTD% National Real Estate Kuwait 0.12 8.8 13,277.5 19.2 Barwa Real Estate Qatar 38.70 8.3 2,587.0 16.4 Ithmaar Holding Bahrain 0.19 5.6 750.0 52.0 Solidarity Saudi Takaful Saudi Arabia 10.47 4.2 13,981.0 22.5 Boubyan Petrochem. Co Kuwait 0.60 3.4 498.9 21.2 GCC Top Losers## Exchange Close# 1D% Vol. ‘000 YTD% United Real Estate Co. Kuwait 0.10 (5.7) 252.0 6.4 Saudi Int. Petrochem. Saudi Arabia 18.24 (3.7) 1,029.8 (3.5) Nama Chemicals Co. Saudi Arabia 4.51 (3.2) 1,147.4 (27.3) United Dev. Co. Qatar 21.88 (3.0) 513.3 6.0 Samba Financial Group Saudi Arabia 21.13 (2.9) 789.8 (13.2) Source: Bloomberg (# in Local Currency) (## GCC Top gainers/losers derived from the Bloomberg GCC 200 Index comprising of the top 200 regional equities based on market capitalization and liquidity) QSE Top Losers Close* 1D% Vol. ‘000 YTD% United Development Co. 21.88 (3.0) 513.3 6.0 Mazaya Qatar Real Estate Dev. 14.23 (1.9) 206.8 (1.1) Doha Insurance Co. 18.00 (1.4) 9.1 (1.1) Mesaieed Petrochemical Holding 15.40 (0.8) 138.7 (2.5) Al Meera Consumer Goods Co. 175.00 (0.8) 23.0 (0.3) QSE Top Value Trades Close* 1D% Val. ‘000 YTD% Barwa Real Estate Co. 38.70 8.3 98,742.7 16.4 Masraf Al Rayan 41.50 1.1 65,893.1 10.4 QNB Group 146.00 (0.2) 21,711.3 (1.4) Vodafone Qatar 9.19 (0.1) 16,734.2 (1.9) Doha Bank 38.00 2.7 14,653.2 8.9 Source: Bloomberg (* in QR) Regional Indices Close 1D% WTD% MTD% YTD% Exch. Val. Traded ($ mn) Exchange Mkt. Cap. ($ mn) P/E** P/B** Dividend Yield Qatar* 10,653.83 0.7 0.8 0.5 2.1 99.14 156,707.2 15.5 1.6 3.8 Dubai 3,725.93 0.2 2.8 2.3 5.5 231.86 100,780.5 12.4 1.3 3.6 Abu Dhabi 4,574.20 0.6 2.9 0.6 0.6 59.45 119,209.1 11.9 1.4 5.3 Saudi Arabia 6,967.40 (1.0) (1.8) (1.9) (3.4) 1,177.30 434,941.9 17.2 1.6 3.4 Kuwait 6,655.53 1.1 (2.7) (2.6) 15.8 159.01 96,116.5 22.9 1.2 3.6 Oman 5,827.70 0.1 0.4 0.9 0.8 10.05 23,391.7 10.9 1.2 4.9 Bahrain 1,310.04 (0.0) 0.2 0.5 7.3 3.12 20,404.1 9.4 0.4 4.3 Source: Bloomberg, Qatar Stock Exchange, Tadawul, Muscat Securities Exchange, Dubai Financial Market and Zawya (** TTM; * Value traded ($ mn) do not include special trades, if any) 10,550 10,600 10,650 10,700 9:30 10:00 10:30 11:00 11:30 12:00 12:30 13:00
- 2. Page 2 of 6 Qatar Market Commentary The QSE Index rose 0.7% to close at 10,653.8. The Real Estate and Banks & Financial Services indices led the gains. The index rose on the back of buying support from non-Qatari shareholders despite selling pressure from Qatari and GCC shareholders. Barwa Real Estate Co. and Islamic Holding Group were the top gainers, rising 8.3% and 3.5%, respectively. Among the top losers, United Development Co. fell 3.0%, while Mazaya Qatar Real Estate Development was down 1.9%. Volume of shares traded on Wednesday rose by 28.7% to 10.9mn from 8.5mn on Tuesday. Further, as compared to the 30-day moving average of 8.7mn, volume for the day was 25.4% higher. Barwa Real Estate Co. and Vodafone Qatar were the most active stocks, contributing 23.7% and 16.7% to the total volume, respectively. Source: Qatar Stock Exchange (* as a % of traded value) Ratings, Earnings Releases, Global Economic Data and Earnings Calendar Ratings Updates Company Agency Market Type* Old Rating New Rating Rating Change Outlook Outlook Change Aldar Properties Moody's Abu Dhabi IR Baa3 Baa2 Stable – Source: News reports (* LT – Long Term, ST – Short Term, FSR- Financial Strength Rating, FCR – Foreign Currency Rating, LCR – Local Currency Rating, IDR – Issuer Default Rating, SR – Support Rating, LC – Local Currency, IR- Issuer Rating) Earnings Releases Company Market Currency Revenue (mn) 4Q2016 % Change YoY Operating Profit (mn) 4Q2016 % Change YoY Net Profit (mn) 4Q2016 % Change YoY United Foods Co.* Duabi AED 402.2 0.5% – – 26.2 -5.8% Takaful Emarat Insurance* Dubai AED – – – – 15.0 46.9% Int. Fish Farming Holding Co.* Abu Dhabi AED 384.5 8.6% 13.1 379.2% 30.1 -46.7% Sharjah Group Co.* Abu Dhabi AED 15.2 6.5% – – 19.7 28.1% AL Khaleej Investment* Abu Dhabi AED 27.7 13.9% 24.2 19.0% 30.8 12.2% Source: Company data, DFM, ADX, MSM, TADAWUL (*FY 2016) Global Economic Data Date Market Source Indicator Period Actual Consensus Previous 02/08 US Mortgage Bankers Association MBA Mortgage Applications 3-February 2.3% – -3.2% 02/08 India Reserve Bank of India RBI Repurchase Rate 8-February 6.3% 6.0% 6.3% 02/08 India Reserve Bank of India RBI Reverse Repo Rate 8-February 5.8% 5.5% 5.8% Source: Bloomberg (s.a. = seasonally adjusted; n.s.a. = non-seasonally adjusted; w.d.a. = working day adjusted) Earnings Calendar Tickers Company Name Date of board meeting No. of days remaining Status QISI Qatar Islamic Insurance 12-Feb-17 3 Due QOIS Qatar & Oman Investment 15-Feb-17 6 Due QFLS Qatar Fuel Company 16-Feb-17 7 Due CBQK Commercial Bank 21-Feb-17 12 Due ORDS Ooredoo 22-Feb-17 13 Due QNNS Qatar Navigation (Milaha) 26-Feb-17 17 Due Source: QSE Overall Activity Buy %* Sell %* Net (QR) Qatari Individuals 40.71% 41.63% (3,296,745.65) Qatari Institutions 29.64% 31.42% (6,442,841.54) Qatari 70.35% 73.05% (9,739,587.19) GCC Individuals 0.81% 0.62% 698,884.19 GCC Institutions 3.26% 7.67% (15,942,808.82) GCC 4.07% 8.29% (15,243,924.63) Non-Qatari Individuals 10.67% 10.46% 753,955.06 Non-Qatari Institutions 14.91% 8.20% 24,229,556.76 Non-Qatari 25.58% 18.66% 24,983,511.82
- 3. Page 3 of 6 News Qatar MCGS net profit surges 517.2% QoQ in 4Q2016 – Medicare Group’s (MCGS) 4Q2016 net profit increased 517.2% QoQ to QR29.65mn as compared to QR4.80mn in 3Q2016. However, on YoY basis net profit fell 42.5% in 4Q2016. Earnings per share (EPS) amounted to QR2.31 in 2016 as compared to QR6.41 in 2015. The board of directors recommended distribution of 30% cash of the nominal share value, which is equivalent to QR3.00 per share. (QSE) QIMD’s net profit falls 53.4% QoQ in 4Q2016 – Qatar Industrial Manufacturing Company’s (QIMD) net profit declined 53.4% QoQ to QR30.72mn in 4Q2016 as compared to QR65.92mn in 3Q2016. On YoY basis, net profit declined 9.1% in 4Q2016. Earnings per share (EPS) amounted to QR4.08 in 2016 as compared to QR3.55 in 2015. The board of directors recommended distribution of dividend, amounting to 30% of the nominal shares, for 2016. (QSE) QInvest revenue rises 6% to QR416mn in 2016 – QInvest has seen a 6% increase in its revenue to QR416mn and a 3% rise in operating profits to QR220mn in 2016. The company’s net profits stood at QR22.5mn in 2016, following a prudent provisioning policy that will enable the firm to absorb any unpredictable market shocks without interruption to its business. The bank, licensed by the Qatar Financial Centre Authority and authorized by the Qatar Financial Centre Regulatory Authority, has also seen its assets scaling up 5% to QR4.7bn. Revenues during the year came from across all three business lines – investment banking, principal investments and asset management. They were generated from a variety of activities including advisory services, financing activities, private equity and fund investments, in addition to fees from discretionary managed accounts. These revenues were also generated across multiples geographies, which demonstrated the diversity and strength of all of the business lines. (Gulf-Times.com) Qatar inflation may pick up gradually on growing economic activity – Qatar’s inflation is expected to gradually accelerate on the back of strengthening economic activity. Consensus forecast panelists expect inflation to average 2.7% in 2017 and 3.1% in 2018. According to Focus Economics, Qatar’s economy closed 2016 on a mixed note. The economic growth for the year likely decelerated to the lowest level in two decades, weighed down by the effects of the oil price downturn. However, the government has made laudable efforts to attempt to compensate for the shortfall in oil-related revenues while sparing major infrastructure investments related to the 2022 World Cup and the Vision 2030 development plan, the cornerstones of Qatar’s non-hydrocarbon growth. Although the government is expected to roll out additional fiscal consolidation measures this year, the country will benefit from a more benign oil price environment, an increase in infrastructure outlays and a pick-up in business activity. (Gulf-Times.com) GISS announces the agenda for its ordinary and extraordinary general assembly meeting on February 26 – Gulf International Services (GISS) announced the agenda for its Ordinary and Extraordinary General Assembly Meeting, to be on February 26, 2017. If the quorum is not met, the meetings will be held on March 12, 2017 at the same location. The agenda for the Ordinary General Assembly Meeting is to listen to the Chairman’s Message for the financial year ended December 31, 2016, listen and approve the board of directors’ report on GISS operations and financial performance for the financial year ended December 31, 2016, and the future plans of the company, listen and approve the Auditors’ Report on GISS consolidated financial statements for the financial year ended December 31, 2016, approval of GISS financial statements for the financial year ended December 31, 2016, approve the board’s recommendation for a dividend payment of QR1 per share, representing 10% of the nominal share value, absolve the Board of Directors from responsibility for the year 2016 and approve their remuneration. (QSE) UDCD announces the agenda for its ordinary general assembly meeting on March 13 – United Development Company’s (UDCD) Annual Ordinary General Assembly Meeting, which will be held on March 13, 2017. The board will debate the Meeting agenda below. In the event a quorum is not reached, a second meeting will be held on March 20, 2017. Agenda for the Annual General Assembly Meeting are as follows: Hear the Board of Director’s report on the company’s activities and its financial position for the financial year ending December 31, 2016, and the future plan of the company, hear and ratify the Auditor’s report on the fiscal year ending December 31, 2016, the Company's balance sheet, and the loss and profit accounts, for the fiscal year ending December 31, 2016, discuss the board of director’s recommendation regarding the distribution of QR442,607,813 as dividends, equivalent to 12.5 % of the initial value of QR1.25 for each share, discharge members of the board of directors from liability for the year ending December 31, 2016, and approve their remuneration, the Corporate Governance Report for the year 2016 and appoint the External Auditors for the fiscal year 2017 and determine their fees. (QSE) MPHC announces the agenda for its ordinary and extraordinary general assembly meeting on March 6 – Mesaieed Petrochemical Holding Company (MPHC) announced the agenda for its Ordinary and Extraordinary General Assembly Meeting, to be held on March 6, 2017. If the quorum is not met, the meetings will be held on March 15, 2017. The agenda for the Ordinary General Assembly Meeting is as follows: listen to the Chairman’s Message for the financial year ended December 31, 2016, listen and approve the Board of Directors’ Report on MPHC’s operations and financial performance for the financial year ended December 31, 2016, and the future plans of the Company, listen and approve the Auditors’ Report on MPHC’s consolidated financial statements for the financial year ended December 31, 2016, approval of MPHC’s financial statements for the financial year ended December 31, 2016 and approve the 2016 Corporate Governance Report, approve the Board’s recommendation for a dividend payment of QR0.6 per share, representing 6% of the nominal share value, absolve the Board of Directors from responsibility for the year 2016 and approve their remuneration, appointment of the external auditors for the financial year ending December 31, 2017 and approve their fees. (QSE) SIIS’ subsidiary Salam Technology been awarded a project at the new port no. NPP-0067 – Salam International’s (SIIS) subsidiary Salam Technology has been awarded a project at the new port no. NPP-0067 which entails setting up its general networks system. Whereby the committee in charge contracted with the subsidiary for the setting up and implementation of the general networks system of the port, valuing the project at QR1.2bn which equates to approximately $322mn. The subsidiary was selected from a short list after having fought off fierce competition of which were international companies specialized in technology and IT systems. (QSE) International UK house price growth edges up after December slowdown – British house price growth became slightly more broad-based last month after slowing in December for the first time since just after June's vote to leave the EU. The Royal Institution of Chartered Surveyors (RICS) said its house price balance rose to +25 in January after dipping to +23 in December, its first fall since July, bucking expectations in a Reuter’s poll for a further modest loss of pace. Over the next five years, RICS said its members expected
- 4. Page 4 of 6 average British house prices to increase by just under 20%, while rents were seen rising by more than 25%. Britain's housing market has held up more strongly than expected since June's Brexit vote, but RICS reported static demand from new buyers in January. Just 5 percent of surveyors reported higher demand, the lowest since August. (Reuters) Japan logs biggest current account surplus since 2007 – Japan attained its second-biggest current account surplus on record in 2016, Ministry of Finance data showed, just days before the US and Japanese leaders meet for talks with trade surpluses and currency valuations expected to be high on the agenda. The $183.63bn surplus reflected the trade balance swinging into surplus on cheaper oil, rising foreign tourists arrivals creating a record travel surplus, and hefty foreign income from overseas investments. For the whole of 2016, Japan posted a trade surplus of $59.95bn with the US, down 4.6% from 2015, with US-bound car shipments rising for a second straight year, the Ministry of Finance said. Trump and Japanese Prime Minister Shinzo Abe are scheduled to meet for talks later this week. Trump said he and Abe would play a round of golf, with Abe as his partner in the game, rather than a competitor. (Reuters) Japan machinery orders rebound, trade protectionism poses risk – Japan's core machinery orders rebounded more than expected in December from the prior month's fall and are seen rising again this quarter - an encouraging sign of a pick-up in capital expenditure. The Cabinet Office data showed core orders, a highly volatile data series regarded as an indicator of capital spending in the coming six to nine months, grew 6.7% in December, the fastest month-on- month gain in six months. Japanese policymakers hope capital spending will help drive growth in the world's third-largest economy and pull it out of deflation and stagnation. By sector, core orders from manufacturers rose 1.0% in December, following a 9.8% gain the previous month. Orders from the services sector rose 3.5% after a 9.4% decline in November. (Reuters) RBI signals end to rate cuts as inflation risks rise – The Reserve Bank of India (RBI) kept its policy rate on hold on February 8 and unexpectedly signaled an end to its longest easing cycle since the global financial crisis, saying inflation poses a bigger threat to the economy than a crackdown on black money. After keeping the repo rate on hold at 6.25% for a second meeting in a row, the RBI also changed its stance to "neutral" from "accommodative", stunning bond investors who had bet the RBI would ease by 25 basis points, either this week or at its next policy review in April. The new stance could effectively mark an end to a period in which the RBI cut interest rates by a total of 175 bps from January 2015 to October 2016, starting with previous Governor Raghuram Rajan and continuing under Urjit Patel. (Reuters) Brazil's falling inflation fuels rate cut bets – Consumer prices rose less than expected in Brazil in January for the fifth straight month, increasing the chances of steeper interest rate cuts and a stronger economic recovery as the inflation rate falls toward the government's long-missed target. The annual inflation rate eased to 5.35% in the 12 months through January, below economists' expectations of 5.41%. Prices rose 0.38% from a month earlier, the smallest rise for January since 1994. (Reuters) Regional Complexity main reason for GCC muted Sukuk issuance – S&P Global Ratings said that lower liquidity in GCC banking systems is not the main driver of muted Sukuk issuance in recent years. Some market participants believe that the liquidity drop in Gulf countries, where the majority of Sukuk investors are based, explains the lower issuances volumes. S&P Global Ratings’ Global Head of Islamic Finance, Dr. Mohamed Damak said, “We see liquidity in GCC as adequate in a global comparison, though, and believe that the less supportive economic environment is translating into fewer growth opportunities, which could actually encourage banks to reallocate liquidity in the bond and Sukuk market, ultimately leading to an uptick in issuance volumes. We think that the latter factor is one of the main reasons behind muted Sukuk issuance in 2016 and believe it will continue to weigh on volumes in 2017.” The decision to issue Sukuk or bonds ultimately lies with the issuer and depends on many factors. These include the cost of issuance, the capacity of the market to absorb the transaction, the issuer’s target investor base, how ready the issuer’s regulatory and legal environment is for Sukuk issuance, and the complexity of structuring Sukuk. The Islamic finance industry remains dominated by banking, which accounted for over 80% of the industry’s $2.1tn assets at year-end 2016. (GulfBase.com) Islamic finance body drafts new standard for centralized Sharia boards – A global body for Islamic finance has issued a draft standard on centralized Sharia boards, aiming to improve corporate governance in the industry and increase the consumer appeal of Sharia-compliant financial products. The proposed rules come at a time when Islamic banks are trying to widen their appeal to consumers in core markets of the Middle East and Southeast Asia, while opening up entirely new ones particularly across Africa. Islamic banks have traditionally established internal Sharia boards, employing scholars to rule on whether their products are religiously permissible. Such self-regulation proved useful in the early years of the industry, but the establishment of independent Sharia boards at the national level to encourage homogeneous transactions that are cheap and quick to structure is gaining traction. (Reuters) A M Best: Mideast insurers face ‘significant’ investment risks – According to a global insurance credit rating agency A M Best, the Middle Eastern insurers and reinsurers are well-capitalized but fiscal budget pressures and pockets of political instability mask their strong balance sheets. Highlighting that regulatory demands help drive capital levels, its report said the regional players face “significant” investment risks as equity markets face illiquidity issues in certain jurisdictions. Finding that shares are often tightly held, with trading volumes lower than those in more mature bourses, as investment markets tend to be volatile, companies tend to be well capitalized to offset these risks. Sound capitalization has also been driven in part by more stringent regulatory demands in some countries on certain pressures on companies’ management and balance sheets, finding that in particular, the profitability of (re)insurers in Saudi Arabia and the UAE are being affected as regulators are enforcing regular actuarial reserving requirements and pricing reviews. (Gulf- Times.com) S&P: GCC sovereigns aim to raise $275bn – GCC sovereigns financing will need an estimated $275bn over the next three years. According to S&P Global Ratings, these countries will predominantly use debt financing. Sukuk comprise only a small amount of total outstanding issuance, however work has been carried out by various governments over the past few years, particularly by Kuwait and Saudi Arabia, to establish the necessary legal frameworks for their issuance. With the backdrop of weakening global liquidity, this potential source of financing could become a more attractive financing prospect for GCC governments and is an additional source of external liquidity relevant for our sovereign rating analysis. On the liquidity decline in the GCC banking system, the ratings agency noted, the liquidity issue does not appear to have been a main factor in lower Sukuk issuance over 2016. (Peninsula Qatar) Prospects for tourism growth in Saudi Arabia bright – The cultural, leisure and tourism landscape in Saudi Arabia is changing quite
- 5. Page 5 of 6 rapidly and the scale of opportunity, particularly from domestic tourism growth, is significant. According to Colliers International, at a total contribution of SR190bn in 2015, travel and tourism is currently the second highest contributor to Gross Domestic Product (GDP) growth in Saudi Arabia, albeit from a relatively low base compared to other countries in the GCC. With a compounded annual growth rate (CAGR) of 7.4%, domestic tourism is forecast to grow to an impressive 66mn trips per annum by 2020, up from 46.5mn, driven by growth in both religious and leisure tourism. Moreover, with a CAGR of 4.8%, inbound tourism is forecast to grow to over 32mn trips per annum by 2026, driven primarily by growth in religious tourism in 2015, travel and tourism is estimated to have attracted a capital investment of SR81.1bn. This is forecast to rise by 4.2% in 2016 and by a further 4.4% per annum over the next 10 years to SR130.5bn in 2026. It is projected that travel and tourism’s share of total national investment will rise from 12.5% in 2016 to 14.3% in 2026. (GulfBase.com) Saudia to receive 29 new aircraft in 2017 – A total of 11 Airbus aircraft joined the fleet of Saudi Arabian Airlines in 2017, of which three of them reached King Abdulaziz International Airport. The national carrier will take delivery of another 29 aircraft during 2017. Saudia Director General Saleh Al-Jasser said Saudia would have a fleet of 200 modern aircraft by the year 2020. (GulfBase.com) Saudi Cement proposes 2H2016 cash dividend of SR2.75 per share – Saudi Cement's board has proposed paying a cash dividend of SR2.75 per share for 2H2016. This compares with a proposed dividend of SR3 per share for the prior-year period. Saudi Cement, one of the Kingdom's largest cement firms by market value, last month reported a 6.3% increase in 4Q2016 net profit. (Reuters) Dubai sets a new tourism record – The city’s tourism department said that Dubai welcomed record 14.9mn visitors, in 2016, as the Gulf Emirate capitalized on its reputed safety in a region wracked by turmoil. The Emirate aims to attract 20mn visitors annually by 2020 when it hosts the global trade fair Expo 2020. As turmoil hits traditional tourism destinations in the Middle East and North Africa, Dubai has benefitted from its reputation as a safe haven for tourism and business. The number of visitors to Dubai in 2016 increased by 5% compared to the previous year. Travelers from Gulf countries made up almost 23% of all visitors, with Saudi Arabia’s alone accounting for almost half of them. The economy of Dubai is seen as the most diversified in the Gulf, helped by trade and tourism, and is not dependent on oil revenues. (GulfBase.com) Dubai Islamic Bank issues $1bn Sukuk – Dubai Islamic Bank announced the successful pricing of the largest senior Sukuk issuance by a financial institution globally. The $1bn Sukuk was issued with a 5 year tenor, maturing on 14th February 2022. The issuance of $5bn Sukuk Program carries a profit rate of 3.664% reflecting the strong demand and confidence which global investors have in the UAE’s largest Islamic bank. (GulfBase.com) DAMAC reaffirms position as luxury master developer – DAMAC Properties, a leading luxury real estate developer in the region, today announced a significant number of milestones achieved at its premiere golf master planned community, featuring Trump International Golf Club Dubai at its center. (GulfBase.com) Etihad sees challenging year as passenger growth slows – Etihad Airways faces another challenging year, adding the Abu Dhabi- based carrier would expand prudently and efficiently in 2017. Gulf carriers are under pressure to adapt to slowing growth after years of rapid expansion. Two weeks ago, Etihad said it was conducting a company-wide strategic review and Hogan would step down in 2H2017. (Reuters) Kuwait’s KIPCO mandates banks for bond issue of up to $500mn, to repurchase debt – Kuwait Projects Co. has mandated banks to arrange a new US dollar-denominated bond issue of up to $500mn. The new bond, which will have a 10-year maturity, will be part of KIPCO’s existing $3bn Euro medium term note program. Citi, HSBC, Kamco and JP Morgan have been appointed to arrange the debt offer, which will be issued by KIPCO’s subsidiary Kuwait Projects Co SPC Ltd, registered at the Dubai International Financial Centre. Separately, HSBC invited holders of KIPCO’s outstanding $500mn notes with a 4.8% coupon and due in 2019 to tender their notes for repurchase. Holders of the notes will be able to sell them for cash to HSBC at a price of 105.250%. (Reuters)
- 6. Contacts Saugata Sarkar Shahan Keushgerian Zaid al-Nafoosi, CMT, CFTe Head of Research Senior Research Analyst Senior Research Analyst Tel: (+974) 4476 6534 Tel: (+974) 4476 6509 Tel: (+974) 4476 6535 saugata.sarkar@qnbfs.com.qa shahan.keushgerian@qnbfs.com.qa zaid.alnafoosi@qnbfs.com.qa Mohamed Abo Daff QNB Financial Services Co. W.L.L. Senior Research Analyst Contact Center: (+974) 4476 6666 Tel: (+974) 4476 6589 PO Box 24025 mohd.abodaff@qnbfs.com.qa Doha, Qatar Disclaimer and Copyright Notice: This publication has been prepared by QNB Financial Services Co. W.L.L. (“QNBFS”) a wholly-owned subsidiary of QNB SAQ (“QNB”). QNBFS is regulated by the Qatar Financial Markets Authority and the Qatar Exchange QNB SAQ is regulated by the Qatar Central Bank. This publication expresses the views and opinions of QNBFS at a given time only. It is not an offer, promotion or recommendation to buy or sell securities or other investments, nor is it intended to constitute legal, tax, accounting, or financial advice. QNBFS accepts no liability whatsoever for any direct or indirect losses arising from use of this report. Any investment decision should depend on the individual circumstances of the investor and be based on specifically engaged investment advice. We therefore strongly advise potential investors to seek independent professional advice before making any investment decision. Although the information in this report has been obtained from sources that QNBFS believes to be reliable, we have not independently verified such information and it may not be accurate or complete. QNBFS does not make any representations or warranties as to the accuracy and completeness of the information it may contain, and declines any liability in that respect. For reports dealing with Technical Analysis, expressed opinions and/or recommendations may be different or contrary to the opinions/recommendations of QNBFS Fundamental Research as a result of depending solely on the historical technical data (price and volume). QNBFS reserves the right to amend the views and opinions expressed in this publication at any time. It may also express viewpoints or make investment decisions that differ significantly from, or even contradict, the views and opinions included in this report. This report may not be reproduced in whole or in part without permission from QNBFS. COPYRIGHT: No part of this document may be reproduced without the explicit written permission of QNBFS. Page 6 of 6 Rebased Performance Daily Index Performance Source: Bloomberg Source: Bloomberg Source: Bloomberg Source: Bloomberg (*$ adjusted returns) 80.0 100.0 120.0 140.0 160.0 180.0 Jan-13 Jan-14 Jan-15 Jan-16 Jan-17 QSEI ndex S& PPanA r ab S& PGCC (1.0%) 0.7% 1.1% (0.0%) 0.1% 0.6% 0.2% (1.4%) (0.7%) 0.0% 0.7% 1.4% SaudiArabia Qatar Kuwait Bahrain Oman AbuDhabi Dubai Asset/Currency Performance Close ($) 1D% WTD% YTD% Global Indices Performance Close 1D%* WTD%* YTD%* Gold/Ounce 1,241.48 0.6 1.7 7.7 MSCI World Index 1,802.26 0.3 (0.2) 2.9 Silver/Ounce 17.78 0.4 1.5 11.7 DJ Industrial 20,054.34 (0.2) (0.1) 1.5 Crude Oil (Brent)/Barrel (FM Future) 55.12 0.1 (3.0) (3.0) S&P 500 2,294.67 0.1 (0.1) 2.5 Crude Oil (WTI)/Barrel (FM Future) 52.34 0.3 (2.8) (2.6) NASDAQ 100 5,682.45 0.1 0.3 5.6 Natural Gas (Henry Hub)/MMBtu 3.05 0.5 1.6 (17.2) STOXX 600 363.94 0.4 (0.8) 2.1 LPG Propane (Arab Gulf)/Ton 80.00 4.2 (8.0) 11.5 DAX 11,543.38 (0.0) (1.7) 2.0 LPG Butane (Arab Gulf)/Ton 120.00 6.2 0.0 23.7 FTSE 100 7,188.82 0.4 0.2 2.2 Euro 1.07 0.1 (0.8) 1.7 CAC 40 4,766.60 0.3 (2.0) (0.6) Yen 111.93 (0.4) (0.6) (4.3) Nikkei 19,007.60 0.7 1.2 3.8 GBP 1.25 0.3 0.5 1.6 MSCI EM 921.68 0.2 0.3 6.9 CHF 1.01 0.3 (0.2) 2.4 SHANGHAI SE Composite 3,166.98 0.6 0.2 3.0 AUD 0.76 0.2 (0.5) 6.1 HANG SENG 23,485.13 0.7 1.5 6.7 USD Index 100.28 0.0 0.4 (1.9) BSE SENSEX 28,289.92 0.4 0.3 7.8 RUB 59.18 (0.5) 0.3 (3.8) Bovespa 64,835.40 1.3 (0.3) 12.3 BRL 0.32 0.1 0.0 4.4 RTS 1,164.65 (1.2) (2.2) 1.1 127.5 106.4 104.1