SlideShare a Scribd company logo
1 of 9
Download to read offline
Page 1 of 9
QSE Intra-Day Movement
Qatar Commentary
The QE Index declined 0.1% to close at 10,274.6. Losses were led by the Industrials
and Telecoms indices, falling 0.3% and 0.2%, respectively. Top losers were Qatar
General Insurance & Reinsurance Company and Industries Qatar, falling 2.5% and
1.3%, respectively. Among the top gainers, Qatar Cinema & Film Distribution
Company gained 9.1%, while Aamal Company was up 4.1%.
GCC Commentary
Saudi Arabia: The TASI Index gained 0.6% to close at 7,798.3. Gains were led by the
Food & Bev. and Com. & Prof. Svc indices, rising 1.4% and 1.1%, respectively. Al
Kathiri Holding Co. rose 9.9%, while Middle East Healthcare Co. was up 6.1%.
Dubai: The DFM Index gained 0.4% to close at 2,698.8. The Services index rose 1.7%,
while the Transportation index gained 1.2%. Dar Al Takaful rose 5.6%, while
Almadina for Finance and Investment Company was up 2.6%.
Abu Dhabi: The ADX General Index fell 0.2% to close at 5,131.4. The Industrial index
declined 0.7%, while the Energy index fell 0.5%. Al Buhaira National Insurance Co.
declined 9.6%, while National Takaful Company was down 6.0%.
Kuwait: The Kuwait All Share Index gained 0.3% to close at 5,694.0. The Consumer
Goods index rose 1.9%, while the Consumer Services index gained 1.3%. Sanam Real
Estate Co. rose 10.0%, while Specialities Group Holding Co. was up 7.3%.
Oman: The MSM 30 Index gained 0.3% to close at 4,040.6. Gains were led by the
Industrial and Financial indices, rising 0.9% and 0.3%, respectively. Al Anwar
Ceramic Tiles and Al Omaniya Financial Services were up 5.9% each.
Bahrain: The BHB Index gained 0.1% to close at 1,518.3. The Commercial Banks
index rose 0.2%, while the other indices ended flat or in the red. Al Salam Bank -
Bahrain rose 1.0%, while Seef Properties was up 0.5%.
QSE Top Gainers Close* 1D% Vol. ‘000 YTD%
Qatar Cinema & Film Distribution 2.40 9.1 0.1 26.2
Aamal Company 0.73 4.1 11,775.5 (17.2)
Qatar Industrial Manufacturing Co 3.47 3.9 48.4 (18.7)
Gulf International Services 1.78 2.9 3,085.7 4.7
Ahli Bank 3.69 2.5 0.0 45.0
QSE Top Volume Trades Close* 1D% Vol. ‘000 YTD%
Aamal Company 0.73 4.1 11,775.5 (17.2)
Masraf Al Rayan 3.87 1.0 5,209.4 (7.1)
Ezdan Holding Group 0.64 1.1 4,751.8 (50.9)
Al Khaleej Takaful Insurance Co. 2.20 0.0 4,098.4 156.1
Qatari German Co for Med. Devices 0.59 (1.3) 3,833.8 4.9
Market Indicators 07 Nov 19 06 Nov 19 %Chg.
Value Traded (QR mn) 211.3 160.9 31.4
Exch. Market Cap. (QR mn) 568,535.0 569,202.1 (0.1)
Volume (mn) 62.5 88.8 (29.7)
Number of Transactions 5,782 4,359 32.6
Companies Traded 45 44 2.3
Market Breadth 29:12 16:22 –
Market Indices Close 1D% WTD% YTD% TTM P/E
Total Return 18,906.05 (0.1) 0.8 4.2 14.9
All Share Index 3,032.12 (0.1) 0.8 (1.5) 14.9
Banks 4,057.68 (0.1) 1.4 5.9 13.6
Industrials 2,964.96 (0.3) 0.7 (7.8) 20.3
Transportation 2,620.46 (0.0) (1.0) 27.2 14.0
Real Estate 1,479.55 0.4 (0.9) (32.3) 11.1
Insurance 2,686.03 0.3 (0.5) (10.7) 15.4
Telecoms 923.78 (0.2) (0.6) (6.5) 15.7
Consumer 8,511.84 0.2 0.7 26.0 18.9
Al Rayan Islamic Index 3,926.52 0.2 0.4 1.1 16.3
GCC Top Gainers## Exchange Close# 1D% Vol. ‘000 YTD%
Samba Financial Group Saudi Arabia 28.50 3.1 1,708.8 (9.2)
Savola Group Saudi Arabia 31.15 2.6 1,310.6 16.2
Yanbu National Petro. Co. Saudi Arabia 51.20 2.4 841.5 (19.7)
Saudi Kayan Petrochem. Saudi Arabia 10.40 2.2 9,957.1 (21.2)
Bank Al Bilad Saudi Arabia 25.30 2.1 683.7 16.1
GCC Top Losers## Exchange Close# 1D% Vol. ‘000 YTD%
Co. for Cooperative Ins. Saudi Arabia 68.00 (2.2) 247.1 12.8
Emaar Economic City Saudi Arabia 9.30 (1.8) 1,336.5 17.6
National Shipping Co. Saudi Arabia 30.70 (1.6) 938.2 (8.1)
Mouwasat Medical Serv. Saudi Arabia 84.90 (1.4) 48.4 5.5
Industries Qatar Qatar 10.36 (1.3) 1,070.0 (22.5)
Source: Bloomberg (# in Local Currency) (## GCC Top gainers/losers derived from the S&P GCC
Composite Large Mid Cap Index)
QSE Top Losers Close* 1D% Vol. ‘000 YTD%
Qatar General Ins. & Reins. Co. 2.38 (2.5) 114.7 (47.0)
Industries Qatar 10.36 (1.3) 1,070.0 (22.5)
Qatari German Co for Med. Dev. 0.59 (1.3) 3,833.8 4.9
Qatar Navigation 6.30 (0.9) 123.9 (4.6)
Mesaieed Petrochemical Holding 2.57 (0.8) 1,986.5 71.0
QSE Top Value Trades Close* 1D% Val. ‘000 YTD%
QNB Group 19.48 (0.5) 45,677.0 (0.1)
Qatar International Islamic Bank 9.48 0.2 25,827.6 43.4
Masraf Al Rayan 3.87 1.0 20,079.3 (7.1)
Qatar Fuel Company 22.38 0.1 15,990.2 34.8
Industries Qatar 10.36 (1.3) 11,136.8 (22.5)
Source: Bloomberg (* in QR)
Regional Indices Close 1D% WTD% MTD% YTD%
Exch. Val. Traded
($ mn)
Exchange Mkt.
Cap. ($ mn)
P/E** P/B**
Dividend
Yield
Qatar* 10,274.56 (0.1) 0.8 0.8 (0.2) 57.72 156,176.6 14.9 1.5 4.1
Dubai 2,698.78 0.4 (1.8) (1.8) 6.7 65.52 100,593.5 10.7 1.0 4.3
Abu Dhabi 5,131.37 (0.2) 0.5 0.5 4.4 27.36 142,329.7 15.4 1.4 4.9
Saudi Arabia 7,798.25 0.6 0.7 0.7 (0.4) 739.13 489,348.8 20.1 1.7 3.9
Kuwait 5,693.95 0.3 (0.4) (0.4) 12.1 44.90 106,521.6 14.0 1.3 3.7
Oman 4,040.59 0.3 1.0 1.0 (6.5) 2.59 17,489.6 7.5 0.7 7.4
Bahrain 1,518.33 0.1 (0.3) (0.3) 13.5 4.57 23,694.1 11.4 0.9 5.1
Source: Bloomberg, Qatar Stock Exchange, Tadawul, Muscat Securities Market and Dubai Financial Market (** TTM; * Value traded ($ mn) do not include special trades, if any)
10,240
10,260
10,280
10,300
10,320
9:30 10:00 10:30 11:00 11:30 12:00 12:30 13:00
Page 2 of 9
Qatar Market Commentary
 The QE Index declined 0.1% to close at 10,274.6. The Industrials and
Telecoms indices led the losses. The index fell on the back of selling
pressure from Qatari and GCC shareholders despite buying support from
non-Qatari shareholders.
 Qatar General Insurance & Reinsurance Company and Industries Qatar
were the top losers, falling 2.5% and 1.3%, respectively. Among the top
gainers, Qatar Cinema & Film Distribution Company gained 9.1%, while
Aamal Company was up 4.1%.
 Volume of shares traded on Thursday fell by 29.7% to 62.5mn from
88.8mn on Wednesday. Further, as compared to the 30-day moving
average of 78.0mn, volume for the day was 19.9% lower. Aamal Company
and Masraf Al Rayan were the most active stocks, contributing 18.8%
and 8.3% to the total volume, respectively.
Source: Qatar Stock Exchange (* as a % of traded value)
Ratings, Earnings Releases and Global Economic Data
Ratings Updates
Company Agency Market Type* Old Rating New Rating Rating Change Outlook Outlook Change
Arabian Centres
Co. Ltd
Moody's
Saudi
Arabia
LT-CFR – Ba1 – Stable –
Source: News reports, Bloomberg (* LT – Long Term, CFR – Corp Family Rating)
Earnings Releases
Company Market Currency
Revenue (mn)
3Q2019
% Change
YoY
Operating Profit
(mn) 3Q2019
% Change
YoY
Net Profit
(mn) 3Q2019
% Change
YoY
Al Alamiya for Cooperative
Insurance Co.
Saudi Arabia SR – – – – 2.6 31.8%
Emaar The Economic City Saudi Arabia SR 163.0 45.5% (131.0) N/A (202.0) N/A
Aseer Trading, Tourism &
Manufacturing Co.
Saudi Arabia SR 484.4 0.1% (4.2) N/A (32.1) N/A
Takween Advanced Industries Co. Saudi Arabia SR 314.7 -15.1% (15.2) N/A (28.8) N/A
Al Jouf Cement Co. Saudi Arabia SR 27.0 4.7% 2.5 N/A 1.1 N/A
Jazan Energy And Development Co. Saudi Arabia SR 19.1 2.9% (0.5) N/A (1.3) N/A
Tourism Enterprise Co. Saudi Arabia SR 4.0 7.4% (0.2) N/A (0.3) N/A
National Medical Care Co. Saudi Arabia SR 173.5 -1.6% 23.0 30.8% 16.6 45.4%
Wafrah For Industry And
Development Co.
Saudi Arabia SR 21.3 58.5% (1.8) N/A (1.8) N/A
Alandalus Property Co. Saudi Arabia SR 42.7 5.5% 26.1 9.7% 14.6 15.6%
Middle East Healthcare Co. Saudi Arabia SR 386.8 14.2% 33.3 56.5% 33.2 64.8%
Ithmaar Holding Dubai AED 135.6 23.2% 74.0 17.9% 3.7 N/A
Source: Company data, DFM, ADX, MSM, TASI, BHB.
Global Economic Data
Date Market Source Indicator Period Actual Consensus Previous
11/07 US Department of Labor Initial Jobless Claims 2-Nov 211k 215k 219k
11/07 US Department of Labor Continuing Claims 26-Oct 1,689k 1,682k 1,692k
11/07 US Federal Reserve Consumer Credit Sep $9.513bn $15.000bn $17.842bn
11/07 UK Bank of England Bank of England Bank Rate 7-Nov 0.75% 0.75% 0.75%
11/07 Germany Deutsche Bundesbank Industrial Production SA MoM Sep -0.60% -0.40% 0.40%
11/07 Germany Bundesministerium fur Wirtscha Industrial Production WDA YoY Sep -4.30% -4.40% -3.90%
11/07 Germany Markit Markit Germany Construction PMI Oct 51.5 – 50.1
11/08 Germany German Federal Statistical Office Trade Balance Sep 21.1bn 19.5bn 16.2bn
11/08 Germany German Federal Statistical Office Current Account Balance Sep 25.5bn 19.1bn 17.3bn
11/08 Germany Deutsche Bundesbank Exports SA MoM Sep 1.50% 0.30% -0.90%
11/08 Germany Deutsche Bundesbank Imports SA MoM Sep 1.30% 0.0% 0.10%
Overall Activity Buy %* Sell %* Net (QR)
Qatari Individuals 26.18% 26.36% (397,726.49)
Qatari Institutions 16.22% 35.11% (39,914,238.29)
Qatari 42.40% 61.47% (40,311,964.78)
GCC Individuals 0.87% 3.31% (5,157,064.84)
GCC Institutions 2.51% 4.83% (4,892,453.79)
GCC 3.38% 8.14% (10,049,518.63)
Non-Qatari Individuals 5.74% 7.53% (3,785,152.20)
Non-Qatari Institutions 48.48% 22.86% 54,146,635.61
Non-Qatari 54.22% 30.39% 50,361,483.41
Page 3 of 9
11/08 France Ministry of the Economy, Franc Trade Balance Sep -5,551mn -4,964mn -5,436mn
Date Market Source Indicator Period Actual Consensus Previous
11/08 France Banque De France Current Account Balance Sep -2.7bn – -3.0bn
11/08 France French Labor Office Wages QoQ 3Q P 0.30% 0.40% 0.50%
11/08 France INSEE National Statistics Office Industrial Production MoM Sep 0.30% 0.40% -0.90%
11/08 France INSEE National Statistics Office Industrial Production YoY Sep 0.10% 0.30% -1.30%
11/08 France INSEE National Statistics Office Manufacturing Production MoM Sep 0.60% 0.20% -0.80%
11/08 France INSEE National Statistics Office Manufacturing Production YoY Sep 0.40% 0.10% -1.50%
11/07 China National Bureau of Statistics Foreign Reserves Oct $3,105.16bn $3,100.00bn $3,092.43bn
11/08 China National Bureau of Statistics Imports YoY Oct -6.40% -7.80% -8.50%
11/08 China National Bureau of Statistics Exports YoY Oct -0.90% -3.90% -3.20%
11/08 China National Bureau of Statistics Trade Balance Oct $42.81bn $40.10bn $39.65bn
11/09 China National Bureau of Statistics CPI YoY Oct 3.80% 3.40% 3.00%
11/09 China National Bureau of Statistics PPI YoY Oct -1.60% -1.50% -1.20%
11/09 China The People's Bank of China Money Supply M0 YoY Oct – 4.00% 4.00%
11/09 China The People's Bank of China Money Supply M1 YoY Oct – 3.80% 3.40%
11/09 China The People's Bank of China Money Supply M2 YoY Oct – 8.40% 8.40%
Source: Bloomberg (s.a. = seasonally adjusted; n.s.a. = non-seasonally adjusted; w.d.a. = working day adjusted)
News
Qatar
 The semi-annual index review – MSCI announced on November
07, 2019, the result of the semi-annual index review. For the QSE
listed companies, Qatar International Islamic Bank (QIIK) added
to MSCI Qatar Index and none were deleted from MSCI indices.
The changes to the MSCI indices will become effective on close
of November 26, 2019. (QSE)
 US Secretary of Commerce Wilbur Ross visits Baladna – The US
Secretary of Commerce Wilbur Ross arrived in Qatar to discuss
key initiatives between Qatar and the US. Secretary Wilbur
Ross, along with the Minister of Commerce and Industry HE Ali
bin Ahmed Al Kuwari, also visited Baladna, the leading and
largest dairy producer in Qatar. Baladna, a Qatari public
shareholding company under incorporation, recently announced
that its subsidiary Baladna Food Industries (BFI), Qatar’s best-
loved and market-leading dairy and beverage brand, has made
significant investment in new, state-of-the art facilities at its
Umm AlHawaya dairy farm. The investment comes as Baladna
has announced an IPO to enable Qatari citizens and corporates
to share in the company’s rapid growth and expansion.
Following the blockade in June 2017, BFI embarked on an
extensive program of significant investment in infrastructure
development, plant and machinery to increase production
capacity and achieve self-sufficiency in its dairy and juice
production. BFI’s facilities at Umm AlHawaya now consist of
two separate dairy farms, six milking areas, forty barns, three
dairy and juice factories, a plastics factory, an animal feed
processing facility, a water treatment facility, and a compost
processing facility. The US Secretary of Commerce, who is here
after a whirlwind Asia-Pacifictour, is expected to hold high-level
discussions in Qatar. The past week witnessed a series of Qatar-
US discussions, at several levels, that reinforced the relations
between the two countries. US Secretary of Treasury Steven
Mnuchin concluded a two-day visit to Qatar on November 5.
(Peninsula Qatar)
 Al Rayyan Municipality tops in building permit issuance in
October – Al Rayyan Municipality has topped the country in
terms of the number of building permits issued in October.
According to the monthly statistics, 221 permits were issued by
Al Rayyan Municipality, constituting a 23% share in total
permits issued in the country. Planning and Statistics Authority
released the monthly statistics of building permits issued by all
municipalities. Al Wakrah Municipality came second with the
issuance of 203 permits, having a share of 21%, followed by Al
Da’ayen Municipality that sawissuance of 193 permits with 20%
share and Doha Municipality witnessed issuance of 170 permits
having a share of 18%. Umm Slal issued 67 permits, Al Khor 40
permits, Al Sheehaniya 38 permits while Al Shammal issued 22
permits. In terms of type of permits issued, data showed that the
new building permits (residential and non-residential)
constituted 57% (545 permits) of the total building permits
issued in October, while the percentage of additions permits
constituted 40% (381 permits), and fencing permits with 3% (28
permits). (Peninsula Qatar)
 Opportunities galore for foreign firms in Qatar – Many
international companies are looking for business opportunities
in Qatar especially in the food and tourism sectors, chairperson
of the Italian Chamber of Commerce in Qatar has said. Talking to
Qatar Tribune on the sidelinesof the Back 2 Business networking
event in Doha, Italian Chamber of Commerce in Qatar Palma
Libotte said that representatives of many food companies from
Italy and other countries took part in the Back 2 Business
networking event to discuss business opportunities in Qatar.
With 2022 FIFA World Cup approaching fast, Libotte said, the
number of people visiting Qatar has increased and resulted in
many business opportunities in the country. “Italian Chamber of
Commerce in Qatar has started a guide service for high-profile
delegations and individuals visiting the country in five
international languages like Spanish, Italian, English, French
and German. It has emerged as a very good business opportunity
Page 4 of 9
in Qatar.” “It’s a tailor-made service to assist business delegation
looking for business opportunities in Qatar. We are getting a
very good response from foreign delegations as a number of such
delegations and individuals have approached us to avail of this
service,” she said. Despite the ongoing the blockade, Libotte said
that business sentiment in Qatar is quite upbeat and it can be
gauged from the fact that the 16th edition of Back to Business
attracted more than 400 international and local participants.
(Qatar Tribune)
 Qatar 2020 census to start Sunday – The Planning and Statistics
Authority’s first phase of the general census of population,
housing and establishments (Qatar 2020 Census), will start
Sunday. The process will last one month. The Authority will hold
a press conference Sunday to announce the details of the first
phase of the census process, the first field work of researchers,
the following stages of the process and its nature, and the
objectives of the census. The press conference will be addressed
by HE the President of Planning and Statistics Authority Dr
Saleh bin Mohamed Al-Nabit, and members of the Census
Executive Committee. Last week, the Planning and Statistics
Authority organized the main training program for field
researchers as part of preparations for the first phase of the Qatar
Population, Housing and Establishments Census 2020 (data
completion phase). The census is one of the most important
statistical projects to collect comprehensive and up-to-date data
of individuals, families, buildings and establishments in order to
achieve developmental and service objectives. (Gulf-
Times.com)
International
 QNB Group economic commentary: US Fed cuts rates again and
signals a pause for breath – The US Federal Reserve (Fed) has
decided to cut rates for the third time this year at its latest
monetary policy meeting in October 29-30th. The target range
for the benchmark fed funds rate was adjusted down by another
25 basis points (bps) to 1.5-1.75%. Stated reasons for the cut
included “the implication of global developments for the
economic outlook as well as muted inflation pressures.” This
decision was widely anticipated. Forward guidance from the
official statement and the post meeting press conference were
moderately hawkish. The previous line about acting “as
appropriate to sustain the expansion” was substituted by more
ambiguous language about assessing “the appropriate path of
the target range for the federal funds rate.” The
characterizations of growth, inflation and risks to the outlook
remained essentially the same. Moreover, regional Fed
presidents Esther George (Kansas City) and Eric Rosengren
(Boston) reaffirmed their hawkish dissent against the decision
to cut rates further. Three main factors help explain the Fed’s
moderately hawkish statement and the space for a pause before
incoming data points to a more clear direction for the US and
global economies. First, investor sentiment has improved
significantly in recent weeks, which eased financial conditions
and created a more supportive climate for risk taking. Despite
ebbs and flows, developments in key risk factors such as global
trade conflicts seem to have taken a positive turn. As a response,
the Chicago Board Options Exchange (CBOE) Volatility Index
(VIX), often referred to as “fear gauge,” has plummeted.
Similarly, CNN’s Fear and Greed Index, which collects several
indicators to estimate the emotions driving investor behavior,
moved from “fear” a month ago to “extreme greed” at the time of
writing. Second, leading indicators of global demand started to
show more persistent signs of stabilization. The Global
Manufacturing Purchasing Managers’ Indices (PMI), for
example, have bottomed in May 2019 after falling for several
consecutive months. Currently at 51.2, the PMI is still above the
50 threshold that separates contraction from expansion. More
importantly, exports from Asian early reporters, a key gauge of
global activity, are finally stabilizing after almost two years of
slowdown and even some decline. This is a key input for US
policymakers as battered global conditions are often presented
as one of the main reasons behind the need for further monetary
accommodation. Third, market based early warning indicators
have also eased, moderating the implied probabilities of a
recession over the short-term. As investors rotate from safe-
haven bonds to riskier assets, several of the US government
yield curves have returned to positive territory after inverting.
This includes the benchmark spread between the 10-year
Treasury notes versus the 3-month bills. Inverted yield curves
historically signaled a coming recession a year or two in
advance. In addition, equity market internals or market breadth
indicators have also improved. The S&P 500’s recent all-time
highs seems to have a stronger base as market internals are more
synchronized and trading volume data also supports overall
stronger market breath. (Peninsula Qatar)
 Fed sees climate change shaping economy, policy – The US
central bank signaled on Friday it may be getting ready to join
international peers in incorporating climate change risk into its
assessments of financial stability, and may even take it into
account when setting monetary policy. “To fulfill our core
responsibilities, it will be important for the Federal Reserve to
study the implications of climate change for the economy and
the financial system and to adapt our work accordingly,” Fed
Governor Lael Brainard said in remarks released at the start of
the Fed’s first-ever conference on climate change and
economics. The Fed, she said, will need to look at how to keep
banks and the financial system resilient amid risks from extreme
weather, higher temperatures, rising sea levels and other effects
of the accumulation of greenhouse gases in the atmosphere. And
increasingly, she said, “it will be important for the Federal
Reserve to take into account the effects of climate change and
associated policies in setting monetary policy to achieve our
objectives of maximum employment and price stability.”
Brainard’s comments mark a shift for the Fed, which lags other
major central banks that have made climate change an explicit
part of their financial stability remits. Her talk, the first she’s
given in her five-year tenure at the Fed that even mentions the
subject, suggests she and her colleagues are taking the risks and
costs of global warming seriously. (Reuters)
 US wholesale inventories revised lower, sales flat – US
wholesale inventories fell more than initially estimated in
September to post their biggest decline in nearly two years,
suggesting inventory investment could continue to weigh on
economic growth. The Commerce Department stated on Friday
wholesale inventories fell 0.4% in September, instead of the
previously reported 0.3% decline, after having risen 0.1% in
August. Inventories were up 4.8% on a year-on-year basis in
September. The decline in September was the largest since
Page 5 of 9
October 2017. The component of wholesale inventories that goes
into the calculation of gross domestic product fell 0.3% in
September. The pace of inventory accumulation has been
slowing after stocks increased strongly from the third quarter of
2018 through the first quarter of this year. The inventory
overhang has led businesses to place fewer orders at factories,
contributing to a downturn in the manufacturing sector, which
also has been hurt by uncertainty over the ongoing US-China
trade negotiations. Sales at wholesalers were unchanged in
September after falling 0.1% in August. Motor vehicle sales
slumped 3.1% in September after edging up 0.1% in the previous
month. At September’s sales pace it would take wholesalers 1.36
months to clear shelves, unchanged from August. (Reuters)
 US weekly jobless claims fall more than expected – The number
of Americans filing applications for unemployment benefits fell
more than expected last week, consistent with strong labor
market conditions and continued job growth. Initial claims for
state unemployment benefits decreased 8,000 to a seasonally
adjusted 211,000 for the week ended November 2, the Labor
Department stated on Thursday. Data for the prior week was
revised to show 1,000 more applications received than
previously reported. Economists polled by Reuters had forecast
claims would fall to 215,000 in the latest week. The Labor
Department stated claims for one state, Kentucky, were
estimated last week. The four-week moving average of initial
claims, considered a better measure of labor market trends as it
irons out week-to-week volatility, increased 250 to 215,250 last
week. The level of claims suggests solid labor market conditions.
Reuters)
 Moody's: UK spending plans, Brexit paralysis put rating at risk –
Moody’s warned on Friday it might cut its rating on Britain’s
sovereign debt again, saying that neither of the main political
parties in next month’s election was likely to tackle high
borrowing levels which Brexit had made even harder to fix. In a
toughly worded statement, Moody’s stated the fissures in
Britain’s society and politics exposed by its still-unresolved
decision to leave the European Union would be long-lasting.
Moody’s said Britain’s 1.8tn Pounds ($2.30tn) of public debt -
more than 80% of annual economic output - risked rising again
and the economy could be “more susceptible to shocks than
previously assumed.” Both of the main political parties have
promised big spending increases ahead of next month’s election.
“In the current political climate, Moody’s sees no meaningful
pressure for debt-reducing fiscal policies,” the ratings agency
stated. (Reuters)
 EU Commission cuts Eurozone growth forecast, sees muted
inflation – The Eurozone economy is likely to grow slower than
earlier expected this year and next, the European Commission
forecast on Thursday, because of global trade conflicts,
geopolitical tensions and Brexit. The Commission cut its growth
forecast for the 19 countries that share the euro to 1.1% this year
from 1.2% it expected in July, and to 1.2% in 2020 and 2021 from
1.4%. The Commission forecast the Eurozone’s aggregate budget
deficit would rise from an historic low of 0.5% of GDP in 2018 to
0.8% this year, 0.9% in 2020 and 1.0% in 2021, unless policies
change. But pressure for higher fiscal stimulus is mainly on
Germany and the Netherlands, referred to as countries that have
fiscal space, because both have been running large budget
surpluses for years and both of which have low public debt.
Germany is to have a budget surplus of 1.2% of GDP this year and
0.6% in 2020, while the Netherlands is to have a surplus of 1.5%
this year and 0.5% next year. Despite the slower GDP growth, the
Eurozone’s aggregate public debt-to-GDP ratio is to continue
declining for the fifth year in a row to 86.4% this year, 85.1% in
2020 and 84.1% in 2021. The Commission sees Eurozone
inflation, which the European Central Bank wants to keep below,
but close to 2% over the medium term, at 1.2% this year and
next, rising to 1.3% in 2021 — still well below the ECB’s target.
(Reuters)
 Scholz: German economic situation stable, growth to pick up
once trade tensions gone – Germany’s economic situation is
stable with employment at all time highs and economic growth
is likely to pick up in the coming years once global trade tensions
are resolved, German Finance Minister Olaf Scholz said on
Thursday. “Germany is in a stable economic situation, it is a very
competitive economy that is successful all over the globe,”
Scholz told reporters on entering a meeting of Eurozone finance
ministers in Brussels. “But there is slow growth in the world
economy today, it is mostly the result of trade tensions and
uncertainty. But if we get over this situation and if there is an
agreement between China and the United States on trade wewill
have more growth worldwide. This will help the European and
also the German economy,” he said. “We still have a very strong
economic situation, an all time high of employment, there are a
lot of industries looking for more labor ... so this is a stable
situation, we will have more growth in the next years and if the
trade tensions worldwide are reduced this will have a real impact
on better growth,” he said. (Reuters)
 Japan's Abe tells cabinet to compile stimulus package to support
economy – Japanese Prime Minister Shinzo Abe asked his
cabinet on Friday to compile a package of stimulus measures to
support the economy and build infrastructure to cope with large
natural disasters, the government’s top spokesman said. Chief
Cabinet Secretary Yoshihide Suga told reporters that the
package will include steps to promote investment for growth
through aggressive use of fiscal investment and loan programs.
The government will compile the package as soon as possible,
although the size of spending will depend on proposals to be
made by various ministries, Economy Minister Yasutoshi
Nishimura told a news conference after a regular cabinet
meeting. Japanese policymakers have been under pressure to
fend off heightening overseas risks with a diminishing tool-kit,
as the US-China trade war and soft global demand have hurt the
export-reliant economy. Finance Minister Taro Aso said the
planned economic package should help enhance productivity
and achieve strong growth to overcome the pressure caused by a
declining population, which he said was the “biggest problem”
Japan faces in the long run. (Reuters)
 Japan firms say October tax hike impact milder than 2014
increase – More than two-thirds of Japanese companies are
feeling less pain from a tax increase last month than from the
previous increase five years ago, which precipitated a recession,
a Reuters poll found. The results of the Reuters Corporate Survey
support the view of the government and Bank of Japan that the
economy looks likely to avoid a swoon in private consumption,
thanks to steps taken to offset how the tax increase would affect
Page 6 of 9
the public. Still, the overwhelming majority of Japanese
companies remain cautious about boosting spending, with many
planning to keep wages and hiring flat or even reduce them. The
survey offers the first corporate gauge of the impact of
increasing the national sales tax to 10% from 8%, a step Prime
Minister Shinzo Abe said was critical to curbing Japan’s
enormous public debt. He delayed it twice for fear it would
squeeze consumer spending. More than 70% of companies in the
Reuters poll said both the rush to buy ahead of the Oct. 1 increase
and the subsequent pullback have been milder than when sales
tax increased from 5% in April 2014. That tax hike dealt a blow
to private consumption, which makes up about 60% of the
economy. (Reuters)
 Japan September real wages rise for first time in nine months –
Japan’s inflation-adjusted real wages rose in September for the
first time in nine months, government data showed, offering a
glimmer of hope for a recovery in consumer spending - although
an October 1 sales tax hike and global slowdown cloud the
outlook. The data could support the view of the government and
the central bank that a tight labor market should push up wages,
stoking a virtuous cycle of household income gains and pick-up
in private consumption, which will in turn accelerate inflation.
More than six years of massive monetary stimulus by the Bank
of Japan has failed to accelerate inflation to its elusive 2% target,
as tepid wage growth and tame consumer spending have kept a
lid on prices despite the tightest job market in decades. Labor
ministry data out on Friday showed real wages, a key gauge of
households’ purchasing power, rose 0.6% in the year to
September, up for the first time since the end of last year, as
nominal wage growth outpaced consumer prices. Nominal total
cash earnings rose 0.8% in the year to September, up for the first
time in three months, it showed. (Reuters)
 China's Oct PPI falls 1.6% YoY, CPI rises to near eight-year high
– China’s factory gate prices fell 1.6% in October from a year
earlier, the steepest fall since July 2016, data from the National
Bureau of Statistics showed on Saturday, as manufacturing
continues to struggle with weak demand. Analysts had expected
factory gate prices to fall 1.5% YoY. The Producer Price Index
(PPI), seen as akey barometerof corporate profitability, fell 1.2%
YoY in September. The Consumer Price Index rose 3.8% in
October from a year earlier, the fastest pace seen since January
2012, beating analysts’ expectations of 3.3%. It rose 3% in
September. (Reuters)
 China's October exports fall, but less than expected as trade war
grinds on – China’s exports and imports contracted less than
expected in October, providing some relief for the economy as
Beijing tries to reach a partial trade deal with Washington. But
even if a US-China trade deal is signed soon, economists say it is
unlikely to help boost exports and manufacturing for some time
yet and could still mean more stimulus is needed from Beijing to
avert a sharper downturn. China’s October exports fell for the
third straight month, down 0.9% from a year earlier, customs
data showed on Friday, less than a 3.9% fall forecast in a Reuters
poll and September’s 3.2% contraction. (Reuters)
Regional
 PwC: GCC capital markets to pick up in 4Q2019 after quiet
3Q2019 – GCC’s capital markets activity will pick up in 4Q2019,
following a subdued 3Q2019, according to a PwC study.
However, the debt market was active during the third quarter.
Steve Drake, PwC Middle East Capital Markets Partner, said,
“We anticipate the coming quarter to be significantly more
active with the recent announcement of Saudi Aramco's record-
breaking flotation on Tadwaul, along with many other
companies, which have expressed their intention to list in 2019.
Meanwhile Tadawul’s recent announcement that it will soon
allow listing of foreign companies on its exchange offers further
optimism and will further promote equity activity in the region.”
The study announced that even though all IPO activities in the
region have been limited to Saudi Arabia in 2019, it expects the
UAE market to pick up pace after multiple companies have
announced their intent to go public and initiated the groundwork
for a successful IPO. (Zawya)
 Middle Eastern airlines post 1.8% traffic increase in September,
says IATA – Middle Eastern airlines posted a 1.8% traffic
increase in September, which was a slowdown from a 2.9% rise
in August, according to IATA’s latest passenger traffic figures.
Capacity was up just 0.2%, with load factor climbing 1.2
percentage points to 75.2%. International traffic growth
continues to be affected by a mix of structural challengesin some
of the region’s large airlines, geopolitical risks and weaker
business confidence in some countries. Global passenger traffic
results for September showed that demand climbed 3.8%
compared to the same month last year, broadly unchanged from
August’s performance. Capacity increased by 3.3%, and load
factor climbed 0.4% percentage point to 81.9%, which was a
record for any September. (Gulf-Times.com)
 Saudi Aramco prospectus flags risks, gives few details on IPO
size – Saudi Aramco will sell 0.5% of its shares to individual retail
investors and the government will have a lockup period of a year
on further share sales after the initial public offering, its
prospectus stated on Saturday. The more than 600-page
prospectus did not include details of how much of the company
would be floated in total or of any commitments from anchor
investors. Sources have said the company could sell 1%-2% on
the Saudi stock market in what could be the world’s largest
listing. Offering for the shares will begin on November 17, the
prospectus stated. Among the risks highlighted in the
prospectus were the potential for terrorist attacks and the
potential for encountering antitrust legislation, as well as the
right of the Saudi government to decide maximum crude output
and direct Saudi Aramco to undertake projects outside its core
business. The prospectus stated the government will have a
statutory lockup period for disposing of any shares after the
listing for six months, and a contractual lockup period for 12
months. Saudi Aramco cannot list additional shares for a period
of six months after trading starts, and will also be restricted from
issuing additional shares for 12 months. (Reuters)
 Moody's maintains ‘Stable’ outlook for UAE banking system on
resilient credit profiles – Moody’s Investors Service (Moody’s)
maintained a ‘Stable’ outlook for the UAE’s banking system,
citing banks’ strong capital, stable funding and healthy liquidity
that balance weakening asset quality and softening
profitability. The ratings agency stated it expects the country’s
economic growth to remain stable at subdued levels and
forecasts overall real GDP growth at 1.7% in 2019 and 1.4% in
2020, compared with 1.7% in 2018. It forecast credit growth in
Page 7 of 9
2019 and 2020 at 4% compared to 4.3% in 2018. Moody’s stated,
“It expects solid profitability to support sector-wide tangible
common equity (TCE) at 14%-16% of risk weighted assets over
the next 12 to 18 months, from 14.4% at June 2019. Even under
our low probability, high stress scenario, the sector-wide TCE
ratio would remain adequate at 11.6%.” The ratings agency
noted that moderate oil prices will be sufficient to support the
revenues of government-related entities and corporates, which
will contribute to stable funding and liquidity conditions. It
stated profitability is expected to decline modestly, while loan
performance will weaken as subdued economic growth means
corporates will face lower business volumes and margin
compression, while personal borrowers see limited wage growth.
Moody’s also stated that the UAE’s government’s willingness
and capacity to support local banks if needed will remain high
over the next 12 to 18 months. (Zawya)
 Dubai airport passenger traffic falls 2.4% in third quarter – Dubai
International reported a 2.4% fall in third-quarter passenger
traffic. The airport stated it handled 23.2mn passengers in the
three months to September 30. That compares with roughly
22.6mn in the same period a year ago. In the first nine months of
this year, 64.5mn passengers traveled through the airport, 4.5%
fewer than the same period last year. Operator Dubai Airports
blamed the year-to-date decline on a 45-day closure of a runway
between May and April, and the global grounding of the Boeing
737 MAX jet since March. The amount of cargo handled fell 5.9%
in the third quarter to 636,575 tons, while the year-to-date figure
dropped 4.1% to 1.9mn tons. (Reuters)
 Dubai Islamic Bank hires banks for dollar sukuk – Dubai Islamic
Bank (DIB) has hired lenders to arrange meetings with investors
ahead of a potential issue of five-year Sukuk, or Islamic bonds,
denominated in US dollars, a document showed. The bank - the
United Arab Emirates’ largest Shari’ah-compliant lender - has
picked Bank ABC, Dubai Islamic Bank, Emirates NBD Capital,
First Abu Dhabi Bank, HSBC, Islamic Corporation for the
Development of the Private Sector, Maybank, Sharjah Islamic
Bank, Standard Chartered Bank and Warba Bank. Investor
meetings will take place in Hong Kong and London starting on
November 11. (Reuters)
 EIBANK's net profit narrows to AED0.3mn in 3Q2019 – Emirates
Investment Bank (EIBANK) recorded net profit of AED0.3mn in
3Q2019 as compared to AED5.1mn in 3Q2018. Net Interest and
Investment Income came in at AED15.1mn as compared to
AED21.3mn in 3Q2018. Operating profit came in at AED23.2mn
as compared to AED30.5mn in 3Q2018. EPS came in at AED0.40
in 3Q2019 as compared to AED7.22 in 3Q2018. Total assets stood
at AED3.2bn at the end of September 30, 2019 as compared to
AED4.0bn at the end of December 31, 2018. Net investments
stood at AED1.5bn (+2.6% YTD), while customers’ deposits
stood at AED1.7bn (-40.4% YTD) at the end of September 30,
2019. (DFM)
 ADIB posts 5.2% YoY rise in net profit to AED619.8mn in 3Q2019
– Abu Dhabi Islamic Bank (ADIB) recorded net profit of
AED619.8mn in 3Q2019, an increase of 5.2% YoY. Profit from
operations, before distribution to depositors rose 4.8% YoY to
AED817.6mn in 3Q2019. Total assets stood at AED124.3bn at the
end of September 30, 2019 as compared to AED125.2bn at the
end of December 31, 2018. Ijara Financing stood at AED45.5bn
(+0.9% YTD), while depositor's accounts stood at AED100.4bn
(almost remained flat YTD) at the end of September 30, 2019.
EPS came in at AED0.144 in 3Q2019 as compared to AED0.176 in
3Q2018. (ADX)
 Dana Gas’ collections increase 16.7% to $230mn in first nine
months of 2019 – Dana Gas announced that in the first nine
months of 2019 collections in Egypt, the UAE and from its share
of Pearl Petroleum Company Limited’s sales in the Kurdistan
Region of Iraq (KRI), increased 16.7% YoY to $230mn. Dana Gas,
which owns a 35% stake in Pearl Petroleum, saw its share of
sales of condensate, LPG and gas in the KRI jump 52% to $118mn
in the nine-month period from $77mn in the same period the
previous year. Dana Gas received cash dividends of $68.3mn
from Pearl Petroleum over this period. Meanwhile, the
collections from Dana Gas Egypt were $105mn during the period,
in line with the $111mn received in the same period of 2018
whilst collections from the company’s Zora gas field in the UAE
stood at $7.3mn. (ADX)
 ADX lists Aldar Investments $500mn Sukuk after issue draws
strong investor demand – The latest $500mn Sukuk issued by
Aldar Investment Properties (Aldar Investments), a 100%
owned subsidiary of Aldar Properties, was listed on the Abu
Dhabi Securities Exchange (ADX) on November 07, 2019. The
fixed-rate, US dollar-denominated Sukuk, with a tenor of 10
years, carries a coupon rate of 3.875%. The issue was six times
oversubscribed, with global investors accounting for 71% of the
total transaction allocation. Aldar Investments owns and
manages an AED20bn diversified portfolio of high-quality
income-generating residential, retail, commercial and
hospitality assets. (ADX)
 CFO: TAQA forecasts AED1.9bn capex for 2019 – Abu Dhabi
National Energy Company (TAQA) has forecast a capital
expenditure (capex) of AED1.9bn for full-year 2019, its Chief
Financial Officer (CFO), Mohammed Al Ahbabi said. The state-
owned oil explorer and power producer's capex for the first nine
months of this year was AED1.2bn. TAQA reported a third
quarter net loss attributable to shareholders of AED16mn
compared to a net profit of AED153mn a year-ago. (Zawya)
 KHCB post net loss of BHD5.4mn in 3Q2019 – Khaleeji
Commercial Bank (KHCB) recorded net loss of BHD5.4mn in
3Q2019 as compared to net profit of BHD0.3mn in 3Q2018. Total
income fell 15.5% YoY to BHD3.8mn in 3Q2018. Total assets
stood at BHD923.8mn at the end of September 30, 2019 as
compared to BHD850.9mn at the end of December 31, 2018.
Financing assets stood at BHD325.7mn (-0.6% YTD), while
placements from financial institutions stood at BHD163.8mn
(+3.4% YTD) at the end of September 30, 2019. Loss per share
came in at 5.753 fills in 3Q2019 as compared to earnings per
share 0.355 fills in 3Q2018. (Bahrain Bourse)
 CBK: Kuwait’s balance of payments records deficit in 2Q2019 –
Preliminary data of the State of Kuwait’s Balance of Payments
(BoP) for the second quarter of 2019 showed turning to deficit,
after recording surplus in the corresponding period in 2018,
according to the Central Bankof Kuwait (CBK). CBK data showed
that BoP deficit in 2Q2019 reached KD9.5mn, against a surplus
of KD961mn for the same period last year. It is worth noting that
in 1Q2019, the BoP recorded a KD234.6mn surplus. The balance
on goods showed a decline in surplus to KD3.02bn, down from
Page 8 of 9
KD3.79bn in the same period last year. Meanwhile, the
secondary income account rose by 15.7% to KD1.4bn, compared
with KD1.21bn in 2Q2019. Current account surplus has increased
by 11.8% to KD3.22bn, up from KD2.88bn in the same period a
year ago. (Zawya)
 Kuwait plans to increase oil exports to China – Kuwait plans to
increase crude oil exports to China to more than 600,000 barrels
per day (bpd) in 2020, state news agency KUNA reported on
Saturday, citing Kuwait Petroleum Corp’s Deputy Managing
Director for Global Marketing, Sheikh Khalid Al-Sabah. The
agency did not specify the current level of oil exports to China.
Kuwait’s crude production was 2.65mn bpd in October, according
to a Reuters survey. (Reuters)
 CEO: IPO of Kuwait stock exchange will be oversubscribed – The
Kuwait stock exchange’s IPO is progressing well and will close
next month oversubscribed, the bourse’s CEO said. “I am 100%
sure it will be covered many times,” Mohammad Al-Osaimi, the
CEO of Boursa Kuwait, said in an interview with Bloomberg
Television. The sale of half the exchange to local citizens began
last month and will end on December 1, with the offering price
set at 100 fils per share, or one-tenth of a dinar. The IPO follows
a 44% sale earlier this year to a consortium of domestic and
international investors. Al-Osaimi said local legislation does not
state the bourse must be Shari’ah-compliant, and that the
exchange operates with normal practices seen in other markets.
He expects the stock to start trading around June. The exchange
has made all the changes necessary for index compiler MSCI Inc
to upgrade it to emerging-market status in June, as required by
the New York-based company earlier this year, he said. That
should lead to as much as $3bn in passive inflows to the country,
he estimated. (Gulf-Times.com)
Contacts
Saugata Sarkar, CFA, CAIA Shahan Keushgerian Zaid al-Nafoosi, CMT, CFTe
Head of Research Senior Research Analyst Senior Research Analyst
Tel: (+974) 4476 6534 Tel: (+974) 4476 6509 Tel: (+974) 4476 6535
saugata.sarkar@qnbfs.com.qa shahan.keushgerian@qnbfs.com.qa zaid.alnafoosi@qnbfs.com.qa
Mehmet Aksoy, PhD QNB Financial Services Co. W.L.L.
Senior Research Analyst Contact Center: (+974) 4476 6666
Tel: (+974) 4476 6589 PO Box 24025
mehmet.aksoy@qnbfs.com.qa Doha, Qatar
Disclaimer and Copyright Notice: This publication has been prepared by QNB Financial Services Co. W.L.L. (“QNB FS”) a wholly-owned subsidiary of Qatar National Bank (Q.P.S.C.). QNB FS is
regulated by the Qatar Financial Markets Authority and the Qatar Exchange. Qatar National Bank (Q.P.S.C.) is regulated by the Qatar Central Bank. This publication expresses the views and
opinions of QNB FS at a given time only. It is not an offer, promotion or recommendation to buy or sell securities or other investments, nor is it intended to constitute legal, tax, accounting, or
financial advice. QNB FS accepts no liability whatsoever for any direct or indirect losses arising from use of this report. Any investment decision should depend on the individual circumstances of
the investor and be based on specifically engaged investment advice. We therefore strongly advise potential investors to seek independent professional advice before making any investment
decision. Although the information in this report has been obtained from sources that QNB FS believes to be reliable, we have not independently verified such information and it may not be accurate
or complete. QNB FS does not make any representations or warranties as to the accuracy and completeness of the information it may contain, and declines any liability in that respect. For reports
dealing with Technical Analysis, expressed opinions and/or recommendations may be different or contrary to the opinions/recommendations of QNB FS Fundamental Research as a result of
depending solely on the historical technical data (price and volume). QNB FS reserves the right to amend the views and opinions expressed in this publication at any time. It may also express
viewpoints or make investment decisions that differ significantly from, or even contradict, the views and opinions included in this report. This report may not be reproduced in whole or in part
without permission from QNB FS.
COPYRIGHT: No part of this document may be reproduced without the explicit written permission of QNB FS.
Page 9 of 9
Rebased Performance Daily Index Performance
Source: Bloomberg Source: Bloomberg
Source: Bloomberg Source: Bloomberg (*$ adjusted returns)
60.0
80.0
100.0
120.0
140.0
Oct-15 Oct-16 Oct-17 Oct-18 Oct-19
QSE Index S&P Pan Arab S&P GCC
0.6%
(0.1%)
0.3%
0.1%
0.3%
(0.2%)
0.4%
(0.5%)
0.0%
0.5%
1.0%
SaudiArabia
Qatar
Kuwait
Bahrain
Oman
AbuDhabi
Dubai
Asset/Currency Performance Close ($) 1D% WTD% YTD% Global Indices Performance Close 1D%* WTD%* YTD%*
Gold/Ounce 1,458.92 (0.7) (3.7) 13.8 MSCI World Index 2,268.83 0.1 0.7 20.4
Silver/Ounce 16.79 (1.8) (7.3) 8.4 DJ Industrial 27,681.24 0.0 1.2 18.7
Crude Oil (Brent)/Barrel (FM Future) 62.51 0.4 1.3 16.2 S&P 500 3,093.08 0.3 0.9 23.4
Crude Oil (WTI)/Barrel (FM Future) 57.24 0.2 1.9 26.1 NASDAQ 100 8,475.31 0.5 1.1 27.7
Natural Gas (Henry Hub)/MMBtu 2.87 0.3 13.0 (10.0) STOXX 600 405.42 (0.5) 0.2 15.5
LPG Propane (Arab Gulf)/Ton 51.88 1.0 0.2 (18.3) DAX 13,228.56 (0.6) 0.8 20.7
LPG Butane (Arab Gulf)/Ton 68.50 3.4 1.7 (2.1) FTSE 100 7,359.38 (1.0) (0.5) 9.6
Euro 1.10 (0.3) (1.3) (3.9) CAC 40 5,889.70 (0.2) 0.9 19.8
Yen 109.26 (0.0) 1.0 (0.4) Nikkei 23,391.87 0.5 1.5 18.2
GBP 1.28 (0.3) (1.3) 0.2 MSCI EM 1,064.85 (0.8) 1.5 10.3
CHF 1.00 (0.2) (1.2) (1.6) SHANGHAI SE Composite 2,964.19 (0.7) 0.8 16.9
AUD 0.69 (0.5) (0.6) (2.6) HANG SENG 27,651.14 (0.7) 2.2 7.1
USD Index 98.35 0.2 1.1 2.3 BSE SENSEX 40,323.61 (1.3) (0.7) 9.3
RUB 63.81 0.5 0.4 (8.5) Bovespa 107,629.00 (3.2) (4.6) 14.3
BRL 0.24 (1.5) (4.1) (6.8) RTS 1,468.17 (1.3) 0.9 37.4
110.3
105.9
89.7

More Related Content

What's hot

13 August Daily market report
13 August Daily market report 13 August Daily market report
13 August Daily market report QNB Group
 
QNBFS Daily Market Report August 11, 2020
QNBFS Daily Market Report August 11, 2020QNBFS Daily Market Report August 11, 2020
QNBFS Daily Market Report August 11, 2020QNB Group
 
20 May Daily market report
20 May Daily market report 20 May Daily market report
20 May Daily market report QNB Group
 
QNBFS Daily Market Report July 15, 2018
QNBFS Daily Market Report July 15, 2018QNBFS Daily Market Report July 15, 2018
QNBFS Daily Market Report July 15, 2018QNB Group
 
QNBFS Daily Market Report August 16, 2021
QNBFS Daily Market Report August 16, 2021QNBFS Daily Market Report August 16, 2021
QNBFS Daily Market Report August 16, 2021QNB Group
 
QNBFS Daily Market Report October 19, 2021
QNBFS Daily Market Report October 19, 2021QNBFS Daily Market Report October 19, 2021
QNBFS Daily Market Report October 19, 2021QNB Group
 
QNBFS Daily Market Report May 03, 2020
QNBFS Daily Market Report May 03, 2020QNBFS Daily Market Report May 03, 2020
QNBFS Daily Market Report May 03, 2020QNB Group
 
QNBFS Daily Market Report October 27, 2021
QNBFS Daily Market Report October 27, 2021QNBFS Daily Market Report October 27, 2021
QNBFS Daily Market Report October 27, 2021QNB Group
 
QNBFS Daily Market Report August 23, 2020
QNBFS Daily Market Report August 23, 2020QNBFS Daily Market Report August 23, 2020
QNBFS Daily Market Report August 23, 2020QNB Group
 
QNBFS Daily Market Report October 20, 2021
QNBFS Daily Market Report October 20, 2021QNBFS Daily Market Report October 20, 2021
QNBFS Daily Market Report October 20, 2021QNB Group
 
QNBFS Daily Market Report July 12, 2020
QNBFS Daily Market Report July 12, 2020QNBFS Daily Market Report July 12, 2020
QNBFS Daily Market Report July 12, 2020QNB Group
 
QNBFS Daily Market Report April 20, 2021
QNBFS Daily Market Report April 20, 2021QNBFS Daily Market Report April 20, 2021
QNBFS Daily Market Report April 20, 2021QNB Group
 
QNBFS Daily Market Report October 31, 2021
QNBFS Daily Market Report October 31, 2021QNBFS Daily Market Report October 31, 2021
QNBFS Daily Market Report October 31, 2021QNB Group
 
27 May Daily market report
27 May Daily market report27 May Daily market report
27 May Daily market reportQNB Group
 
13 May Daily market report
13 May Daily market report 13 May Daily market report
13 May Daily market report QNB Group
 
QNBFS Daily Market Report May 12, 2019
QNBFS Daily Market Report May 12, 2019QNBFS Daily Market Report May 12, 2019
QNBFS Daily Market Report May 12, 2019QNB Group
 
14 April Daily market report
14 April Daily market report 14 April Daily market report
14 April Daily market report QNB Group
 
QNBFS Daily Market Report April 25, 2018
QNBFS Daily Market Report April 25, 2018QNBFS Daily Market Report April 25, 2018
QNBFS Daily Market Report April 25, 2018QNB Group
 
24 July Technical Market Report
24 July Technical Market Report24 July Technical Market Report
24 July Technical Market ReportQNB Group
 
1 July Daily market report
1 July Daily market report 1 July Daily market report
1 July Daily market report QNB Group
 

What's hot (20)

13 August Daily market report
13 August Daily market report 13 August Daily market report
13 August Daily market report
 
QNBFS Daily Market Report August 11, 2020
QNBFS Daily Market Report August 11, 2020QNBFS Daily Market Report August 11, 2020
QNBFS Daily Market Report August 11, 2020
 
20 May Daily market report
20 May Daily market report 20 May Daily market report
20 May Daily market report
 
QNBFS Daily Market Report July 15, 2018
QNBFS Daily Market Report July 15, 2018QNBFS Daily Market Report July 15, 2018
QNBFS Daily Market Report July 15, 2018
 
QNBFS Daily Market Report August 16, 2021
QNBFS Daily Market Report August 16, 2021QNBFS Daily Market Report August 16, 2021
QNBFS Daily Market Report August 16, 2021
 
QNBFS Daily Market Report October 19, 2021
QNBFS Daily Market Report October 19, 2021QNBFS Daily Market Report October 19, 2021
QNBFS Daily Market Report October 19, 2021
 
QNBFS Daily Market Report May 03, 2020
QNBFS Daily Market Report May 03, 2020QNBFS Daily Market Report May 03, 2020
QNBFS Daily Market Report May 03, 2020
 
QNBFS Daily Market Report October 27, 2021
QNBFS Daily Market Report October 27, 2021QNBFS Daily Market Report October 27, 2021
QNBFS Daily Market Report October 27, 2021
 
QNBFS Daily Market Report August 23, 2020
QNBFS Daily Market Report August 23, 2020QNBFS Daily Market Report August 23, 2020
QNBFS Daily Market Report August 23, 2020
 
QNBFS Daily Market Report October 20, 2021
QNBFS Daily Market Report October 20, 2021QNBFS Daily Market Report October 20, 2021
QNBFS Daily Market Report October 20, 2021
 
QNBFS Daily Market Report July 12, 2020
QNBFS Daily Market Report July 12, 2020QNBFS Daily Market Report July 12, 2020
QNBFS Daily Market Report July 12, 2020
 
QNBFS Daily Market Report April 20, 2021
QNBFS Daily Market Report April 20, 2021QNBFS Daily Market Report April 20, 2021
QNBFS Daily Market Report April 20, 2021
 
QNBFS Daily Market Report October 31, 2021
QNBFS Daily Market Report October 31, 2021QNBFS Daily Market Report October 31, 2021
QNBFS Daily Market Report October 31, 2021
 
27 May Daily market report
27 May Daily market report27 May Daily market report
27 May Daily market report
 
13 May Daily market report
13 May Daily market report 13 May Daily market report
13 May Daily market report
 
QNBFS Daily Market Report May 12, 2019
QNBFS Daily Market Report May 12, 2019QNBFS Daily Market Report May 12, 2019
QNBFS Daily Market Report May 12, 2019
 
14 April Daily market report
14 April Daily market report 14 April Daily market report
14 April Daily market report
 
QNBFS Daily Market Report April 25, 2018
QNBFS Daily Market Report April 25, 2018QNBFS Daily Market Report April 25, 2018
QNBFS Daily Market Report April 25, 2018
 
24 July Technical Market Report
24 July Technical Market Report24 July Technical Market Report
24 July Technical Market Report
 
1 July Daily market report
1 July Daily market report 1 July Daily market report
1 July Daily market report
 

Similar to QSE INTRA-DAY MOVEMENT

QNBFS Daily Market Report November 03, 2019
QNBFS Daily Market Report November 03, 2019QNBFS Daily Market Report November 03, 2019
QNBFS Daily Market Report November 03, 2019QNB Group
 
QNBFS Daily Market Report November 16, 2021
QNBFS Daily Market Report November 16, 2021QNBFS Daily Market Report November 16, 2021
QNBFS Daily Market Report November 16, 2021QNB Group
 
14 October Daily market report
14 October Daily market report14 October Daily market report
14 October Daily market reportQNB Group
 
QNBFS Daily Market Report March 4, 2019
QNBFS Daily Market Report March 4, 2019QNBFS Daily Market Report March 4, 2019
QNBFS Daily Market Report March 4, 2019QNB Group
 
QNBFS Daily Market Report November 07, 2021
QNBFS Daily Market Report November 07, 2021QNBFS Daily Market Report November 07, 2021
QNBFS Daily Market Report November 07, 2021QNB Group
 
27 July Daily market report
27 July Daily market report27 July Daily market report
27 July Daily market reportQNB Group
 
QNBFS Daily Market Report January 22, 2019
QNBFS Daily Market Report January 22, 2019QNBFS Daily Market Report January 22, 2019
QNBFS Daily Market Report January 22, 2019QNB Group
 
QNBFS Daily Market Report November 11, 2018
QNBFS Daily Market Report November 11, 2018QNBFS Daily Market Report November 11, 2018
QNBFS Daily Market Report November 11, 2018QNB Group
 
QNBFS Daily Market Report April 22, 2020
QNBFS Daily Market Report April 22, 2020QNBFS Daily Market Report April 22, 2020
QNBFS Daily Market Report April 22, 2020QNB Group
 
QNBFS Daily Market Report April 12, 2018
QNBFS Daily Market Report April 12, 2018QNBFS Daily Market Report April 12, 2018
QNBFS Daily Market Report April 12, 2018QNB Group
 
QNBFS Daily Market Report February 12, 2020
QNBFS Daily Market Report February 12, 2020QNBFS Daily Market Report February 12, 2020
QNBFS Daily Market Report February 12, 2020QNB Group
 
QNBFS Daily Market Report April 28, 2019
QNBFS Daily Market Report April 28, 2019QNBFS Daily Market Report April 28, 2019
QNBFS Daily Market Report April 28, 2019QNB Group
 
QNBFS Daily Market Report October 14, 2021
QNBFS Daily Market Report October 14, 2021QNBFS Daily Market Report October 14, 2021
QNBFS Daily Market Report October 14, 2021QNB Group
 
QNBFS Daily Market Report April 19, 2022
QNBFS Daily Market Report April 19, 2022QNBFS Daily Market Report April 19, 2022
QNBFS Daily Market Report April 19, 2022QNB Group
 
QNBFS Daily Market Report May 09, 2018
QNBFS Daily Market Report May 09, 2018 QNBFS Daily Market Report May 09, 2018
QNBFS Daily Market Report May 09, 2018 QNB Group
 
QNBFS Daily Market Report April 30, 2019
QNBFS Daily Market Report April 30, 2019QNBFS Daily Market Report April 30, 2019
QNBFS Daily Market Report April 30, 2019QNB Group
 
QNBFS Daily Market Report July 21, 2020
QNBFS Daily Market Report July 21, 2020QNBFS Daily Market Report July 21, 2020
QNBFS Daily Market Report July 21, 2020QNB Group
 
Daily Market Report April 14, 2016
Daily Market Report April 14, 2016Daily Market Report April 14, 2016
Daily Market Report April 14, 2016QNB Group
 
QNBFS Daily Market Report November 11, 2021
QNBFS Daily Market Report November 11, 2021QNBFS Daily Market Report November 11, 2021
QNBFS Daily Market Report November 11, 2021QNB Group
 
QNBFS Daily Market Report December 05, 2021
QNBFS Daily Market Report December 05, 2021QNBFS Daily Market Report December 05, 2021
QNBFS Daily Market Report December 05, 2021QNB Group
 

Similar to QSE INTRA-DAY MOVEMENT (20)

QNBFS Daily Market Report November 03, 2019
QNBFS Daily Market Report November 03, 2019QNBFS Daily Market Report November 03, 2019
QNBFS Daily Market Report November 03, 2019
 
QNBFS Daily Market Report November 16, 2021
QNBFS Daily Market Report November 16, 2021QNBFS Daily Market Report November 16, 2021
QNBFS Daily Market Report November 16, 2021
 
14 October Daily market report
14 October Daily market report14 October Daily market report
14 October Daily market report
 
QNBFS Daily Market Report March 4, 2019
QNBFS Daily Market Report March 4, 2019QNBFS Daily Market Report March 4, 2019
QNBFS Daily Market Report March 4, 2019
 
QNBFS Daily Market Report November 07, 2021
QNBFS Daily Market Report November 07, 2021QNBFS Daily Market Report November 07, 2021
QNBFS Daily Market Report November 07, 2021
 
27 July Daily market report
27 July Daily market report27 July Daily market report
27 July Daily market report
 
QNBFS Daily Market Report January 22, 2019
QNBFS Daily Market Report January 22, 2019QNBFS Daily Market Report January 22, 2019
QNBFS Daily Market Report January 22, 2019
 
QNBFS Daily Market Report November 11, 2018
QNBFS Daily Market Report November 11, 2018QNBFS Daily Market Report November 11, 2018
QNBFS Daily Market Report November 11, 2018
 
QNBFS Daily Market Report April 22, 2020
QNBFS Daily Market Report April 22, 2020QNBFS Daily Market Report April 22, 2020
QNBFS Daily Market Report April 22, 2020
 
QNBFS Daily Market Report April 12, 2018
QNBFS Daily Market Report April 12, 2018QNBFS Daily Market Report April 12, 2018
QNBFS Daily Market Report April 12, 2018
 
QNBFS Daily Market Report February 12, 2020
QNBFS Daily Market Report February 12, 2020QNBFS Daily Market Report February 12, 2020
QNBFS Daily Market Report February 12, 2020
 
QNBFS Daily Market Report April 28, 2019
QNBFS Daily Market Report April 28, 2019QNBFS Daily Market Report April 28, 2019
QNBFS Daily Market Report April 28, 2019
 
QNBFS Daily Market Report October 14, 2021
QNBFS Daily Market Report October 14, 2021QNBFS Daily Market Report October 14, 2021
QNBFS Daily Market Report October 14, 2021
 
QNBFS Daily Market Report April 19, 2022
QNBFS Daily Market Report April 19, 2022QNBFS Daily Market Report April 19, 2022
QNBFS Daily Market Report April 19, 2022
 
QNBFS Daily Market Report May 09, 2018
QNBFS Daily Market Report May 09, 2018 QNBFS Daily Market Report May 09, 2018
QNBFS Daily Market Report May 09, 2018
 
QNBFS Daily Market Report April 30, 2019
QNBFS Daily Market Report April 30, 2019QNBFS Daily Market Report April 30, 2019
QNBFS Daily Market Report April 30, 2019
 
QNBFS Daily Market Report July 21, 2020
QNBFS Daily Market Report July 21, 2020QNBFS Daily Market Report July 21, 2020
QNBFS Daily Market Report July 21, 2020
 
Daily Market Report April 14, 2016
Daily Market Report April 14, 2016Daily Market Report April 14, 2016
Daily Market Report April 14, 2016
 
QNBFS Daily Market Report November 11, 2021
QNBFS Daily Market Report November 11, 2021QNBFS Daily Market Report November 11, 2021
QNBFS Daily Market Report November 11, 2021
 
QNBFS Daily Market Report December 05, 2021
QNBFS Daily Market Report December 05, 2021QNBFS Daily Market Report December 05, 2021
QNBFS Daily Market Report December 05, 2021
 

More from QNB Group

QNBFS Daily Market Report December 24, 2023
QNBFS Daily Market Report December 24, 2023QNBFS Daily Market Report December 24, 2023
QNBFS Daily Market Report December 24, 2023QNB Group
 
QNBFS Daily Market Report November 29, 2023
QNBFS Daily Market Report November 29, 2023QNBFS Daily Market Report November 29, 2023
QNBFS Daily Market Report November 29, 2023QNB Group
 
QNBFS Weekly Market Report November 23, 2023
QNBFS Weekly Market Report November 23, 2023QNBFS Weekly Market Report November 23, 2023
QNBFS Weekly Market Report November 23, 2023QNB Group
 
QNBFS Weekly Market Report November 16, 2023
QNBFS Weekly Market Report November 16, 2023QNBFS Weekly Market Report November 16, 2023
QNBFS Weekly Market Report November 16, 2023QNB Group
 
QNBFS Daily Technical Trader Qatar - November 14, 2023 التحليل الفني اليومي ل...
QNBFS Daily Technical Trader Qatar - November 14, 2023 التحليل الفني اليومي ل...QNBFS Daily Technical Trader Qatar - November 14, 2023 التحليل الفني اليومي ل...
QNBFS Daily Technical Trader Qatar - November 14, 2023 التحليل الفني اليومي ل...QNB Group
 
QNBFS Daily Technical Trader Qatar - November 06, 2023 التحليل الفني اليومي ل...
QNBFS Daily Technical Trader Qatar - November 06, 2023 التحليل الفني اليومي ل...QNBFS Daily Technical Trader Qatar - November 06, 2023 التحليل الفني اليومي ل...
QNBFS Daily Technical Trader Qatar - November 06, 2023 التحليل الفني اليومي ل...QNB Group
 
QNBFS Daily Market Report October 30, 2023
QNBFS Daily Market Report October 30, 2023QNBFS Daily Market Report October 30, 2023
QNBFS Daily Market Report October 30, 2023QNB Group
 
QNBFS Daily Technical Trader Qatar - October 25, 2023 التحليل الفني اليومي لب...
QNBFS Daily Technical Trader Qatar - October 25, 2023 التحليل الفني اليومي لب...QNBFS Daily Technical Trader Qatar - October 25, 2023 التحليل الفني اليومي لب...
QNBFS Daily Technical Trader Qatar - October 25, 2023 التحليل الفني اليومي لب...QNB Group
 
QNBFS Daily Technical Trader Qatar - October 10, 2023 التحليل الفني اليومي لب...
QNBFS Daily Technical Trader Qatar - October 10, 2023 التحليل الفني اليومي لب...QNBFS Daily Technical Trader Qatar - October 10, 2023 التحليل الفني اليومي لب...
QNBFS Daily Technical Trader Qatar - October 10, 2023 التحليل الفني اليومي لب...QNB Group
 
QNBFS Daily Technical Trader Qatar - October 11, 2023 التحليل الفني اليومي لب...
QNBFS Daily Technical Trader Qatar - October 11, 2023 التحليل الفني اليومي لب...QNBFS Daily Technical Trader Qatar - October 11, 2023 التحليل الفني اليومي لب...
QNBFS Daily Technical Trader Qatar - October 11, 2023 التحليل الفني اليومي لب...QNB Group
 
QNBFS Daily Technical Trader Qatar - October 10, 2023 التحليل الفني اليومي لب...
QNBFS Daily Technical Trader Qatar - October 10, 2023 التحليل الفني اليومي لب...QNBFS Daily Technical Trader Qatar - October 10, 2023 التحليل الفني اليومي لب...
QNBFS Daily Technical Trader Qatar - October 10, 2023 التحليل الفني اليومي لب...QNB Group
 
QNBFS Daily Market Report October 04, 2023
QNBFS Daily Market Report October 04, 2023QNBFS Daily Market Report October 04, 2023
QNBFS Daily Market Report October 04, 2023QNB Group
 
QNBFS Daily Technical Trader Qatar - October 04, 2023 التحليل الفني اليومي لب...
QNBFS Daily Technical Trader Qatar - October 04, 2023 التحليل الفني اليومي لب...QNBFS Daily Technical Trader Qatar - October 04, 2023 التحليل الفني اليومي لب...
QNBFS Daily Technical Trader Qatar - October 04, 2023 التحليل الفني اليومي لب...QNB Group
 
QNBFS Daily Technical Trader Qatar - September 28, 2023 التحليل الفني اليومي ...
QNBFS Daily Technical Trader Qatar - September 28, 2023 التحليل الفني اليومي ...QNBFS Daily Technical Trader Qatar - September 28, 2023 التحليل الفني اليومي ...
QNBFS Daily Technical Trader Qatar - September 28, 2023 التحليل الفني اليومي ...QNB Group
 
QNBFS Daily Market Report September 24, 2023
QNBFS Daily Market Report September 24, 2023QNBFS Daily Market Report September 24, 2023
QNBFS Daily Market Report September 24, 2023QNB Group
 
QNBFS Daily Technical Trader Qatar - September 24, 2023 التحليل الفني اليومي ...
QNBFS Daily Technical Trader Qatar - September 24, 2023 التحليل الفني اليومي ...QNBFS Daily Technical Trader Qatar - September 24, 2023 التحليل الفني اليومي ...
QNBFS Daily Technical Trader Qatar - September 24, 2023 التحليل الفني اليومي ...QNB Group
 
QNBFS Daily Technical Trader Qatar - September 19, 2023 التحليل الفني اليومي ...
QNBFS Daily Technical Trader Qatar - September 19, 2023 التحليل الفني اليومي ...QNBFS Daily Technical Trader Qatar - September 19, 2023 التحليل الفني اليومي ...
QNBFS Daily Technical Trader Qatar - September 19, 2023 التحليل الفني اليومي ...QNB Group
 
QNBFS Daily Market Report September 17, 2023
QNBFS Daily Market Report September 17, 2023QNBFS Daily Market Report September 17, 2023
QNBFS Daily Market Report September 17, 2023QNB Group
 
QNBFS Weekly Market Report September 07, 2023
QNBFS Weekly Market Report September 07, 2023QNBFS Weekly Market Report September 07, 2023
QNBFS Weekly Market Report September 07, 2023QNB Group
 
QNBFS Daily Technical Trader Qatar - September 07, 2023 التحليل الفني اليومي ...
QNBFS Daily Technical Trader Qatar - September 07, 2023 التحليل الفني اليومي ...QNBFS Daily Technical Trader Qatar - September 07, 2023 التحليل الفني اليومي ...
QNBFS Daily Technical Trader Qatar - September 07, 2023 التحليل الفني اليومي ...QNB Group
 

More from QNB Group (20)

QNBFS Daily Market Report December 24, 2023
QNBFS Daily Market Report December 24, 2023QNBFS Daily Market Report December 24, 2023
QNBFS Daily Market Report December 24, 2023
 
QNBFS Daily Market Report November 29, 2023
QNBFS Daily Market Report November 29, 2023QNBFS Daily Market Report November 29, 2023
QNBFS Daily Market Report November 29, 2023
 
QNBFS Weekly Market Report November 23, 2023
QNBFS Weekly Market Report November 23, 2023QNBFS Weekly Market Report November 23, 2023
QNBFS Weekly Market Report November 23, 2023
 
QNBFS Weekly Market Report November 16, 2023
QNBFS Weekly Market Report November 16, 2023QNBFS Weekly Market Report November 16, 2023
QNBFS Weekly Market Report November 16, 2023
 
QNBFS Daily Technical Trader Qatar - November 14, 2023 التحليل الفني اليومي ل...
QNBFS Daily Technical Trader Qatar - November 14, 2023 التحليل الفني اليومي ل...QNBFS Daily Technical Trader Qatar - November 14, 2023 التحليل الفني اليومي ل...
QNBFS Daily Technical Trader Qatar - November 14, 2023 التحليل الفني اليومي ل...
 
QNBFS Daily Technical Trader Qatar - November 06, 2023 التحليل الفني اليومي ل...
QNBFS Daily Technical Trader Qatar - November 06, 2023 التحليل الفني اليومي ل...QNBFS Daily Technical Trader Qatar - November 06, 2023 التحليل الفني اليومي ل...
QNBFS Daily Technical Trader Qatar - November 06, 2023 التحليل الفني اليومي ل...
 
QNBFS Daily Market Report October 30, 2023
QNBFS Daily Market Report October 30, 2023QNBFS Daily Market Report October 30, 2023
QNBFS Daily Market Report October 30, 2023
 
QNBFS Daily Technical Trader Qatar - October 25, 2023 التحليل الفني اليومي لب...
QNBFS Daily Technical Trader Qatar - October 25, 2023 التحليل الفني اليومي لب...QNBFS Daily Technical Trader Qatar - October 25, 2023 التحليل الفني اليومي لب...
QNBFS Daily Technical Trader Qatar - October 25, 2023 التحليل الفني اليومي لب...
 
QNBFS Daily Technical Trader Qatar - October 10, 2023 التحليل الفني اليومي لب...
QNBFS Daily Technical Trader Qatar - October 10, 2023 التحليل الفني اليومي لب...QNBFS Daily Technical Trader Qatar - October 10, 2023 التحليل الفني اليومي لب...
QNBFS Daily Technical Trader Qatar - October 10, 2023 التحليل الفني اليومي لب...
 
QNBFS Daily Technical Trader Qatar - October 11, 2023 التحليل الفني اليومي لب...
QNBFS Daily Technical Trader Qatar - October 11, 2023 التحليل الفني اليومي لب...QNBFS Daily Technical Trader Qatar - October 11, 2023 التحليل الفني اليومي لب...
QNBFS Daily Technical Trader Qatar - October 11, 2023 التحليل الفني اليومي لب...
 
QNBFS Daily Technical Trader Qatar - October 10, 2023 التحليل الفني اليومي لب...
QNBFS Daily Technical Trader Qatar - October 10, 2023 التحليل الفني اليومي لب...QNBFS Daily Technical Trader Qatar - October 10, 2023 التحليل الفني اليومي لب...
QNBFS Daily Technical Trader Qatar - October 10, 2023 التحليل الفني اليومي لب...
 
QNBFS Daily Market Report October 04, 2023
QNBFS Daily Market Report October 04, 2023QNBFS Daily Market Report October 04, 2023
QNBFS Daily Market Report October 04, 2023
 
QNBFS Daily Technical Trader Qatar - October 04, 2023 التحليل الفني اليومي لب...
QNBFS Daily Technical Trader Qatar - October 04, 2023 التحليل الفني اليومي لب...QNBFS Daily Technical Trader Qatar - October 04, 2023 التحليل الفني اليومي لب...
QNBFS Daily Technical Trader Qatar - October 04, 2023 التحليل الفني اليومي لب...
 
QNBFS Daily Technical Trader Qatar - September 28, 2023 التحليل الفني اليومي ...
QNBFS Daily Technical Trader Qatar - September 28, 2023 التحليل الفني اليومي ...QNBFS Daily Technical Trader Qatar - September 28, 2023 التحليل الفني اليومي ...
QNBFS Daily Technical Trader Qatar - September 28, 2023 التحليل الفني اليومي ...
 
QNBFS Daily Market Report September 24, 2023
QNBFS Daily Market Report September 24, 2023QNBFS Daily Market Report September 24, 2023
QNBFS Daily Market Report September 24, 2023
 
QNBFS Daily Technical Trader Qatar - September 24, 2023 التحليل الفني اليومي ...
QNBFS Daily Technical Trader Qatar - September 24, 2023 التحليل الفني اليومي ...QNBFS Daily Technical Trader Qatar - September 24, 2023 التحليل الفني اليومي ...
QNBFS Daily Technical Trader Qatar - September 24, 2023 التحليل الفني اليومي ...
 
QNBFS Daily Technical Trader Qatar - September 19, 2023 التحليل الفني اليومي ...
QNBFS Daily Technical Trader Qatar - September 19, 2023 التحليل الفني اليومي ...QNBFS Daily Technical Trader Qatar - September 19, 2023 التحليل الفني اليومي ...
QNBFS Daily Technical Trader Qatar - September 19, 2023 التحليل الفني اليومي ...
 
QNBFS Daily Market Report September 17, 2023
QNBFS Daily Market Report September 17, 2023QNBFS Daily Market Report September 17, 2023
QNBFS Daily Market Report September 17, 2023
 
QNBFS Weekly Market Report September 07, 2023
QNBFS Weekly Market Report September 07, 2023QNBFS Weekly Market Report September 07, 2023
QNBFS Weekly Market Report September 07, 2023
 
QNBFS Daily Technical Trader Qatar - September 07, 2023 التحليل الفني اليومي ...
QNBFS Daily Technical Trader Qatar - September 07, 2023 التحليل الفني اليومي ...QNBFS Daily Technical Trader Qatar - September 07, 2023 التحليل الفني اليومي ...
QNBFS Daily Technical Trader Qatar - September 07, 2023 التحليل الفني اليومي ...
 

Recently uploaded

Russian Call Girls In Gtb Nagar (Delhi) 9711199012 💋✔💕😘 Naughty Call Girls Se...
Russian Call Girls In Gtb Nagar (Delhi) 9711199012 💋✔💕😘 Naughty Call Girls Se...Russian Call Girls In Gtb Nagar (Delhi) 9711199012 💋✔💕😘 Naughty Call Girls Se...
Russian Call Girls In Gtb Nagar (Delhi) 9711199012 💋✔💕😘 Naughty Call Girls Se...shivangimorya083
 
VIP High Class Call Girls Saharanpur Anushka 8250192130 Independent Escort Se...
VIP High Class Call Girls Saharanpur Anushka 8250192130 Independent Escort Se...VIP High Class Call Girls Saharanpur Anushka 8250192130 Independent Escort Se...
VIP High Class Call Girls Saharanpur Anushka 8250192130 Independent Escort Se...Suhani Kapoor
 
SBP-Market-Operations and market managment
SBP-Market-Operations and market managmentSBP-Market-Operations and market managment
SBP-Market-Operations and market managmentfactical
 
fca-bsps-decision-letter-redacted (1).pdf
fca-bsps-decision-letter-redacted (1).pdffca-bsps-decision-letter-redacted (1).pdf
fca-bsps-decision-letter-redacted (1).pdfHenry Tapper
 
BPPG response - Options for Defined Benefit schemes - 19Apr24.pdf
BPPG response - Options for Defined Benefit schemes - 19Apr24.pdfBPPG response - Options for Defined Benefit schemes - 19Apr24.pdf
BPPG response - Options for Defined Benefit schemes - 19Apr24.pdfHenry Tapper
 
The Triple Threat | Article on Global Resession | Harsh Kumar
The Triple Threat | Article on Global Resession | Harsh KumarThe Triple Threat | Article on Global Resession | Harsh Kumar
The Triple Threat | Article on Global Resession | Harsh KumarHarsh Kumar
 
20240417-Calibre-April-2024-Investor-Presentation.pdf
20240417-Calibre-April-2024-Investor-Presentation.pdf20240417-Calibre-April-2024-Investor-Presentation.pdf
20240417-Calibre-April-2024-Investor-Presentation.pdfAdnet Communications
 
Financial Leverage Definition, Advantages, and Disadvantages
Financial Leverage Definition, Advantages, and DisadvantagesFinancial Leverage Definition, Advantages, and Disadvantages
Financial Leverage Definition, Advantages, and Disadvantagesjayjaymabutot13
 
Mulki Call Girls 7001305949 WhatsApp Number 24x7 Best Services
Mulki Call Girls 7001305949 WhatsApp Number 24x7 Best ServicesMulki Call Girls 7001305949 WhatsApp Number 24x7 Best Services
Mulki Call Girls 7001305949 WhatsApp Number 24x7 Best Servicesnajka9823
 
Independent Lucknow Call Girls 8923113531WhatsApp Lucknow Call Girls make you...
Independent Lucknow Call Girls 8923113531WhatsApp Lucknow Call Girls make you...Independent Lucknow Call Girls 8923113531WhatsApp Lucknow Call Girls make you...
Independent Lucknow Call Girls 8923113531WhatsApp Lucknow Call Girls make you...makika9823
 
Log your LOA pain with Pension Lab's brilliant campaign
Log your LOA pain with Pension Lab's brilliant campaignLog your LOA pain with Pension Lab's brilliant campaign
Log your LOA pain with Pension Lab's brilliant campaignHenry Tapper
 
Instant Issue Debit Cards - High School Spirit
Instant Issue Debit Cards - High School SpiritInstant Issue Debit Cards - High School Spirit
Instant Issue Debit Cards - High School Spiritegoetzinger
 
Lundin Gold April 2024 Corporate Presentation v4.pdf
Lundin Gold April 2024 Corporate Presentation v4.pdfLundin Gold April 2024 Corporate Presentation v4.pdf
Lundin Gold April 2024 Corporate Presentation v4.pdfAdnet Communications
 
Andheri Call Girls In 9825968104 Mumbai Hot Models
Andheri Call Girls In 9825968104 Mumbai Hot ModelsAndheri Call Girls In 9825968104 Mumbai Hot Models
Andheri Call Girls In 9825968104 Mumbai Hot Modelshematsharma006
 
Stock Market Brief Deck for 4/24/24 .pdf
Stock Market Brief Deck for 4/24/24 .pdfStock Market Brief Deck for 4/24/24 .pdf
Stock Market Brief Deck for 4/24/24 .pdfMichael Silva
 
Bladex 1Q24 Earning Results Presentation
Bladex 1Q24 Earning Results PresentationBladex 1Q24 Earning Results Presentation
Bladex 1Q24 Earning Results PresentationBladex
 
How Automation is Driving Efficiency Through the Last Mile of Reporting
How Automation is Driving Efficiency Through the Last Mile of ReportingHow Automation is Driving Efficiency Through the Last Mile of Reporting
How Automation is Driving Efficiency Through the Last Mile of ReportingAggregage
 
AfRESFullPaper22018EmpiricalPerformanceofRealEstateInvestmentTrustsandShareho...
AfRESFullPaper22018EmpiricalPerformanceofRealEstateInvestmentTrustsandShareho...AfRESFullPaper22018EmpiricalPerformanceofRealEstateInvestmentTrustsandShareho...
AfRESFullPaper22018EmpiricalPerformanceofRealEstateInvestmentTrustsandShareho...yordanosyohannes2
 

Recently uploaded (20)

Russian Call Girls In Gtb Nagar (Delhi) 9711199012 💋✔💕😘 Naughty Call Girls Se...
Russian Call Girls In Gtb Nagar (Delhi) 9711199012 💋✔💕😘 Naughty Call Girls Se...Russian Call Girls In Gtb Nagar (Delhi) 9711199012 💋✔💕😘 Naughty Call Girls Se...
Russian Call Girls In Gtb Nagar (Delhi) 9711199012 💋✔💕😘 Naughty Call Girls Se...
 
VIP High Class Call Girls Saharanpur Anushka 8250192130 Independent Escort Se...
VIP High Class Call Girls Saharanpur Anushka 8250192130 Independent Escort Se...VIP High Class Call Girls Saharanpur Anushka 8250192130 Independent Escort Se...
VIP High Class Call Girls Saharanpur Anushka 8250192130 Independent Escort Se...
 
🔝+919953056974 🔝young Delhi Escort service Pusa Road
🔝+919953056974 🔝young Delhi Escort service Pusa Road🔝+919953056974 🔝young Delhi Escort service Pusa Road
🔝+919953056974 🔝young Delhi Escort service Pusa Road
 
SBP-Market-Operations and market managment
SBP-Market-Operations and market managmentSBP-Market-Operations and market managment
SBP-Market-Operations and market managment
 
fca-bsps-decision-letter-redacted (1).pdf
fca-bsps-decision-letter-redacted (1).pdffca-bsps-decision-letter-redacted (1).pdf
fca-bsps-decision-letter-redacted (1).pdf
 
BPPG response - Options for Defined Benefit schemes - 19Apr24.pdf
BPPG response - Options for Defined Benefit schemes - 19Apr24.pdfBPPG response - Options for Defined Benefit schemes - 19Apr24.pdf
BPPG response - Options for Defined Benefit schemes - 19Apr24.pdf
 
The Triple Threat | Article on Global Resession | Harsh Kumar
The Triple Threat | Article on Global Resession | Harsh KumarThe Triple Threat | Article on Global Resession | Harsh Kumar
The Triple Threat | Article on Global Resession | Harsh Kumar
 
20240417-Calibre-April-2024-Investor-Presentation.pdf
20240417-Calibre-April-2024-Investor-Presentation.pdf20240417-Calibre-April-2024-Investor-Presentation.pdf
20240417-Calibre-April-2024-Investor-Presentation.pdf
 
Financial Leverage Definition, Advantages, and Disadvantages
Financial Leverage Definition, Advantages, and DisadvantagesFinancial Leverage Definition, Advantages, and Disadvantages
Financial Leverage Definition, Advantages, and Disadvantages
 
Mulki Call Girls 7001305949 WhatsApp Number 24x7 Best Services
Mulki Call Girls 7001305949 WhatsApp Number 24x7 Best ServicesMulki Call Girls 7001305949 WhatsApp Number 24x7 Best Services
Mulki Call Girls 7001305949 WhatsApp Number 24x7 Best Services
 
Independent Lucknow Call Girls 8923113531WhatsApp Lucknow Call Girls make you...
Independent Lucknow Call Girls 8923113531WhatsApp Lucknow Call Girls make you...Independent Lucknow Call Girls 8923113531WhatsApp Lucknow Call Girls make you...
Independent Lucknow Call Girls 8923113531WhatsApp Lucknow Call Girls make you...
 
Log your LOA pain with Pension Lab's brilliant campaign
Log your LOA pain with Pension Lab's brilliant campaignLog your LOA pain with Pension Lab's brilliant campaign
Log your LOA pain with Pension Lab's brilliant campaign
 
Instant Issue Debit Cards - High School Spirit
Instant Issue Debit Cards - High School SpiritInstant Issue Debit Cards - High School Spirit
Instant Issue Debit Cards - High School Spirit
 
Lundin Gold April 2024 Corporate Presentation v4.pdf
Lundin Gold April 2024 Corporate Presentation v4.pdfLundin Gold April 2024 Corporate Presentation v4.pdf
Lundin Gold April 2024 Corporate Presentation v4.pdf
 
Andheri Call Girls In 9825968104 Mumbai Hot Models
Andheri Call Girls In 9825968104 Mumbai Hot ModelsAndheri Call Girls In 9825968104 Mumbai Hot Models
Andheri Call Girls In 9825968104 Mumbai Hot Models
 
Stock Market Brief Deck for 4/24/24 .pdf
Stock Market Brief Deck for 4/24/24 .pdfStock Market Brief Deck for 4/24/24 .pdf
Stock Market Brief Deck for 4/24/24 .pdf
 
Bladex 1Q24 Earning Results Presentation
Bladex 1Q24 Earning Results PresentationBladex 1Q24 Earning Results Presentation
Bladex 1Q24 Earning Results Presentation
 
How Automation is Driving Efficiency Through the Last Mile of Reporting
How Automation is Driving Efficiency Through the Last Mile of ReportingHow Automation is Driving Efficiency Through the Last Mile of Reporting
How Automation is Driving Efficiency Through the Last Mile of Reporting
 
Commercial Bank Economic Capsule - April 2024
Commercial Bank Economic Capsule - April 2024Commercial Bank Economic Capsule - April 2024
Commercial Bank Economic Capsule - April 2024
 
AfRESFullPaper22018EmpiricalPerformanceofRealEstateInvestmentTrustsandShareho...
AfRESFullPaper22018EmpiricalPerformanceofRealEstateInvestmentTrustsandShareho...AfRESFullPaper22018EmpiricalPerformanceofRealEstateInvestmentTrustsandShareho...
AfRESFullPaper22018EmpiricalPerformanceofRealEstateInvestmentTrustsandShareho...
 

QSE INTRA-DAY MOVEMENT

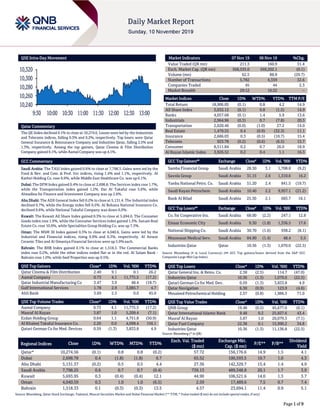
  • 1. Page 1 of 9 QSE Intra-Day Movement Qatar Commentary The QE Index declined 0.1% to close at 10,274.6. Losses were led by the Industrials and Telecoms indices, falling 0.3% and 0.2%, respectively. Top losers were Qatar General Insurance & Reinsurance Company and Industries Qatar, falling 2.5% and 1.3%, respectively. Among the top gainers, Qatar Cinema & Film Distribution Company gained 9.1%, while Aamal Company was up 4.1%. GCC Commentary Saudi Arabia: The TASI Index gained 0.6% to close at 7,798.3. Gains were led by the Food & Bev. and Com. & Prof. Svc indices, rising 1.4% and 1.1%, respectively. Al Kathiri Holding Co. rose 9.9%, while Middle East Healthcare Co. was up 6.1%. Dubai: The DFM Index gained 0.4% to close at 2,698.8. The Services index rose 1.7%, while the Transportation index gained 1.2%. Dar Al Takaful rose 5.6%, while Almadina for Finance and Investment Company was up 2.6%. Abu Dhabi: The ADX General Index fell 0.2% to close at 5,131.4. The Industrial index declined 0.7%, while the Energy index fell 0.5%. Al Buhaira National Insurance Co. declined 9.6%, while National Takaful Company was down 6.0%. Kuwait: The Kuwait All Share Index gained 0.3% to close at 5,694.0. The Consumer Goods index rose 1.9%, while the Consumer Services index gained 1.3%. Sanam Real Estate Co. rose 10.0%, while Specialities Group Holding Co. was up 7.3%. Oman: The MSM 30 Index gained 0.3% to close at 4,040.6. Gains were led by the Industrial and Financial indices, rising 0.9% and 0.3%, respectively. Al Anwar Ceramic Tiles and Al Omaniya Financial Services were up 5.9% each. Bahrain: The BHB Index gained 0.1% to close at 1,518.3. The Commercial Banks index rose 0.2%, while the other indices ended flat or in the red. Al Salam Bank - Bahrain rose 1.0%, while Seef Properties was up 0.5%. QSE Top Gainers Close* 1D% Vol. ‘000 YTD% Qatar Cinema & Film Distribution 2.40 9.1 0.1 26.2 Aamal Company 0.73 4.1 11,775.5 (17.2) Qatar Industrial Manufacturing Co 3.47 3.9 48.4 (18.7) Gulf International Services 1.78 2.9 3,085.7 4.7 Ahli Bank 3.69 2.5 0.0 45.0 QSE Top Volume Trades Close* 1D% Vol. ‘000 YTD% Aamal Company 0.73 4.1 11,775.5 (17.2) Masraf Al Rayan 3.87 1.0 5,209.4 (7.1) Ezdan Holding Group 0.64 1.1 4,751.8 (50.9) Al Khaleej Takaful Insurance Co. 2.20 0.0 4,098.4 156.1 Qatari German Co for Med. Devices 0.59 (1.3) 3,833.8 4.9 Market Indicators 07 Nov 19 06 Nov 19 %Chg. Value Traded (QR mn) 211.3 160.9 31.4 Exch. Market Cap. (QR mn) 568,535.0 569,202.1 (0.1) Volume (mn) 62.5 88.8 (29.7) Number of Transactions 5,782 4,359 32.6 Companies Traded 45 44 2.3 Market Breadth 29:12 16:22 – Market Indices Close 1D% WTD% YTD% TTM P/E Total Return 18,906.05 (0.1) 0.8 4.2 14.9 All Share Index 3,032.12 (0.1) 0.8 (1.5) 14.9 Banks 4,057.68 (0.1) 1.4 5.9 13.6 Industrials 2,964.96 (0.3) 0.7 (7.8) 20.3 Transportation 2,620.46 (0.0) (1.0) 27.2 14.0 Real Estate 1,479.55 0.4 (0.9) (32.3) 11.1 Insurance 2,686.03 0.3 (0.5) (10.7) 15.4 Telecoms 923.78 (0.2) (0.6) (6.5) 15.7 Consumer 8,511.84 0.2 0.7 26.0 18.9 Al Rayan Islamic Index 3,926.52 0.2 0.4 1.1 16.3 GCC Top Gainers## Exchange Close# 1D% Vol. ‘000 YTD% Samba Financial Group Saudi Arabia 28.50 3.1 1,708.8 (9.2) Savola Group Saudi Arabia 31.15 2.6 1,310.6 16.2 Yanbu National Petro. Co. Saudi Arabia 51.20 2.4 841.5 (19.7) Saudi Kayan Petrochem. Saudi Arabia 10.40 2.2 9,957.1 (21.2) Bank Al Bilad Saudi Arabia 25.30 2.1 683.7 16.1 GCC Top Losers## Exchange Close# 1D% Vol. ‘000 YTD% Co. for Cooperative Ins. Saudi Arabia 68.00 (2.2) 247.1 12.8 Emaar Economic City Saudi Arabia 9.30 (1.8) 1,336.5 17.6 National Shipping Co. Saudi Arabia 30.70 (1.6) 938.2 (8.1) Mouwasat Medical Serv. Saudi Arabia 84.90 (1.4) 48.4 5.5 Industries Qatar Qatar 10.36 (1.3) 1,070.0 (22.5) Source: Bloomberg (# in Local Currency) (## GCC Top gainers/losers derived from the S&P GCC Composite Large Mid Cap Index) QSE Top Losers Close* 1D% Vol. ‘000 YTD% Qatar General Ins. & Reins. Co. 2.38 (2.5) 114.7 (47.0) Industries Qatar 10.36 (1.3) 1,070.0 (22.5) Qatari German Co for Med. Dev. 0.59 (1.3) 3,833.8 4.9 Qatar Navigation 6.30 (0.9) 123.9 (4.6) Mesaieed Petrochemical Holding 2.57 (0.8) 1,986.5 71.0 QSE Top Value Trades Close* 1D% Val. ‘000 YTD% QNB Group 19.48 (0.5) 45,677.0 (0.1) Qatar International Islamic Bank 9.48 0.2 25,827.6 43.4 Masraf Al Rayan 3.87 1.0 20,079.3 (7.1) Qatar Fuel Company 22.38 0.1 15,990.2 34.8 Industries Qatar 10.36 (1.3) 11,136.8 (22.5) Source: Bloomberg (* in QR) Regional Indices Close 1D% WTD% MTD% YTD% Exch. Val. Traded ($ mn) Exchange Mkt. Cap. ($ mn) P/E** P/B** Dividend Yield Qatar* 10,274.56 (0.1) 0.8 0.8 (0.2) 57.72 156,176.6 14.9 1.5 4.1 Dubai 2,698.78 0.4 (1.8) (1.8) 6.7 65.52 100,593.5 10.7 1.0 4.3 Abu Dhabi 5,131.37 (0.2) 0.5 0.5 4.4 27.36 142,329.7 15.4 1.4 4.9 Saudi Arabia 7,798.25 0.6 0.7 0.7 (0.4) 739.13 489,348.8 20.1 1.7 3.9 Kuwait 5,693.95 0.3 (0.4) (0.4) 12.1 44.90 106,521.6 14.0 1.3 3.7 Oman 4,040.59 0.3 1.0 1.0 (6.5) 2.59 17,489.6 7.5 0.7 7.4 Bahrain 1,518.33 0.1 (0.3) (0.3) 13.5 4.57 23,694.1 11.4 0.9 5.1 Source: Bloomberg, Qatar Stock Exchange, Tadawul, Muscat Securities Market and Dubai Financial Market (** TTM; * Value traded ($ mn) do not include special trades, if any) 10,240 10,260 10,280 10,300 10,320 9:30 10:00 10:30 11:00 11:30 12:00 12:30 13:00
  • 2. Page 2 of 9 Qatar Market Commentary  The QE Index declined 0.1% to close at 10,274.6. The Industrials and Telecoms indices led the losses. The index fell on the back of selling pressure from Qatari and GCC shareholders despite buying support from non-Qatari shareholders.  Qatar General Insurance & Reinsurance Company and Industries Qatar were the top losers, falling 2.5% and 1.3%, respectively. Among the top gainers, Qatar Cinema & Film Distribution Company gained 9.1%, while Aamal Company was up 4.1%.  Volume of shares traded on Thursday fell by 29.7% to 62.5mn from 88.8mn on Wednesday. Further, as compared to the 30-day moving average of 78.0mn, volume for the day was 19.9% lower. Aamal Company and Masraf Al Rayan were the most active stocks, contributing 18.8% and 8.3% to the total volume, respectively. Source: Qatar Stock Exchange (* as a % of traded value) Ratings, Earnings Releases and Global Economic Data Ratings Updates Company Agency Market Type* Old Rating New Rating Rating Change Outlook Outlook Change Arabian Centres Co. Ltd Moody's Saudi Arabia LT-CFR – Ba1 – Stable – Source: News reports, Bloomberg (* LT – Long Term, CFR – Corp Family Rating) Earnings Releases Company Market Currency Revenue (mn) 3Q2019 % Change YoY Operating Profit (mn) 3Q2019 % Change YoY Net Profit (mn) 3Q2019 % Change YoY Al Alamiya for Cooperative Insurance Co. Saudi Arabia SR – – – – 2.6 31.8% Emaar The Economic City Saudi Arabia SR 163.0 45.5% (131.0) N/A (202.0) N/A Aseer Trading, Tourism & Manufacturing Co. Saudi Arabia SR 484.4 0.1% (4.2) N/A (32.1) N/A Takween Advanced Industries Co. Saudi Arabia SR 314.7 -15.1% (15.2) N/A (28.8) N/A Al Jouf Cement Co. Saudi Arabia SR 27.0 4.7% 2.5 N/A 1.1 N/A Jazan Energy And Development Co. Saudi Arabia SR 19.1 2.9% (0.5) N/A (1.3) N/A Tourism Enterprise Co. Saudi Arabia SR 4.0 7.4% (0.2) N/A (0.3) N/A National Medical Care Co. Saudi Arabia SR 173.5 -1.6% 23.0 30.8% 16.6 45.4% Wafrah For Industry And Development Co. Saudi Arabia SR 21.3 58.5% (1.8) N/A (1.8) N/A Alandalus Property Co. Saudi Arabia SR 42.7 5.5% 26.1 9.7% 14.6 15.6% Middle East Healthcare Co. Saudi Arabia SR 386.8 14.2% 33.3 56.5% 33.2 64.8% Ithmaar Holding Dubai AED 135.6 23.2% 74.0 17.9% 3.7 N/A Source: Company data, DFM, ADX, MSM, TASI, BHB. Global Economic Data Date Market Source Indicator Period Actual Consensus Previous 11/07 US Department of Labor Initial Jobless Claims 2-Nov 211k 215k 219k 11/07 US Department of Labor Continuing Claims 26-Oct 1,689k 1,682k 1,692k 11/07 US Federal Reserve Consumer Credit Sep $9.513bn $15.000bn $17.842bn 11/07 UK Bank of England Bank of England Bank Rate 7-Nov 0.75% 0.75% 0.75% 11/07 Germany Deutsche Bundesbank Industrial Production SA MoM Sep -0.60% -0.40% 0.40% 11/07 Germany Bundesministerium fur Wirtscha Industrial Production WDA YoY Sep -4.30% -4.40% -3.90% 11/07 Germany Markit Markit Germany Construction PMI Oct 51.5 – 50.1 11/08 Germany German Federal Statistical Office Trade Balance Sep 21.1bn 19.5bn 16.2bn 11/08 Germany German Federal Statistical Office Current Account Balance Sep 25.5bn 19.1bn 17.3bn 11/08 Germany Deutsche Bundesbank Exports SA MoM Sep 1.50% 0.30% -0.90% 11/08 Germany Deutsche Bundesbank Imports SA MoM Sep 1.30% 0.0% 0.10% Overall Activity Buy %* Sell %* Net (QR) Qatari Individuals 26.18% 26.36% (397,726.49) Qatari Institutions 16.22% 35.11% (39,914,238.29) Qatari 42.40% 61.47% (40,311,964.78) GCC Individuals 0.87% 3.31% (5,157,064.84) GCC Institutions 2.51% 4.83% (4,892,453.79) GCC 3.38% 8.14% (10,049,518.63) Non-Qatari Individuals 5.74% 7.53% (3,785,152.20) Non-Qatari Institutions 48.48% 22.86% 54,146,635.61 Non-Qatari 54.22% 30.39% 50,361,483.41
  • 3. Page 3 of 9 11/08 France Ministry of the Economy, Franc Trade Balance Sep -5,551mn -4,964mn -5,436mn Date Market Source Indicator Period Actual Consensus Previous 11/08 France Banque De France Current Account Balance Sep -2.7bn – -3.0bn 11/08 France French Labor Office Wages QoQ 3Q P 0.30% 0.40% 0.50% 11/08 France INSEE National Statistics Office Industrial Production MoM Sep 0.30% 0.40% -0.90% 11/08 France INSEE National Statistics Office Industrial Production YoY Sep 0.10% 0.30% -1.30% 11/08 France INSEE National Statistics Office Manufacturing Production MoM Sep 0.60% 0.20% -0.80% 11/08 France INSEE National Statistics Office Manufacturing Production YoY Sep 0.40% 0.10% -1.50% 11/07 China National Bureau of Statistics Foreign Reserves Oct $3,105.16bn $3,100.00bn $3,092.43bn 11/08 China National Bureau of Statistics Imports YoY Oct -6.40% -7.80% -8.50% 11/08 China National Bureau of Statistics Exports YoY Oct -0.90% -3.90% -3.20% 11/08 China National Bureau of Statistics Trade Balance Oct $42.81bn $40.10bn $39.65bn 11/09 China National Bureau of Statistics CPI YoY Oct 3.80% 3.40% 3.00% 11/09 China National Bureau of Statistics PPI YoY Oct -1.60% -1.50% -1.20% 11/09 China The People's Bank of China Money Supply M0 YoY Oct – 4.00% 4.00% 11/09 China The People's Bank of China Money Supply M1 YoY Oct – 3.80% 3.40% 11/09 China The People's Bank of China Money Supply M2 YoY Oct – 8.40% 8.40% Source: Bloomberg (s.a. = seasonally adjusted; n.s.a. = non-seasonally adjusted; w.d.a. = working day adjusted) News Qatar  The semi-annual index review – MSCI announced on November 07, 2019, the result of the semi-annual index review. For the QSE listed companies, Qatar International Islamic Bank (QIIK) added to MSCI Qatar Index and none were deleted from MSCI indices. The changes to the MSCI indices will become effective on close of November 26, 2019. (QSE)  US Secretary of Commerce Wilbur Ross visits Baladna – The US Secretary of Commerce Wilbur Ross arrived in Qatar to discuss key initiatives between Qatar and the US. Secretary Wilbur Ross, along with the Minister of Commerce and Industry HE Ali bin Ahmed Al Kuwari, also visited Baladna, the leading and largest dairy producer in Qatar. Baladna, a Qatari public shareholding company under incorporation, recently announced that its subsidiary Baladna Food Industries (BFI), Qatar’s best- loved and market-leading dairy and beverage brand, has made significant investment in new, state-of-the art facilities at its Umm AlHawaya dairy farm. The investment comes as Baladna has announced an IPO to enable Qatari citizens and corporates to share in the company’s rapid growth and expansion. Following the blockade in June 2017, BFI embarked on an extensive program of significant investment in infrastructure development, plant and machinery to increase production capacity and achieve self-sufficiency in its dairy and juice production. BFI’s facilities at Umm AlHawaya now consist of two separate dairy farms, six milking areas, forty barns, three dairy and juice factories, a plastics factory, an animal feed processing facility, a water treatment facility, and a compost processing facility. The US Secretary of Commerce, who is here after a whirlwind Asia-Pacifictour, is expected to hold high-level discussions in Qatar. The past week witnessed a series of Qatar- US discussions, at several levels, that reinforced the relations between the two countries. US Secretary of Treasury Steven Mnuchin concluded a two-day visit to Qatar on November 5. (Peninsula Qatar)  Al Rayyan Municipality tops in building permit issuance in October – Al Rayyan Municipality has topped the country in terms of the number of building permits issued in October. According to the monthly statistics, 221 permits were issued by Al Rayyan Municipality, constituting a 23% share in total permits issued in the country. Planning and Statistics Authority released the monthly statistics of building permits issued by all municipalities. Al Wakrah Municipality came second with the issuance of 203 permits, having a share of 21%, followed by Al Da’ayen Municipality that sawissuance of 193 permits with 20% share and Doha Municipality witnessed issuance of 170 permits having a share of 18%. Umm Slal issued 67 permits, Al Khor 40 permits, Al Sheehaniya 38 permits while Al Shammal issued 22 permits. In terms of type of permits issued, data showed that the new building permits (residential and non-residential) constituted 57% (545 permits) of the total building permits issued in October, while the percentage of additions permits constituted 40% (381 permits), and fencing permits with 3% (28 permits). (Peninsula Qatar)  Opportunities galore for foreign firms in Qatar – Many international companies are looking for business opportunities in Qatar especially in the food and tourism sectors, chairperson of the Italian Chamber of Commerce in Qatar has said. Talking to Qatar Tribune on the sidelinesof the Back 2 Business networking event in Doha, Italian Chamber of Commerce in Qatar Palma Libotte said that representatives of many food companies from Italy and other countries took part in the Back 2 Business networking event to discuss business opportunities in Qatar. With 2022 FIFA World Cup approaching fast, Libotte said, the number of people visiting Qatar has increased and resulted in many business opportunities in the country. “Italian Chamber of Commerce in Qatar has started a guide service for high-profile delegations and individuals visiting the country in five international languages like Spanish, Italian, English, French and German. It has emerged as a very good business opportunity
  • 4. Page 4 of 9 in Qatar.” “It’s a tailor-made service to assist business delegation looking for business opportunities in Qatar. We are getting a very good response from foreign delegations as a number of such delegations and individuals have approached us to avail of this service,” she said. Despite the ongoing the blockade, Libotte said that business sentiment in Qatar is quite upbeat and it can be gauged from the fact that the 16th edition of Back to Business attracted more than 400 international and local participants. (Qatar Tribune)  Qatar 2020 census to start Sunday – The Planning and Statistics Authority’s first phase of the general census of population, housing and establishments (Qatar 2020 Census), will start Sunday. The process will last one month. The Authority will hold a press conference Sunday to announce the details of the first phase of the census process, the first field work of researchers, the following stages of the process and its nature, and the objectives of the census. The press conference will be addressed by HE the President of Planning and Statistics Authority Dr Saleh bin Mohamed Al-Nabit, and members of the Census Executive Committee. Last week, the Planning and Statistics Authority organized the main training program for field researchers as part of preparations for the first phase of the Qatar Population, Housing and Establishments Census 2020 (data completion phase). The census is one of the most important statistical projects to collect comprehensive and up-to-date data of individuals, families, buildings and establishments in order to achieve developmental and service objectives. (Gulf- Times.com) International  QNB Group economic commentary: US Fed cuts rates again and signals a pause for breath – The US Federal Reserve (Fed) has decided to cut rates for the third time this year at its latest monetary policy meeting in October 29-30th. The target range for the benchmark fed funds rate was adjusted down by another 25 basis points (bps) to 1.5-1.75%. Stated reasons for the cut included “the implication of global developments for the economic outlook as well as muted inflation pressures.” This decision was widely anticipated. Forward guidance from the official statement and the post meeting press conference were moderately hawkish. The previous line about acting “as appropriate to sustain the expansion” was substituted by more ambiguous language about assessing “the appropriate path of the target range for the federal funds rate.” The characterizations of growth, inflation and risks to the outlook remained essentially the same. Moreover, regional Fed presidents Esther George (Kansas City) and Eric Rosengren (Boston) reaffirmed their hawkish dissent against the decision to cut rates further. Three main factors help explain the Fed’s moderately hawkish statement and the space for a pause before incoming data points to a more clear direction for the US and global economies. First, investor sentiment has improved significantly in recent weeks, which eased financial conditions and created a more supportive climate for risk taking. Despite ebbs and flows, developments in key risk factors such as global trade conflicts seem to have taken a positive turn. As a response, the Chicago Board Options Exchange (CBOE) Volatility Index (VIX), often referred to as “fear gauge,” has plummeted. Similarly, CNN’s Fear and Greed Index, which collects several indicators to estimate the emotions driving investor behavior, moved from “fear” a month ago to “extreme greed” at the time of writing. Second, leading indicators of global demand started to show more persistent signs of stabilization. The Global Manufacturing Purchasing Managers’ Indices (PMI), for example, have bottomed in May 2019 after falling for several consecutive months. Currently at 51.2, the PMI is still above the 50 threshold that separates contraction from expansion. More importantly, exports from Asian early reporters, a key gauge of global activity, are finally stabilizing after almost two years of slowdown and even some decline. This is a key input for US policymakers as battered global conditions are often presented as one of the main reasons behind the need for further monetary accommodation. Third, market based early warning indicators have also eased, moderating the implied probabilities of a recession over the short-term. As investors rotate from safe- haven bonds to riskier assets, several of the US government yield curves have returned to positive territory after inverting. This includes the benchmark spread between the 10-year Treasury notes versus the 3-month bills. Inverted yield curves historically signaled a coming recession a year or two in advance. In addition, equity market internals or market breadth indicators have also improved. The S&P 500’s recent all-time highs seems to have a stronger base as market internals are more synchronized and trading volume data also supports overall stronger market breath. (Peninsula Qatar)  Fed sees climate change shaping economy, policy – The US central bank signaled on Friday it may be getting ready to join international peers in incorporating climate change risk into its assessments of financial stability, and may even take it into account when setting monetary policy. “To fulfill our core responsibilities, it will be important for the Federal Reserve to study the implications of climate change for the economy and the financial system and to adapt our work accordingly,” Fed Governor Lael Brainard said in remarks released at the start of the Fed’s first-ever conference on climate change and economics. The Fed, she said, will need to look at how to keep banks and the financial system resilient amid risks from extreme weather, higher temperatures, rising sea levels and other effects of the accumulation of greenhouse gases in the atmosphere. And increasingly, she said, “it will be important for the Federal Reserve to take into account the effects of climate change and associated policies in setting monetary policy to achieve our objectives of maximum employment and price stability.” Brainard’s comments mark a shift for the Fed, which lags other major central banks that have made climate change an explicit part of their financial stability remits. Her talk, the first she’s given in her five-year tenure at the Fed that even mentions the subject, suggests she and her colleagues are taking the risks and costs of global warming seriously. (Reuters)  US wholesale inventories revised lower, sales flat – US wholesale inventories fell more than initially estimated in September to post their biggest decline in nearly two years, suggesting inventory investment could continue to weigh on economic growth. The Commerce Department stated on Friday wholesale inventories fell 0.4% in September, instead of the previously reported 0.3% decline, after having risen 0.1% in August. Inventories were up 4.8% on a year-on-year basis in September. The decline in September was the largest since
  • 5. Page 5 of 9 October 2017. The component of wholesale inventories that goes into the calculation of gross domestic product fell 0.3% in September. The pace of inventory accumulation has been slowing after stocks increased strongly from the third quarter of 2018 through the first quarter of this year. The inventory overhang has led businesses to place fewer orders at factories, contributing to a downturn in the manufacturing sector, which also has been hurt by uncertainty over the ongoing US-China trade negotiations. Sales at wholesalers were unchanged in September after falling 0.1% in August. Motor vehicle sales slumped 3.1% in September after edging up 0.1% in the previous month. At September’s sales pace it would take wholesalers 1.36 months to clear shelves, unchanged from August. (Reuters)  US weekly jobless claims fall more than expected – The number of Americans filing applications for unemployment benefits fell more than expected last week, consistent with strong labor market conditions and continued job growth. Initial claims for state unemployment benefits decreased 8,000 to a seasonally adjusted 211,000 for the week ended November 2, the Labor Department stated on Thursday. Data for the prior week was revised to show 1,000 more applications received than previously reported. Economists polled by Reuters had forecast claims would fall to 215,000 in the latest week. The Labor Department stated claims for one state, Kentucky, were estimated last week. The four-week moving average of initial claims, considered a better measure of labor market trends as it irons out week-to-week volatility, increased 250 to 215,250 last week. The level of claims suggests solid labor market conditions. Reuters)  Moody's: UK spending plans, Brexit paralysis put rating at risk – Moody’s warned on Friday it might cut its rating on Britain’s sovereign debt again, saying that neither of the main political parties in next month’s election was likely to tackle high borrowing levels which Brexit had made even harder to fix. In a toughly worded statement, Moody’s stated the fissures in Britain’s society and politics exposed by its still-unresolved decision to leave the European Union would be long-lasting. Moody’s said Britain’s 1.8tn Pounds ($2.30tn) of public debt - more than 80% of annual economic output - risked rising again and the economy could be “more susceptible to shocks than previously assumed.” Both of the main political parties have promised big spending increases ahead of next month’s election. “In the current political climate, Moody’s sees no meaningful pressure for debt-reducing fiscal policies,” the ratings agency stated. (Reuters)  EU Commission cuts Eurozone growth forecast, sees muted inflation – The Eurozone economy is likely to grow slower than earlier expected this year and next, the European Commission forecast on Thursday, because of global trade conflicts, geopolitical tensions and Brexit. The Commission cut its growth forecast for the 19 countries that share the euro to 1.1% this year from 1.2% it expected in July, and to 1.2% in 2020 and 2021 from 1.4%. The Commission forecast the Eurozone’s aggregate budget deficit would rise from an historic low of 0.5% of GDP in 2018 to 0.8% this year, 0.9% in 2020 and 1.0% in 2021, unless policies change. But pressure for higher fiscal stimulus is mainly on Germany and the Netherlands, referred to as countries that have fiscal space, because both have been running large budget surpluses for years and both of which have low public debt. Germany is to have a budget surplus of 1.2% of GDP this year and 0.6% in 2020, while the Netherlands is to have a surplus of 1.5% this year and 0.5% next year. Despite the slower GDP growth, the Eurozone’s aggregate public debt-to-GDP ratio is to continue declining for the fifth year in a row to 86.4% this year, 85.1% in 2020 and 84.1% in 2021. The Commission sees Eurozone inflation, which the European Central Bank wants to keep below, but close to 2% over the medium term, at 1.2% this year and next, rising to 1.3% in 2021 — still well below the ECB’s target. (Reuters)  Scholz: German economic situation stable, growth to pick up once trade tensions gone – Germany’s economic situation is stable with employment at all time highs and economic growth is likely to pick up in the coming years once global trade tensions are resolved, German Finance Minister Olaf Scholz said on Thursday. “Germany is in a stable economic situation, it is a very competitive economy that is successful all over the globe,” Scholz told reporters on entering a meeting of Eurozone finance ministers in Brussels. “But there is slow growth in the world economy today, it is mostly the result of trade tensions and uncertainty. But if we get over this situation and if there is an agreement between China and the United States on trade wewill have more growth worldwide. This will help the European and also the German economy,” he said. “We still have a very strong economic situation, an all time high of employment, there are a lot of industries looking for more labor ... so this is a stable situation, we will have more growth in the next years and if the trade tensions worldwide are reduced this will have a real impact on better growth,” he said. (Reuters)  Japan's Abe tells cabinet to compile stimulus package to support economy – Japanese Prime Minister Shinzo Abe asked his cabinet on Friday to compile a package of stimulus measures to support the economy and build infrastructure to cope with large natural disasters, the government’s top spokesman said. Chief Cabinet Secretary Yoshihide Suga told reporters that the package will include steps to promote investment for growth through aggressive use of fiscal investment and loan programs. The government will compile the package as soon as possible, although the size of spending will depend on proposals to be made by various ministries, Economy Minister Yasutoshi Nishimura told a news conference after a regular cabinet meeting. Japanese policymakers have been under pressure to fend off heightening overseas risks with a diminishing tool-kit, as the US-China trade war and soft global demand have hurt the export-reliant economy. Finance Minister Taro Aso said the planned economic package should help enhance productivity and achieve strong growth to overcome the pressure caused by a declining population, which he said was the “biggest problem” Japan faces in the long run. (Reuters)  Japan firms say October tax hike impact milder than 2014 increase – More than two-thirds of Japanese companies are feeling less pain from a tax increase last month than from the previous increase five years ago, which precipitated a recession, a Reuters poll found. The results of the Reuters Corporate Survey support the view of the government and Bank of Japan that the economy looks likely to avoid a swoon in private consumption, thanks to steps taken to offset how the tax increase would affect
  • 6. Page 6 of 9 the public. Still, the overwhelming majority of Japanese companies remain cautious about boosting spending, with many planning to keep wages and hiring flat or even reduce them. The survey offers the first corporate gauge of the impact of increasing the national sales tax to 10% from 8%, a step Prime Minister Shinzo Abe said was critical to curbing Japan’s enormous public debt. He delayed it twice for fear it would squeeze consumer spending. More than 70% of companies in the Reuters poll said both the rush to buy ahead of the Oct. 1 increase and the subsequent pullback have been milder than when sales tax increased from 5% in April 2014. That tax hike dealt a blow to private consumption, which makes up about 60% of the economy. (Reuters)  Japan September real wages rise for first time in nine months – Japan’s inflation-adjusted real wages rose in September for the first time in nine months, government data showed, offering a glimmer of hope for a recovery in consumer spending - although an October 1 sales tax hike and global slowdown cloud the outlook. The data could support the view of the government and the central bank that a tight labor market should push up wages, stoking a virtuous cycle of household income gains and pick-up in private consumption, which will in turn accelerate inflation. More than six years of massive monetary stimulus by the Bank of Japan has failed to accelerate inflation to its elusive 2% target, as tepid wage growth and tame consumer spending have kept a lid on prices despite the tightest job market in decades. Labor ministry data out on Friday showed real wages, a key gauge of households’ purchasing power, rose 0.6% in the year to September, up for the first time since the end of last year, as nominal wage growth outpaced consumer prices. Nominal total cash earnings rose 0.8% in the year to September, up for the first time in three months, it showed. (Reuters)  China's Oct PPI falls 1.6% YoY, CPI rises to near eight-year high – China’s factory gate prices fell 1.6% in October from a year earlier, the steepest fall since July 2016, data from the National Bureau of Statistics showed on Saturday, as manufacturing continues to struggle with weak demand. Analysts had expected factory gate prices to fall 1.5% YoY. The Producer Price Index (PPI), seen as akey barometerof corporate profitability, fell 1.2% YoY in September. The Consumer Price Index rose 3.8% in October from a year earlier, the fastest pace seen since January 2012, beating analysts’ expectations of 3.3%. It rose 3% in September. (Reuters)  China's October exports fall, but less than expected as trade war grinds on – China’s exports and imports contracted less than expected in October, providing some relief for the economy as Beijing tries to reach a partial trade deal with Washington. But even if a US-China trade deal is signed soon, economists say it is unlikely to help boost exports and manufacturing for some time yet and could still mean more stimulus is needed from Beijing to avert a sharper downturn. China’s October exports fell for the third straight month, down 0.9% from a year earlier, customs data showed on Friday, less than a 3.9% fall forecast in a Reuters poll and September’s 3.2% contraction. (Reuters) Regional  PwC: GCC capital markets to pick up in 4Q2019 after quiet 3Q2019 – GCC’s capital markets activity will pick up in 4Q2019, following a subdued 3Q2019, according to a PwC study. However, the debt market was active during the third quarter. Steve Drake, PwC Middle East Capital Markets Partner, said, “We anticipate the coming quarter to be significantly more active with the recent announcement of Saudi Aramco's record- breaking flotation on Tadwaul, along with many other companies, which have expressed their intention to list in 2019. Meanwhile Tadawul’s recent announcement that it will soon allow listing of foreign companies on its exchange offers further optimism and will further promote equity activity in the region.” The study announced that even though all IPO activities in the region have been limited to Saudi Arabia in 2019, it expects the UAE market to pick up pace after multiple companies have announced their intent to go public and initiated the groundwork for a successful IPO. (Zawya)  Middle Eastern airlines post 1.8% traffic increase in September, says IATA – Middle Eastern airlines posted a 1.8% traffic increase in September, which was a slowdown from a 2.9% rise in August, according to IATA’s latest passenger traffic figures. Capacity was up just 0.2%, with load factor climbing 1.2 percentage points to 75.2%. International traffic growth continues to be affected by a mix of structural challengesin some of the region’s large airlines, geopolitical risks and weaker business confidence in some countries. Global passenger traffic results for September showed that demand climbed 3.8% compared to the same month last year, broadly unchanged from August’s performance. Capacity increased by 3.3%, and load factor climbed 0.4% percentage point to 81.9%, which was a record for any September. (Gulf-Times.com)  Saudi Aramco prospectus flags risks, gives few details on IPO size – Saudi Aramco will sell 0.5% of its shares to individual retail investors and the government will have a lockup period of a year on further share sales after the initial public offering, its prospectus stated on Saturday. The more than 600-page prospectus did not include details of how much of the company would be floated in total or of any commitments from anchor investors. Sources have said the company could sell 1%-2% on the Saudi stock market in what could be the world’s largest listing. Offering for the shares will begin on November 17, the prospectus stated. Among the risks highlighted in the prospectus were the potential for terrorist attacks and the potential for encountering antitrust legislation, as well as the right of the Saudi government to decide maximum crude output and direct Saudi Aramco to undertake projects outside its core business. The prospectus stated the government will have a statutory lockup period for disposing of any shares after the listing for six months, and a contractual lockup period for 12 months. Saudi Aramco cannot list additional shares for a period of six months after trading starts, and will also be restricted from issuing additional shares for 12 months. (Reuters)  Moody's maintains ‘Stable’ outlook for UAE banking system on resilient credit profiles – Moody’s Investors Service (Moody’s) maintained a ‘Stable’ outlook for the UAE’s banking system, citing banks’ strong capital, stable funding and healthy liquidity that balance weakening asset quality and softening profitability. The ratings agency stated it expects the country’s economic growth to remain stable at subdued levels and forecasts overall real GDP growth at 1.7% in 2019 and 1.4% in 2020, compared with 1.7% in 2018. It forecast credit growth in
  • 7. Page 7 of 9 2019 and 2020 at 4% compared to 4.3% in 2018. Moody’s stated, “It expects solid profitability to support sector-wide tangible common equity (TCE) at 14%-16% of risk weighted assets over the next 12 to 18 months, from 14.4% at June 2019. Even under our low probability, high stress scenario, the sector-wide TCE ratio would remain adequate at 11.6%.” The ratings agency noted that moderate oil prices will be sufficient to support the revenues of government-related entities and corporates, which will contribute to stable funding and liquidity conditions. It stated profitability is expected to decline modestly, while loan performance will weaken as subdued economic growth means corporates will face lower business volumes and margin compression, while personal borrowers see limited wage growth. Moody’s also stated that the UAE’s government’s willingness and capacity to support local banks if needed will remain high over the next 12 to 18 months. (Zawya)  Dubai airport passenger traffic falls 2.4% in third quarter – Dubai International reported a 2.4% fall in third-quarter passenger traffic. The airport stated it handled 23.2mn passengers in the three months to September 30. That compares with roughly 22.6mn in the same period a year ago. In the first nine months of this year, 64.5mn passengers traveled through the airport, 4.5% fewer than the same period last year. Operator Dubai Airports blamed the year-to-date decline on a 45-day closure of a runway between May and April, and the global grounding of the Boeing 737 MAX jet since March. The amount of cargo handled fell 5.9% in the third quarter to 636,575 tons, while the year-to-date figure dropped 4.1% to 1.9mn tons. (Reuters)  Dubai Islamic Bank hires banks for dollar sukuk – Dubai Islamic Bank (DIB) has hired lenders to arrange meetings with investors ahead of a potential issue of five-year Sukuk, or Islamic bonds, denominated in US dollars, a document showed. The bank - the United Arab Emirates’ largest Shari’ah-compliant lender - has picked Bank ABC, Dubai Islamic Bank, Emirates NBD Capital, First Abu Dhabi Bank, HSBC, Islamic Corporation for the Development of the Private Sector, Maybank, Sharjah Islamic Bank, Standard Chartered Bank and Warba Bank. Investor meetings will take place in Hong Kong and London starting on November 11. (Reuters)  EIBANK's net profit narrows to AED0.3mn in 3Q2019 – Emirates Investment Bank (EIBANK) recorded net profit of AED0.3mn in 3Q2019 as compared to AED5.1mn in 3Q2018. Net Interest and Investment Income came in at AED15.1mn as compared to AED21.3mn in 3Q2018. Operating profit came in at AED23.2mn as compared to AED30.5mn in 3Q2018. EPS came in at AED0.40 in 3Q2019 as compared to AED7.22 in 3Q2018. Total assets stood at AED3.2bn at the end of September 30, 2019 as compared to AED4.0bn at the end of December 31, 2018. Net investments stood at AED1.5bn (+2.6% YTD), while customers’ deposits stood at AED1.7bn (-40.4% YTD) at the end of September 30, 2019. (DFM)  ADIB posts 5.2% YoY rise in net profit to AED619.8mn in 3Q2019 – Abu Dhabi Islamic Bank (ADIB) recorded net profit of AED619.8mn in 3Q2019, an increase of 5.2% YoY. Profit from operations, before distribution to depositors rose 4.8% YoY to AED817.6mn in 3Q2019. Total assets stood at AED124.3bn at the end of September 30, 2019 as compared to AED125.2bn at the end of December 31, 2018. Ijara Financing stood at AED45.5bn (+0.9% YTD), while depositor's accounts stood at AED100.4bn (almost remained flat YTD) at the end of September 30, 2019. EPS came in at AED0.144 in 3Q2019 as compared to AED0.176 in 3Q2018. (ADX)  Dana Gas’ collections increase 16.7% to $230mn in first nine months of 2019 – Dana Gas announced that in the first nine months of 2019 collections in Egypt, the UAE and from its share of Pearl Petroleum Company Limited’s sales in the Kurdistan Region of Iraq (KRI), increased 16.7% YoY to $230mn. Dana Gas, which owns a 35% stake in Pearl Petroleum, saw its share of sales of condensate, LPG and gas in the KRI jump 52% to $118mn in the nine-month period from $77mn in the same period the previous year. Dana Gas received cash dividends of $68.3mn from Pearl Petroleum over this period. Meanwhile, the collections from Dana Gas Egypt were $105mn during the period, in line with the $111mn received in the same period of 2018 whilst collections from the company’s Zora gas field in the UAE stood at $7.3mn. (ADX)  ADX lists Aldar Investments $500mn Sukuk after issue draws strong investor demand – The latest $500mn Sukuk issued by Aldar Investment Properties (Aldar Investments), a 100% owned subsidiary of Aldar Properties, was listed on the Abu Dhabi Securities Exchange (ADX) on November 07, 2019. The fixed-rate, US dollar-denominated Sukuk, with a tenor of 10 years, carries a coupon rate of 3.875%. The issue was six times oversubscribed, with global investors accounting for 71% of the total transaction allocation. Aldar Investments owns and manages an AED20bn diversified portfolio of high-quality income-generating residential, retail, commercial and hospitality assets. (ADX)  CFO: TAQA forecasts AED1.9bn capex for 2019 – Abu Dhabi National Energy Company (TAQA) has forecast a capital expenditure (capex) of AED1.9bn for full-year 2019, its Chief Financial Officer (CFO), Mohammed Al Ahbabi said. The state- owned oil explorer and power producer's capex for the first nine months of this year was AED1.2bn. TAQA reported a third quarter net loss attributable to shareholders of AED16mn compared to a net profit of AED153mn a year-ago. (Zawya)  KHCB post net loss of BHD5.4mn in 3Q2019 – Khaleeji Commercial Bank (KHCB) recorded net loss of BHD5.4mn in 3Q2019 as compared to net profit of BHD0.3mn in 3Q2018. Total income fell 15.5% YoY to BHD3.8mn in 3Q2018. Total assets stood at BHD923.8mn at the end of September 30, 2019 as compared to BHD850.9mn at the end of December 31, 2018. Financing assets stood at BHD325.7mn (-0.6% YTD), while placements from financial institutions stood at BHD163.8mn (+3.4% YTD) at the end of September 30, 2019. Loss per share came in at 5.753 fills in 3Q2019 as compared to earnings per share 0.355 fills in 3Q2018. (Bahrain Bourse)  CBK: Kuwait’s balance of payments records deficit in 2Q2019 – Preliminary data of the State of Kuwait’s Balance of Payments (BoP) for the second quarter of 2019 showed turning to deficit, after recording surplus in the corresponding period in 2018, according to the Central Bankof Kuwait (CBK). CBK data showed that BoP deficit in 2Q2019 reached KD9.5mn, against a surplus of KD961mn for the same period last year. It is worth noting that in 1Q2019, the BoP recorded a KD234.6mn surplus. The balance on goods showed a decline in surplus to KD3.02bn, down from
  • 8. Page 8 of 9 KD3.79bn in the same period last year. Meanwhile, the secondary income account rose by 15.7% to KD1.4bn, compared with KD1.21bn in 2Q2019. Current account surplus has increased by 11.8% to KD3.22bn, up from KD2.88bn in the same period a year ago. (Zawya)  Kuwait plans to increase oil exports to China – Kuwait plans to increase crude oil exports to China to more than 600,000 barrels per day (bpd) in 2020, state news agency KUNA reported on Saturday, citing Kuwait Petroleum Corp’s Deputy Managing Director for Global Marketing, Sheikh Khalid Al-Sabah. The agency did not specify the current level of oil exports to China. Kuwait’s crude production was 2.65mn bpd in October, according to a Reuters survey. (Reuters)  CEO: IPO of Kuwait stock exchange will be oversubscribed – The Kuwait stock exchange’s IPO is progressing well and will close next month oversubscribed, the bourse’s CEO said. “I am 100% sure it will be covered many times,” Mohammad Al-Osaimi, the CEO of Boursa Kuwait, said in an interview with Bloomberg Television. The sale of half the exchange to local citizens began last month and will end on December 1, with the offering price set at 100 fils per share, or one-tenth of a dinar. The IPO follows a 44% sale earlier this year to a consortium of domestic and international investors. Al-Osaimi said local legislation does not state the bourse must be Shari’ah-compliant, and that the exchange operates with normal practices seen in other markets. He expects the stock to start trading around June. The exchange has made all the changes necessary for index compiler MSCI Inc to upgrade it to emerging-market status in June, as required by the New York-based company earlier this year, he said. That should lead to as much as $3bn in passive inflows to the country, he estimated. (Gulf-Times.com)
  • 9. Contacts Saugata Sarkar, CFA, CAIA Shahan Keushgerian Zaid al-Nafoosi, CMT, CFTe Head of Research Senior Research Analyst Senior Research Analyst Tel: (+974) 4476 6534 Tel: (+974) 4476 6509 Tel: (+974) 4476 6535 saugata.sarkar@qnbfs.com.qa shahan.keushgerian@qnbfs.com.qa zaid.alnafoosi@qnbfs.com.qa Mehmet Aksoy, PhD QNB Financial Services Co. W.L.L. Senior Research Analyst Contact Center: (+974) 4476 6666 Tel: (+974) 4476 6589 PO Box 24025 mehmet.aksoy@qnbfs.com.qa Doha, Qatar Disclaimer and Copyright Notice: This publication has been prepared by QNB Financial Services Co. W.L.L. (“QNB FS”) a wholly-owned subsidiary of Qatar National Bank (Q.P.S.C.). QNB FS is regulated by the Qatar Financial Markets Authority and the Qatar Exchange. Qatar National Bank (Q.P.S.C.) is regulated by the Qatar Central Bank. This publication expresses the views and opinions of QNB FS at a given time only. It is not an offer, promotion or recommendation to buy or sell securities or other investments, nor is it intended to constitute legal, tax, accounting, or financial advice. QNB FS accepts no liability whatsoever for any direct or indirect losses arising from use of this report. Any investment decision should depend on the individual circumstances of the investor and be based on specifically engaged investment advice. We therefore strongly advise potential investors to seek independent professional advice before making any investment decision. Although the information in this report has been obtained from sources that QNB FS believes to be reliable, we have not independently verified such information and it may not be accurate or complete. QNB FS does not make any representations or warranties as to the accuracy and completeness of the information it may contain, and declines any liability in that respect. For reports dealing with Technical Analysis, expressed opinions and/or recommendations may be different or contrary to the opinions/recommendations of QNB FS Fundamental Research as a result of depending solely on the historical technical data (price and volume). QNB FS reserves the right to amend the views and opinions expressed in this publication at any time. It may also express viewpoints or make investment decisions that differ significantly from, or even contradict, the views and opinions included in this report. This report may not be reproduced in whole or in part without permission from QNB FS. COPYRIGHT: No part of this document may be reproduced without the explicit written permission of QNB FS. Page 9 of 9 Rebased Performance Daily Index Performance Source: Bloomberg Source: Bloomberg Source: Bloomberg Source: Bloomberg (*$ adjusted returns) 60.0 80.0 100.0 120.0 140.0 Oct-15 Oct-16 Oct-17 Oct-18 Oct-19 QSE Index S&P Pan Arab S&P GCC 0.6% (0.1%) 0.3% 0.1% 0.3% (0.2%) 0.4% (0.5%) 0.0% 0.5% 1.0% SaudiArabia Qatar Kuwait Bahrain Oman AbuDhabi Dubai Asset/Currency Performance Close ($) 1D% WTD% YTD% Global Indices Performance Close 1D%* WTD%* YTD%* Gold/Ounce 1,458.92 (0.7) (3.7) 13.8 MSCI World Index 2,268.83 0.1 0.7 20.4 Silver/Ounce 16.79 (1.8) (7.3) 8.4 DJ Industrial 27,681.24 0.0 1.2 18.7 Crude Oil (Brent)/Barrel (FM Future) 62.51 0.4 1.3 16.2 S&P 500 3,093.08 0.3 0.9 23.4 Crude Oil (WTI)/Barrel (FM Future) 57.24 0.2 1.9 26.1 NASDAQ 100 8,475.31 0.5 1.1 27.7 Natural Gas (Henry Hub)/MMBtu 2.87 0.3 13.0 (10.0) STOXX 600 405.42 (0.5) 0.2 15.5 LPG Propane (Arab Gulf)/Ton 51.88 1.0 0.2 (18.3) DAX 13,228.56 (0.6) 0.8 20.7 LPG Butane (Arab Gulf)/Ton 68.50 3.4 1.7 (2.1) FTSE 100 7,359.38 (1.0) (0.5) 9.6 Euro 1.10 (0.3) (1.3) (3.9) CAC 40 5,889.70 (0.2) 0.9 19.8 Yen 109.26 (0.0) 1.0 (0.4) Nikkei 23,391.87 0.5 1.5 18.2 GBP 1.28 (0.3) (1.3) 0.2 MSCI EM 1,064.85 (0.8) 1.5 10.3 CHF 1.00 (0.2) (1.2) (1.6) SHANGHAI SE Composite 2,964.19 (0.7) 0.8 16.9 AUD 0.69 (0.5) (0.6) (2.6) HANG SENG 27,651.14 (0.7) 2.2 7.1 USD Index 98.35 0.2 1.1 2.3 BSE SENSEX 40,323.61 (1.3) (0.7) 9.3 RUB 63.81 0.5 0.4 (8.5) Bovespa 107,629.00 (3.2) (4.6) 14.3 BRL 0.24 (1.5) (4.1) (6.8) RTS 1,468.17 (1.3) 0.9 37.4 110.3 105.9 89.7