QNBFS Daily Market Report January 22, 2019
•
1 like•109 views

The QSE Index declined 0.4% with losses led by the Transportation and Insurance indices. Qatar General Insurance and Ahli Bank were the top losers falling 7.0% and 5.5% respectively. Meanwhile, Qatar Oman Investment Company gained 6.6%. Regionally, indices were mixed with Saudi Arabia up 0.2% while Dubai fell 0.6% and Abu Dhabi declined 0.4%. Earnings news included Masraf Al Rayan posting a 7% rise in net profit for 4Q2018 and recommending a dividend of QR2 per share.

Recommended
Recommended
More Related Content
What's hot
What's hot (20)
Similar to QNBFS Daily Market Report January 22, 2019
Similar to QNBFS Daily Market Report January 22, 2019 (20)
More from QNB Group
More from QNB Group (20)
Recently uploaded
Recently uploaded (20)
QNBFS Daily Market Report January 22, 2019
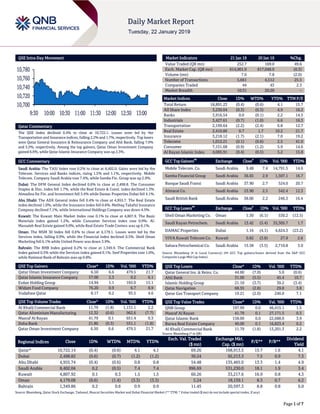
- 1. Page 1 of 7 QSE Intra-Day Movement Qatar Commentary The QSE Index declined 0.4% to close at 10,722.1. Losses were led by the Transportation and Insurance indices, falling 2.2% and 1.7%, respectively. Top losers were Qatar General Insurance & Reinsurance Company and Ahli Bank, falling 7.0% and 5.5%, respectively. Among the top gainers, Qatar Oman Investment Company gained 6.6%, while Qatar Islamic Insurance Company was up 2.3%. GCC Commentary Saudi Arabia: The TASI Index rose 0.2% to close at 8,402.0. Gains were led by the Telecom. Services and Banks indices, rising 1.5% and 1.1%, respectively. Mobile Telecom. Company Saudi Arabia rose 7.4%, while Samba Fin. Group was up 2.9%. Dubai: The DFM General Index declined 0.6% to close at 2,498.8. The Consumer Staples & Disc. index fell 1.7%, while the Real Estate & Const. index declined 1.3%. Almadina for Fin. and Investment fell 5.4% while Damac Properties Dubai fell 4.1%. Abu Dhabi: The ADX General index fell 0.4% to close at 4,955.7. The Real Estate index declined 1.0%, while the Insurance index fell 0.6%. Methaq Takaful Insurance Compnay declined 7.1%, while International Holdings Company was down 4.5%. Kuwait: The Kuwait Main Market Index rose 0.1% to close at 4,807.9. The Basic Materials index gained 1.2%, while Consumer Services index rose 0.9%. Al- Massaleh Real Estate gained 9.0%, while Real Estate Trade Centers was up 6.1%. Oman: The MSM 30 Index fell 0.6% to close at 4,179.1. Losses were led by the Services index, falling 0.9%, while the Financial index declined 0.5%. Shell Oman Marketing fell 6.1% while United Power was down 3.9%. Bahrain: The BHB Index gained 0.2% to close at 1,349.9. The Commercial Bank Index gained 0.5% while the Services index gained 0.1%. Seef Properties rose 1.0%, while National Bank of Bahrain was up 0.8%. QSE Top Gainers Close* 1D% Vol. ‘000 YTD% Qatar Oman Investment Company 6.50 6.6 479.5 21.7 Qatar Islamic Insurance Company 57.00 2.3 0.2 6.1 Ezdan Holding Group 14.94 1.1 165.0 15.1 Widam Food Company 76.20 0.9 6.7 8.9 Vodafone Qatar 8.17 0.2 93.5 4.6 QSE Top Volume Trades Close* 1D% Vol. ‘000 YTD% Al Khalij Commercial Bank 11.79 (1.8) 1,131.1 2.2 Qatar Aluminium Manufacturing 12.32 (0.6) 962.6 (7.7) Masraf Al Rayan 41.79 0.1 651.4 0.3 Doha Bank 21.80 (0.3) 551.1 (1.8) Qatar Oman Investment Company 6.50 6.6 479.5 21.7 Market Indicators 21 Jan 19 20 Jan 19 %Chg. Value Traded (QR mn) 252.7 169.0 49.6 Exch. Market Cap. (QR mn) 614,901.9 617,048.9 (0.3) Volume (mn) 7.6 7.8 (2.0) Number of Transactions 5,661 4,512 25.5 Companies Traded 44 43 2.3 Market Breadth 10:31 20:20 – Market Indices Close 1D% WTD% YTD% TTM P/E Total Return 18,891.23 (0.4) (0.6) 4.1 15.7 All Share Index 3,230.04 (0.3) (0.3) 4.9 16.2 Banks 3,916.54 0.0 (0.1) 2.2 14.5 Industrials 3,427.61 (0.7) (1.0) 6.6 16.3 Transportation 2,199.64 (2.2) (2.4) 6.8 12.7 Real Estate 2,410.86 0.7 1.7 10.2 21.7 Insurance 3,218.12 (1.7) (2.1) 7.0 19.2 Telecoms 1,012.21 (0.1) (0.6) 2.5 41.0 Consumer 7,151.68 (0.9) (1.2) 5.9 14.6 Al Rayan Islamic Index 4,085.91 (0.4) (0.5) 5.2 15.8 GCC Top Gainers ## Exchange Close # 1D% Vol. ‘000 YTD% Mobile Telecom. Co. Saudi Arabia 9.48 7.4 14,791.5 14.6 Samba Financial Group Saudi Arabia 36.65 2.9 1,507.1 16.7 Banque Saudi Fransi Saudi Arabia 37.90 2.7 524.0 20.7 Almarai Co. Saudi Arabia 53.90 2.5 542.4 12.3 Saudi British Bank Saudi Arabia 38.00 2.2 246.3 16.4 GCC Top Losers ## Exchange Close # 1D% Vol. ‘000 YTD% Shell Oman Marketing Co. Oman 1.30 (6.1) 530.2 (12.5) Saudi Kayan Petrochem. Saudi Arabia 13.42 (5.4) 33,305.7 1.7 DAMAC Properties Dubai 1.16 (4.1) 4,624.3 (23.2) VIVA Kuwait Telecom Co. Kuwait 0.82 (3.8) 27.9 2.6 Sahara Petrochemical Co. Saudi Arabia 15.58 (3.5) 2,710.8 3.0 Source: Bloomberg (# in Local Currency) (## GCC Top gainers/losers derived from the S&P GCC Composite Large Mid Cap Index) QSE Top Losers Close* 1D% Vol. ‘000 YTD% Qatar General Ins. & Reins. Co. 44.60 (7.0) 5.0 (0.6) Ahli Bank 31.00 (5.5) 45.4 10.7 Islamic Holding Group 21.10 (3.7) 30.2 (3.4) Qatar Navigation 68.55 (2.8) 29.8 3.8 Qatar Gas Transport Company 19.21 (2.0) 246.0 7.1 QSE Top Value Trades Close* 1D% Val. ‘000 YTD% QNB Group 197.99 0.0 46,415.1 1.5 Masraf Al Rayan 41.79 0.1 27,171.5 0.3 Qatar Islamic Bank 158.00 0.0 22,688.0 3.9 Barwa Real Estate Company 40.00 0.1 16,823.4 0.2 Al Khalij Commercial Bank 11.79 (1.8) 13,201.3 2.2 Source: Bloomberg (* in QR) Regional Indices Close 1D% WTD% MTD% YTD% Exch. Val. Traded ($ mn) Exchange Mkt. Cap. ($ mn) P/E** P/B** Dividend Yield Qatar* 10,722.14 (0.4) (0.6) 4.1 4.1 69.26 168,913.5 15.7 1.6 4.1 Dubai 2,498.82 (0.6) (0.7) (1.2) (1.2) 30.24 92,213.3 7.5 0.9 7.3 Abu Dhabi 4,955.74 (0.4) (0.6) 0.8 0.8 54.48 135,465.0 13.3 1.4 4.9 Saudi Arabia 8,402.04 0.2 (0.5) 7.4 7.4 996.69 531,230.0 18.1 1.9 3.4 Kuwait 4,807.92 0.1 0.3 1.5 1.5 60.26 33,217.6 16.9 0.8 4.3 Oman 4,179.08 (0.6) (1.4) (3.3) (3.3) 5.24 18,159.1 8.3 0.7 6.2 Bahrain 1,349.86 0.2 0.6 0.9 0.9 11.45 20,597.3 8.8 0.8 6.0 Source: Bloomberg, Qatar Stock Exchange, Tadawul, Muscat Securities Market and Dubai Financial Market (** TTM; * Value traded ($ mn) do not include special trades, if any) 10,700 10,720 10,740 10,760 10,780 9:30 10:00 10:30 11:00 11:30 12:00 12:30 13:00
- 2. Page 2 of 7 Qatar Market Commentary The QSE Index declined 0.4% to close at 10,722.1. The Transportation and Insurance indices led the losses. The index fell on the back of selling pressure from Qatari and GCC shareholders despite buying support from non-Qatari shareholders. Qatar General Insurance & Reinsurance Company and Ahli Bank were the top losers, falling 7.0% and 5.5%, respectively. Among the top gainers, Qatar Oman Investment Company gained 6.6%, while Qatar Islamic Insurance Company was up 2.3%. Volume of shares traded on Monday fell by 2% to 7.6mn from 7.8mn on Sunday. However, as compared to the 30-day moving average of 7.3mn, volume for the day was 4.9% higher. Al Khalij Commercial Bank and Qatar Aluminium Manufacturing Company were the most active stocks, contributing 14.8% and 12.6% to the total volume, respectively. Source: Qatar Stock Exchange (* as a % of traded value) Earnings Releases, Global Economic Data and Earnings Calendar Earnings Releases Company Market Currency Revenue (mn) 4Q2018 % Change YoY Operating Profit (mn) 4Q2018 % Change YoY Net Profit (mn) 4Q2018 % Change YoY Saudi Kayan Petrochemical Co. * Saudi Arabia SR 12,263.2 22.8% 2,660.6 63.2% 1,702.2 154.8% Saudi Steel Pipe Co.* Saudi Arabia SR 646.2 -7.2% -49.1 – -166.7 – Saudi Arabian Fertilizer Co.* Saudi Arabia SR 3,859.8 39.9% 1,692.2 105.2% 1,738.4 97.9% Source: Company data, DFM, ADX, MSM, TASI, BHB. (*Financials for FY2018) Global Economic Data Date Market Source Indicator Period Actual Consensus Previous 01/21 Germany German Federal Statistical Off PPI MoM December -0.40% -0.10% 0.10% 01/21 Germany German Federal Statistical Off PPI YoY December 2.70% 2.90% 3.30% 01/21 China National Bureau of Statistics Industrial Production YoY December 5.70% 5.30% 5.40% 01/21 China National Bureau of Statistics Industrial Production YTD YoY December 6.20% 6.20% 6.30% 01/21 China National Bureau of Statistics GDP YoY 4Q 6.40% 6.40% 6.50% Source: Bloomberg (s.a. = seasonally adjusted; n.s.a. = non-seasonally adjusted; w.d.a. = working day adjusted) Earnings Calendar Tickers Company Name Date of reporting 4Q2018 results No. of days remaining Status QNCD Qatar National Cement Company 23-Jan-19 1 Due NLCS Alijarah Holding 24-Jan-19 2 Due DHBK Doha Bank 27-Jan-19 5 Due WDAM Widam Food Company 27-Jan-19 5 Due QIIK Qatar International Islamic Bank 27-Jan-19 5 Due IHGS Islamic Holding Group 28-Jan-19 6 Due MCGS Medicare Group 30-Jan-19 8 Due QIGD Qatari Investors Group 30-Jan-19 8 Due QATI Qatar Insurance Company 3-Feb-19 12 Due CBQK The Commercial Bank 4-Feb-19 13 Due UDCD United Development Company 6-Feb-19 15 Due QEWS Qatar Electricity & Water Company 10-Feb-19 19 Due QIMD Qatar Industrial Manufacturing Company 10-Feb-19 19 Due DOHI Doha Insurance Group 13-Feb-19 22 Due ORDS Ooredoo 13-Feb-19 22 Due Source: QSE Overall Activity Buy %* Sell %* Net (QR) Qatari Individuals 20.97% 35.67% (37,158,699.51) Qatari Institutions 13.63% 16.59% (7,471,563.82) Qatari 34.60% 52.26% (44,630,263.33) GCC Individuals 0.82% 0.86% (102,207.20) GCC Institutions 4.07% 9.51% (13,727,399.42) GCC 4.89% 10.37% (13,829,606.62) Non-Qatari Individuals 6.33% 8.24% (4,833,298.96) Non-Qatari Institutions 54.17% 29.13% 63,293,168.91 Non-Qatari 60.50% 37.37% 58,459,869.95
- 3. Page 3 of 7 News Qatar MARK posts ~7% YoY increase (~12% QoQ decline) in net profit in 4Q2018, in-line with our estimate; Announces DPS QR2.00 – Masraf Al Rayan's (MARK) net profit rose ~7% YoY (but declined ~12% on QoQ basis) to ~QR498mn in 4Q2018, in line with our estimate of QR497mn. EPS increased to QR2.841 in FY2018 from QR2.704 in FY2017. In FY2018, MARK posted a net profit of QR2.13bn as compared to QR2.03bn in FY2017. The bank’s board of directors recommended a cash dividend distribution of QR2 per share, in line with our estimate. MARK’s CEO, Adel Mustafawi said that the “results achieved were decent” with the increase in net profit. He said the bank’s total assets reached QR97.2bn in December 2018 compared to QR102.9bn in December 2017. Financing activities reached QR72.1bn in end-2018 compared to QR72bn in December last year, while investments amounted to QR19.5bn compared to QR23.9bn. Customers' deposits totaled QR61.5bn in end-2018 compared to QR62.5bn in December 2017. Shareholders' equity before distribution reached QR13.2bn compared to QR13.1bn in December 2017. MARK stated its return on average assets continues to be one of the highest in the market at 2.13%. Return on average shareholders' equity of the bank, before distribution, was 16.1%. Book value per share, before distribution was QR17.7 compared to QR17.59 in December 2017. Capital adequacy ratio reached 19.23% compared to 19.32% in 2017. Non-performing financing (NPF) – analogous to non-performing loans – ratio of 0.83% continues to be one of the lowest in the banking industry, reflecting very strong and prudent credit risk management policies and procedures. Moody's Global Investors Services has reaffirmed the outlook for MARK at ‘Stable’, and therefore, the current rating of MARK is ‘A1 / Prime-1’ with a ‘Stable’ outlook. This rating reflects the bank’s strong government-linked position in Qatar, its ability to diversify sources of income, stability in asset quality and a low NPF ratio. (QNBFS Research, QSE, Gulf-Times.com) UDCD opens nominations for its board membership – United Development Company (UDCD) announced that the nominations for its board membership will be opened for two weeks starting from January 23, 2019 until February 5, 2019. (QSE) Qatar to invest $500mn in Lebanese government bonds – Qatar plans to invest $500mn in Lebanese government bonds to support Lebanon's economy, HE the Deputy Prime Minister and Minister of Foreign Affairs, Sheikh Mohamed Bin Abdulrahman Al-Thani said. The decision was made after a meeting between the HH the Amir Sheikh Tamim Bin Hamad Al-Thani and Lebanese President, Michel Aoun in Beirut. In a statement to Qatar News Agency, Sheikh Mohamed said the move will strengthen the Lebanese economy, adding that Qatar has always been committed to supporting Lebanese people in light of the great challenges they face. (Gulf-Times.com) MEEZA, Vodafone Qatar renew partnership agreement for another 10 years – MEEZA, Qatar’s prominent end-to-end Managed IT Services & Solutions Provider, renewed its existing contract with Vodafone Qatar to host the telecommunications operator’s IT infrastructure in MEEZA’s state-of-the-art data centers for another 10 years. Since Vodafone Qatar’s establishment in 2008, MEEZA has been providing data suite, IT equipment hosting and co-location services with tier three service level agreements. (Qatar Tribune) Mali offers Qatar investment opportunities in infrastructure, agriculture sectors – West African country, Mali has invited Qatari investors to participate in major projects in the fields of infrastructure and agriculture, private sector leader Qatar Chamber announced. The Chamber’s First Vice Chairman, Mohamed Bin Towar Al-Kuwari, held a meeting with a delegation from Mali headed by Sedou Coulibaly, the President of CIRA.SA and Vice President of the patronat of Mali, as well as the Ambassador of the Republic of Mali to Qatar, Cheick Ahmed Tidiany. During the meeting, Coulibaly delivered a presentation on five investment projects in the fields of infrastructure and agriculture, as well as other sectors. Coulibaly called on Qatari investors to invest in these projects, which include the development of a 550 kilometer road linking Bamako and Senegal’s capital of Dakar with investments worth EUR185mn. (Gulf-Times.com) Alfardan Properties close to unveiling iconic tower in Lusail – Alfardan Properties, Qatar’s leading luxury real estate developer known for its portfolio of products and services, is months away from launching an iconic new tower in Marina District, Lusail, the award-winning city of the future. Plans are in place to present Burj Alfardan to the nation in 2Q2019, according to a statement. Burj Alfardan fits into Qatar National Vision 2030, which calls for prudent strategies and plans that help to increase competition, attract more investments, and stimulate growth in Qatar’s economy. (Gulf-Times.com) QFC’s CEO to represent ICC Qatar in Davos meeting – Qatar Financial Centre’s (QFC) CEO, Yousuf Mohamed Al-Jaida will represent the International Chamber of Commerce Qatar (ICC Qatar) in an annual meeting that takes place within the World Economic Forum (WEF) in Davos, Switzerland from January 22- 25. Al-Jaida will participate in the closed roundtable discussion on international trade and climate, titled ‘Global Dialogue on Trade’. (Gulf-Times.com) International UNCTAD: Global FDI skids 19% on Trump tax reform, may rebound in 2019 – Global foreign direct investment (FDI) fell 19% last year to an estimated $1.2tn, largely caused by US President, Donald Trump’s tax reforms, the United Nations trade and development agency, UNCTAD stated. FDI, comprising cross-border mergers and acquisitions (M&A), intra- company loans and investment in start-up projects abroad, is a bellwether of globalization and a potential sign of growth of corporate supply chains and future trade ties. However it can also go into reverse as companies pull investments out of foreign projects or repatriate earnings. The lowest net global FDI since 2009 was the result of US firms repatriating $300bn or more in accumulated earnings to take advantage of Trump’s tax break. Net investment flows into Europe slumped by an unprecedented 73% to $100bn, a level not seen since the 1990s, as US firms pulled years of profits out of affiliates in Ireland, Switzerland and elsewhere. UNCTAD Investment’s Chief, James Zhan told reporters that US repatriation of profits had slowed down and an FDI rebound was possible this year, but
- 4. Page 4 of 7 there were also growing risks. Zhan said, “It’s what we call the potential trade-investment-technology war that will affect global investment, and we see that the rising protectionist measures of a number of countries and the prospects for global economic growth are worsening.” The US remained the top destination for FDI in 2018, attracting $226bn, 18% less than in 2017. Second was China, up 3% to $142bn, and third was Britain, which saw 20% jump to $122bn, mainly due to a doubling of reinvested earnings and a tripling in the value of M&A deals. (Reuters) IMF fears trade war and weak Europe could trigger sharp global slowdown – The International Monetary Fund (IMF) cut its world economic growth forecasts for 2019 and 2020, due to weakness in Europe and some emerging markets, and stated failure to resolve trade tensions could further destabilize a slowing global economy. In its second downgrade in three months, the global lender also cited a bigger-than-expected slowdown in China’s economy and a possible ‘No Deal’ Brexit as risks to its outlook, saying these could worsen market turbulence in financial markets. The IMF predicted the global economy to grow at 3.5% in 2019 and 3.6% in 2020, down 0.2 and 0.1 percentage point respectively from last October’s forecasts. The new forecasts, released on the eve of this week’s gathering of world leaders and business executives in the Swiss ski resort of Davos, show that policymakers may need to come up with plans to deal with an end to years of solid global growth. The downgrades reflected signs of weakness in Europe, with its export powerhouse Germany hurt by new fuel emission standards for cars and with Italy under market pressure due to Rome’s recent budget standoff with the European Union. Growth in the Eurozone is set to moderate from 1.8% in 2018 to 1.6% in 2019, 0.3 percentage point lower than projected three months ago, IMF stated. IMF also cut its 2019 growth forecast for developing countries to 4.5%, down 0.2 percentage points from the previous projection and a slowdown from 4.7% in 2018. (Reuters) UK’s households gloomy for 2019, lower inflation eases near- term worries – British households’ hopes for their finances over the year ahead remain near a five-year low, due to growing concern about job security ahead of Brexit, though easing inflation pressures have offered some short-term cheer. IHS Markit stated its monthly Household Finances Index picked up to a three-month high in January, on the back of households’ perception that their living costs were rising at the slowest rate since October 2016. The official measure of consumer price inflation dropped to its lowest in nearly two years in December at 2.1%. However, households’ expectations for their finances over the year to come, when Britain is due to leave the European Union, remained close to their lowest level since early 2014. (Reuters) Japan’s firms wary of boosting investment amid intensifying trade war – Over a third of Japanese firms aim to raise capital expenditure in the fiscal year starting April, with many others worried about the impact on spending plans of a trade war between major markets China and the US, a Reuters survey showed. Tit-for-tat import tariffs and ensuing uncertainty have started to drag on global growth and hurt Japanese firms, particularly those with business in China. This has made many nervous about corporate investment, which before the trade war began last year had been a bright spot in Japan’s economy. Some 52% of respondents said they would not change their capital spending amounts next fiscal year versus this year, whereas 12% said they would cut. Meanwhile, 22% planned to increase investment, and 14% said they would do likewise, but only moderately. (Reuters) Regional MENA private equity set for another slow year despite positive long-term outlook – As the private equity industry in the MENA region closes a year of consolidation and slow fundraising in 2018, the alternative investment asset class is not expected to record many transactions in 2019, either. Amidst rising interest rates and tough global macro-economic conditions, corporate governance-related concerns mean the industry is bracing for more scrutiny by investors, according to analysts. However, the rising potential of fintech in the GCC and a likely economic recovery in both Saudi Arabia and the UAE are expected to give the industry a much-needed boost, with long-term prospects of the industry remaining positive, according to industry figures who have spoken to Zawya. “Regarding the MENA PE industry as a whole, we do not expect many more transactions (in 2019) given the lack of dry powder and the scarcity of new funds launched over the last few years,” Co-founder and CEO of Gulf Capital, Karim El Solh said. According to Preqin, which tracks data for alternative asset classes, there were 17 private equity- backed buyout deals in MENA region in 2018, which was the same number as in 2017, but considerably lower than completion numbers in 2016, 2015, and 2014, when 32, 31, and 46 deals were completed, respectively. Yet aggregate deal values jumped last year to $743mn, up from $350mn in 2017. (Zawya) IMF: Oil prices to average below $60 in 2019 & 2020 – International Monetary Fund (IMF) has projected average oil prices just below $60 per barrel for 2019 and 2020 in its update, World Economic Outlook (WEO). This is down from about $69 and $66, respectively, in the last WEO. Metals prices are expected to decrease 7.4% YoY in 2019, a deeper decline than anticipated last October, and to remain roughly unchanged in 2020. Price forecasts for most major agricultural commodities have been revised modestly downwards. (Peninsula Qatar) BofA Merrill Lynch: Non-OPEC oil supply set to keep growing in the medium term – Non-OPEC oil supply is set to keep growing in the medium term, BofA Merrill Lynch stated in a research report. Following the oil market collapse in 2014, long-dated prices reset from $90 in the earlier part of the decade to around $60 at the moment. The persistence of these lower prices has led to a great reduction in the amount of capital deployed in upstream oil and gas. As a reference, 2018 CAPEX is estimated at only 60% of the 2013 peak, BofA Merrill Lynch stated. This sharp reduction in spending has slowed down industry activity, with new project FIDs (final investment decision) declining steadily in OPEC and non-OPEC countries since the 2012 peak. Even then, project complexity, financial woes, and poor management have delayed some of the early decade FIDs. So production from some of these projects will now be realized over the next six years, helping drive non-OPEC supply higher, BofA Merrill Lynch noted. (Gulf-Times.com)
- 5. Page 5 of 7 NCB posts 8.8% YoY rise in net profit to SR10,667mn in FY2018 – The National Commercial Bank (NCB) recorded net profit of SR10,667mn in FY2018, an increase of 8.8% YoY. Total operating profit rose 3.2% YoY to SR18,927mn in FY2018. Total revenue for special commissions/investments rose 7.8% YoY to SR18,306mn in FY2018. Total assets stood at SR453.4bn at the end of December 31, 2018 as compared to SR444.8bn at the end of December 31, 2017. Loans and advances stood at SR265.3bn (+6.5% YoY), while customer deposits stood at SR318.7bn (+3.2% YoY) at the end of December 31, 2018. EPS came in at SR3.44 in FY2018 as compared to SR3.16 in FY2017. (Tadawul) Fawaz Alhokair Group's mall unit files for IPO, offering in 2Q2019 – Saudi Arabia’s Fawaz Alhokair Group plans to offer shares in its shopping malls business in Riyadh in the second quarter of this year, according to sources. Arabian Centres Company, which has applied for an IPO with the Capital Market Authority, is eyeing a listing between April and June, sources added. Saudi Arabia is encouraging more family-owned companies to list in a bid to deepen capital markets under an economic reform push aimed at reducing the Kingdom’s reliance on oil revenues. The deal comes more than a year after Fawaz Alhokair, a major shareholder in Fawaz Alhokair Group, became the subject of an anti-graft probe by Saudi Arabian authorities under which dozens of senior officials and businessmen were detained at Riyadh’s Ritz Carlton Hotel in late 2017. Under the deal, Arabian Centres Company is looking to sell 30% to investors on the Tadawul. The group is working with US investment banks Morgan Stanley and Moelis, and Saudi Arabian investment banks Samba Financial Group, and National Commercial Bank, sources added. (Reuters) Saudi Aramco, DEWA sign MoU to collaborate on power management – Saudi Aramco and Dubai Electricity & Water Authority (DEWA) have signed a memorandum of understanding (MoU) to foster collaboration in power supply and demand management, according to an emailed statement. The MoU will also create framework to assess potential collaborations, ventures in new energy and smart grid applications and digital transformation. (Bloomberg) Saudi Arabia’s crude oil exports rise to 8.235mn bpd in November – Saudi Arabia’s crude oil exports rose 6.9% to 8.235mn bpd in November from 7.701mn bpd in October, representing a rise of 17.4% YoY. Saudi Arabia produced 11.093mn bpd of crude oil in November. Crude oil output rose 4.2% from 10.642mn bpd in October, representing a rise of 12.2% YoY. Refinery intake rose 0.7% to 2.836mn bpd in November, representing a rise of 2.1% YoY. Use at non- refineries such as power plants fell 1.5% to 0.328mn bpd in November, representing a rise of 7.9% YoY. Closing stocks fell by 9.162mn barrels to 208.218mn barrels in November. In January-November, crude oil output grew 3.3% from same period year ago to 3,435.862mn barrels. In January-November, refinery intake grew 2.4% from the same period a year ago to 881.881mn barrels. In January-November, use of crude oil at non-refineries fell by 13.1% from same period year ago to 138.456mn barrels. Saudi Arabia exported 2,452.327mn barrels of crude oil in January-November, representing a rise of 5.5% YoY. (Bloomberg) UAE billionaire's firm raises $470mn loan – Abu Dhabi’s Bin Butti International Holdings LLC, which has investments spanning logistics, travel and retail, raised almost $500mn in a dual-tranche loan. The company, which is owned by billionaire Nasser Butti Al Muhairi, raised a $471mn seven-year syndicated loan through its Advance Facilities Management unit, it stated. The funds were raised in Dollars and Dirhams. Bin Butti International, which manages more than AED5bn of assets, consolidated and increased its existing loan facilities and extended maturities. Noor Bank was the lead arranger and book runner for the loan. Emirates NBD, Commercial Bank of Dubai, National Bank of Fujairah, Al Khaliji, United Arab Bank, HSBC Holdings and United Bank Ltd. also participated in the financing.“Expanding the repayment structure and matching maturities with the future cash flows will help ease the liquidity position," Chairman, Nasser Bin Butti said. (Bloomberg) Mashreqbank posts 0.4% YoY rise in net profit to AED2060.2mn in FY2018 – Mashreqbank recorded net profit of AED2,060.2mn in FY2018, an increase of 0.4% YoY. Net interest income and net income from Islamic products rose 1.8% YoY to AED3,643.1mn in FY2018. Operating income fell 1.3% YoY to AED5,938.3mn in FY2018. Total assets stood at AED139.9bn at the end of December 31, 2018 as compared to AED125.2bn at the end of December 31, 2017. Loans and advances measured at amortized cost stood at AED56.4bn (+5.5% YoY), while customers’ deposits stood at AED72.5bn (+4.5% YoY) at the end of December 31, 2018. EPS came in at AED11.60 in FY2018 as compared to AED11.56 in FY2017. (DFM) Dubai property developers put bond plans on hold – Dubai’s Emaar Properties and state-owned developer Nakheel have put plans to issue US Dollar-denominated bonds on hold, Emaar Properties and sources familiar with the bond issues stated. The firms had planned Dollar-denominated Sukuk and would have had to pay a yield premium to attract enough investors due to concerns about Dubai’s property price slide and emerging market volatility, sources said. Dubai property prices have fallen since a mid-2014 peak hurt by weaker oil prices and muted sales, although the slide has not come close to the more than 50% drop in 2009-2010, which pushed Dubai close to a debt default. Residential prices fell 6% to 10% in 2018 and are expected to drop 5% to 10% more this year, Savills stated. This has hit earnings, with a 29% fall in Emaar Properties’ third quarter last year and 68% drop at Dubai’s second-largest listed developer DAMAC. The financial sources said that Emaar Properties and Nakheel hired banks a few months ago to issue Islamic bonds but shelved the plans. (Reuters) Aldar Properties waiting for right market conditions to IPO investment unit – Aldar Properties is ready for a public offering of its investments unit and is waiting for the right market conditions, its CEO, Talal Al Dhiyebi said. “Today we are market-ready. The question is when the market will be ready for us,” he said. Abu Dhabi’s biggest developer in September formed Aldar Investment Properties, with $5.4bn in revenue- generating assets. The move followed Emaar Properties spin-off of its development unit and listing on the stock market in Dubai. (Bloomberg)
- 6. Page 6 of 7 ADNOC to plan restart for damaged RFCC unit in February – Abu Dhabi National Oil Company (ADNOC) plans to restart production at a residue fluid catalytic cracker in early February, according to sources. Commissioning now in progress after earlier plan to restart unit in November was delayed by technical problems. (Bloomberg) Kuwait’s budget to boost spending to spur growth – Kuwait announced a state budget for the year ending on March 31, 2020, projecting a 4.7% rise in spending to KD22.5bn to drive economic growth. Kuwait’s Finance Minister, Nayef Al-Hajraf said that he expects the average oil price to range in between $55 to $65 per barrel, higher than the projected $50 a barrel in its last budget. The budget deficit in the new fiscal year was projected at KD7.7bn after accounting for a deposit of 10% of total revenue into the sovereign wealth fund. The deficit was 2.1% lower than the 2018-2019 budget, according to the budget statement. (Reuters) Kuwait crude oil exports rise to 2.07mn bpd in November – Kuwait’s oil exports rose 0.6% MoM from 2.058m bpd in October to 2.07mn bpd in November, representing a rise of 2.2% YoY. Kuwait produced 2.73mn bpd of crude oil in November. Crude oil output fell 0.1% from 2.733mn bpd in October, representing a rise of 0.9% YoY. Refinery intake fell 2.3% to 0.65mn bpd in November, representing a fall of 4.4% YoY. In January- November, crude oil output grew 3.3% from same period year ago to 1,471.390mn barrels. In January-November, refinery intake fell 1.1% from same period year ago to 224.066mn barrels. Kuwait exported 683.3mn barrels of crude oil in January-November, representing a rise of 1.9% YoY. (Bloomberg) Bahrain sells BHD70mn 91-day bills; bid-cover at 1.15x – Bahrain sold BHD70mn of bills due April 24. Investors offered to buy 1.15 times the amount of securities sold. The bills were sold at a price of 98.938, having a yield of 4.25% and will settle on January 23. (Bloomberg)
- 7. Contacts Saugata Sarkar, CFA, CAIA Shahan Keushgerian Zaid al-Nafoosi, CMT, CFTe Head of Research Senior Research Analyst Senior Research Analyst Tel: (+974) 4476 6534 Tel: (+974) 4476 6509 Tel: (+974) 4476 6535 saugata.sarkar@qnbfs.com.qa shahan.keushgerian@qnbfs.com.qa zaid.alnafoosi@qnbfs.com.qa QNB Financial Services Co. W.L.L. Contact Center: (+974) 4476 6666 PO Box 24025 Doha, Qatar Disclaimer and Copyright Notice: This publication has been prepared by QNB Financial Services Co. W.L.L. (“QNBFS”) a wholly-owned subsidiary of Qatar National Bank (Q.P.S.C.). QNBFS is regulated by the Qatar Financial Markets Authority and the Qatar Exchange. Qatar National Bank (Q.P.S.C.) is regulated by the Qatar Central Bank. This publication expresses the views and opinions of QNBFS at a given time only. It is not an offer, promotion or recommendation to buy or sell securities or other investments, nor is it intended to constitute legal, tax, accounting, or financial advice. QNBFS accepts no liability whatsoever for any direct or indirect losses arising from use of this report. Any investment decision should depend on the individual circumstances of the investor and be based on specifically engaged investment advice. We therefore strongly advise potential investors to seek independent professional advice before making any investment decision. Although the information in this report has been obtained from sources that QNBFS believes to be reliable, we have not independently verified such information and it may not be accurate or complete. QNBFS does not make any representations or warranties as to the accuracy and completeness of the information it may contain, and declines any liability in that respect. For reports dealing with Technical Analysis, expressed opinions and/or recommendations may be different or contrary to the opinions/recommendations of QNBFS Fundamental Research as a result of depending solely on the historical technical data (price and volume). QNBFS reserves the right to amend the views and opinions expressed in this publication at any time. It may also express viewpoints or make investment decisions that differ significantly from, or even contradict, the views and opinions included in this report. This report may not be reproduced in whole or in part without permission from QNBFS. COPYRIGHT: No part of this document may be reproduced without the explicit written permission of QNBFS. Page 7 of 7 Rebased Performance Daily Index Performance Source: Bloomberg Source: Bloomberg Source: Bloomberg ( # Market was closed on January 21, 2019) Source: Bloomberg (*$ adjusted returns, # Market was closed on January 21, 2019) 45.0 70.0 95.0 120.0 Dec-14 Dec-15 Dec-16 Dec-17 Dec-18 QSE Index S&P Pan Arab S&P GCC 0.2% (0.4%) 0.1% 0.2% (0.6%) (0.4%) (0.6%) (1.0%) (0.5%) 0.0% 0.5% SaudiArabia Qatar Kuwait Bahrain Oman AbuDhabi Dubai Asset/Currency Performance Close ($) 1D% WTD% YTD% Global Indices Performance Close 1D%* WTD%* YTD%* Gold/Ounce 1,275.90 (0.5) (0.5) (0.5) MSCI World Index 2,000.77 0.0 0.0 6.2 Silver/Ounce 15.27 (0.5) (0.5) (1.5) DJ Industrial# 24,706.35 0.0 0.0 5.9 Crude Oil (Brent)/Barrel (FM Future) 62.74 0.1 0.1 16.6 S&P 500# 2,670.71 0.0 0.0 6.5 Crude Oil (WTI)/Barrel (FM Future)# 53.80 0.0 0.0 18.5 NASDAQ 100# 7,157.23 0.0 0.0 7.9 Natural Gas (Henry Hub)/MMBtu# 3.43 0.0 0.0 7.6 STOXX 600 356.36 (0.1) (0.1) 4.8 LPG Propane (Arab Gulf)/Ton# 68.75 0.0 0.0 8.3 DAX 11,136.20 (0.5) (0.5) 4.8 LPG Butane (Arab Gulf)/Ton# 67.12 0.0 0.0 (4.1) FTSE 100 6,970.59 0.1 0.1 4.8 Euro 1.14 0.0 0.0 (0.9) CAC 40 4,867.78 (0.1) (0.1) 2.1 Yen 109.67 (0.1) (0.1) (0.0) Nikkei 20,719.33 0.4 0.4 4.2 GBP 1.29 0.2 0.2 1.1 MSCI EM 1,018.45 0.0 0.0 5.5 CHF 1.00 (0.2) (0.2) (1.6) SHANGHAI SE Composite 2,610.51 0.3 0.3 5.9 AUD 0.72 (0.1) (0.1) 1.6 HANG SENG 27,196.54 0.4 0.4 5.1 USD Index# 96.34 0.0 0.0 0.2 BSE SENSEX 36,578.96 0.6 0.6 (0.7) RUB 66.39 0.2 0.2 (4.8) Bovespa 96,009.77 0.1 0.1 12.5 BRL# 0.27 0.0 0.0 3.4 RTS 1,171.09 (0.5) (0.5) 9.6 87.5 83.0 79.4