Analysis and Damping of Inter-Area Oscillations in the UCTE/CENTREL Power System
•
0 likes•36 views

This paper concerns steady state stability of the UCTE/CENTREL power system in order to maintain reliability of system operation in the future environment of the electricity sector given by further system extensions and open market. To this aim Inter-Area Oscillation are analysed using recordings of a Wide Area Measuring System (WAMS) and a detailed dynamic model of the UCTE/CENTREL power system. The model is validated by comparing eigenvectors, frequency and damping of inter-area modes resulting from its eigenvalue analysis and from signal decomposition using Prony analysis of the recordings.
![connected systems and/or high transmission load
led to stability problems [1], [2] and [3].
Inter-area oscillations can severely restrict
system operations by requiring the
curtailment of electric power transfers as an op-
erational measure. These oscillations can also
lead to widespread system disturbances if cas-
cading outages of transmission lines occur due to
oscillatory power swings, like during the black out
in western North America on August 10, 1996, [4].
Therefore in large interconnected power systems
understanding its global stability behaviour is an
important aspect both in system planning and op-
eration. After expansion of the UCTE system by
CENTREL (Poland, the Czech Republic, Slovakia
and Hungary) power system stability has an in-
creasing importance also in the TransEuropean
Synchronously Interconnected System (TESIS).
Recordings of a Wide Area Measuring System
(WAMS) have shown significant changes of the
dynamic system behaviour, which in principle were
predicted by the simulation studies carried out
before [5] - sometimes poorly damped low fre-
quency power swings were indicated.
As the physical phenomena involved in inter-area
oscillations extend over the whole geographical
area spanned by the power system, a competent
approach requires the dynamic analysis of the
complete interconnected power system on the
basis of an international co-operation of the TSO’s
(Transmission System Operator). The main topics
are
♦ implementation and operating WAMS for re-
cording inter-area oscillations
♦ provision of the relevant dynamic network data
♦ time simulation and eigenvalue analysis
♦ co-ordinated specification of system parame-
ters and control devices, e.g. PSS, FACTS.
Considering further possible expansions of TESIS
by the networks of Bulgaria, Romania, the West-
Ukrainian Island, the Mediterranean Ring and the
development of open electricity market the system
stability will become more and more important.
This paper aims improving the present dynamic
system behaviour of TESIS as a necessary meas-
ure to maintain security of system operation in the
future process in the European electricity sector.
2. Evaluation of Inter-Area Oscillations
2.1 Wide Area Measuring System
The present status of the implementation of WAMS
is given in Fig. 1. More than thirty devices for re-
cording frequency and power flows at the individ-
ual locations are installed in 400 kV and 220 kV
substations spread over the TESIS system. Each
recording device receives a GPS time signal in
Fig. 1 Wide Area Measuring System (WAMS)
order to show all recordings using the same time
reference. A lot of recordings of Inter-Area-
Oscillations were collected from WAMS, which are
mostly excited by power plant outages or failures
in the 220 kV or 400 kV voltage level of the trans-
mission grid.
Fig. 2 shows as a typical example inter-area oscil-
lations after a power plant outage in Spain. Imme-
diately after the power plant outage the frequency
decreases in the proximity of the outage (Spain).
The decreasing of the frequency spreads over the
whole system and finally reaches Poland and
Hungary with a time delay of about 1.5 s.
Due to this phenomena there occur transiently
different frequency deviations across the system
causing frequency oscillations mainly at the most
outer areas: Hungary/Poland and Spain respec-
tively. The frequency oscillations are quite in phase
opposition, what means that the most outer areas
are swinging against each other and due to this
periodically exchanging kinetic energy from one
side to the other side. This causes electric power
oscillations in the transmission system, see Fig. 2.
The frequency of the observed inter-area oscilla-
tions is in the range from 0.22 to 0.26 Hz and in
most cases the damping is sufficient. In some
cases however only poor damping was detected,
which has to be observed with regard to reliable
system operation. Fig. 3 shows an inter-area os-
cillation caused by a 220 kV short circuit followed
by load outage in Spain. The damping is very poor
in this case, because the amplitude of frequency
and power oscillation does not decrease signifi-
cantly during the first ten oscillation periods.
)))))))))))))))
) ) ) ) ) ) ) ) ) ) ) ) ) ) ) ) ) )
)
)
)
)
)))
)))
)
)
)
(
(
(
(
(
(
(
(
(
(
(
(
(
(
(
(
(
(
(
(
(
(
(
(
(
(
(
(
(
(
((
...
)))
)
)
)
)
)
)
)
)
(
(
(
(
(
(
(
(
(
(
(
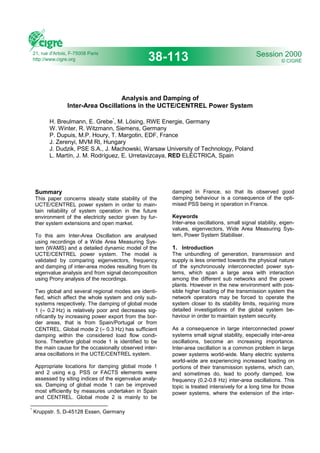
measuring device
island operation](data:image/gif;base64,R0lGODlhAQABAIAAAAAAAP///yH5BAEAAAAALAAAAAABAAEAAAIBRAA7)
Recommended
Recommended
More Related Content
What's hot
What's hot (18)
Similar to Analysis and Damping of Inter-Area Oscillations in the UCTE/CENTREL Power System
Similar to Analysis and Damping of Inter-Area Oscillations in the UCTE/CENTREL Power System (20)
More from Power System Operation
More from Power System Operation (20)
Recently uploaded
Recently uploaded (20)
Analysis and Damping of Inter-Area Oscillations in the UCTE/CENTREL Power System
- 1. Analysis and Damping of Inter-Area Oscillations in the UCTE/CENTREL Power System H. Breulmann, E. Grebe* , M. Lösing, RWE Energie, Germany W. Winter, R. Witzmann, Siemens, Germany P. Dupuis, M.P. Houry, T. Margotin, EDF, France J. Zerenyi, MVM Rt, Hungary J. Dudzik, PSE S.A., J. Machowski, Warsaw University of Technology, Poland L. Martín, J. M. Rodríguez, E. Urretavizcaya, RED ELÉCTRICA, Spain * Kruppstr. 5, D-45128 Essen, Germany Summary This paper concerns steady state stability of the UCTE/CENTREL power system in order to main- tain reliability of system operation in the future environment of the electricity sector given by fur- ther system extensions and open market. To this aim Inter-Area Oscillation are analysed using recordings of a Wide Area Measuring Sys- tem (WAMS) and a detailed dynamic model of the UCTE/CENTREL power system. The model is validated by comparing eigenvectors, frequency and damping of inter-area modes resulting from its eigenvalue analysis and from signal decomposition using Prony analysis of the recordings. Two global and several regional modes are identi- fied, which affect the whole system and only sub- systems respectively. The damping of global mode 1 (≈ 0.2 Hz) is relatively poor and decreases sig- nificantly by increasing power export from the bor- der areas, that is from Spain/Portugal or from CENTREL. Global mode 2 (≈ 0.3 Hz) has sufficient damping within the considered load flow condi- tions. Therefore global mode 1 is identified to be the main cause for the occasionally observed inter- area oscillations in the UCTE/CENTREL system. Appropriate locations for damping global mode 1 and 2 using e.g. PSS or FACTS elements were assessed by siting indices of the eigenvalue analy- sis. Damping of global mode 1 can be improved most efficiently by measures undertaken in Spain and CENTREL. Global mode 2 is mainly to be damped in France, so that its observed good damping behaviour is a consequence of the opti- mised PSS being in operation in France. Keywords Inter-area oscillations, small signal stability, eigen- values, eigenvectors, Wide Area Measuring Sys- tem, Power System Stabiliser. 1. Introduction The unbundling of generation, transmission and supply is less oriented towards the physical nature of the synchronously interconnected power sys- tems, which span a large area with interaction among the different sub networks and the power plants. However in the new environment with pos- sible higher loading of the transmission system the network operators may be forced to operate the system closer to its stability limits, requiring more detailed investigations of the global system be- haviour in order to maintain system security. As a consequence in large interconnected power systems small signal stability, especially inter-area oscillations, become an increasing importance. Inter-area oscillation is a common problem in large power systems world-wide. Many electric systems world-wide are experiencing increased loading on portions of their transmission systems, which can, and sometimes do, lead to poorly damped, low frequency (0.2-0.8 Hz) inter-area oscillations. This topic is treated intensively for a long time for those power systems, where the extension of the inter- 21, rue d'Artois, F-75008 Paris http://www.cigre.org Session 2000 © CIGRÉ38-113
- 2. connected systems and/or high transmission load led to stability problems [1], [2] and [3]. Inter-area oscillations can severely restrict system operations by requiring the curtailment of electric power transfers as an op- erational measure. These oscillations can also lead to widespread system disturbances if cas- cading outages of transmission lines occur due to oscillatory power swings, like during the black out in western North America on August 10, 1996, [4]. Therefore in large interconnected power systems understanding its global stability behaviour is an important aspect both in system planning and op- eration. After expansion of the UCTE system by CENTREL (Poland, the Czech Republic, Slovakia and Hungary) power system stability has an in- creasing importance also in the TransEuropean Synchronously Interconnected System (TESIS). Recordings of a Wide Area Measuring System (WAMS) have shown significant changes of the dynamic system behaviour, which in principle were predicted by the simulation studies carried out before [5] - sometimes poorly damped low fre- quency power swings were indicated. As the physical phenomena involved in inter-area oscillations extend over the whole geographical area spanned by the power system, a competent approach requires the dynamic analysis of the complete interconnected power system on the basis of an international co-operation of the TSO’s (Transmission System Operator). The main topics are ♦ implementation and operating WAMS for re- cording inter-area oscillations ♦ provision of the relevant dynamic network data ♦ time simulation and eigenvalue analysis ♦ co-ordinated specification of system parame- ters and control devices, e.g. PSS, FACTS. Considering further possible expansions of TESIS by the networks of Bulgaria, Romania, the West- Ukrainian Island, the Mediterranean Ring and the development of open electricity market the system stability will become more and more important. This paper aims improving the present dynamic system behaviour of TESIS as a necessary meas- ure to maintain security of system operation in the future process in the European electricity sector. 2. Evaluation of Inter-Area Oscillations 2.1 Wide Area Measuring System The present status of the implementation of WAMS is given in Fig. 1. More than thirty devices for re- cording frequency and power flows at the individ- ual locations are installed in 400 kV and 220 kV substations spread over the TESIS system. Each recording device receives a GPS time signal in Fig. 1 Wide Area Measuring System (WAMS) order to show all recordings using the same time reference. A lot of recordings of Inter-Area- Oscillations were collected from WAMS, which are mostly excited by power plant outages or failures in the 220 kV or 400 kV voltage level of the trans- mission grid. Fig. 2 shows as a typical example inter-area oscil- lations after a power plant outage in Spain. Imme- diately after the power plant outage the frequency decreases in the proximity of the outage (Spain). The decreasing of the frequency spreads over the whole system and finally reaches Poland and Hungary with a time delay of about 1.5 s. Due to this phenomena there occur transiently different frequency deviations across the system causing frequency oscillations mainly at the most outer areas: Hungary/Poland and Spain respec- tively. The frequency oscillations are quite in phase opposition, what means that the most outer areas are swinging against each other and due to this periodically exchanging kinetic energy from one side to the other side. This causes electric power oscillations in the transmission system, see Fig. 2. The frequency of the observed inter-area oscilla- tions is in the range from 0.22 to 0.26 Hz and in most cases the damping is sufficient. In some cases however only poor damping was detected, which has to be observed with regard to reliable system operation. Fig. 3 shows an inter-area os- cillation caused by a 220 kV short circuit followed by load outage in Spain. The damping is very poor in this case, because the amplitude of frequency and power oscillation does not decrease signifi- cantly during the first ten oscillation periods. ))))))))))))))) ) ) ) ) ) ) ) ) ) ) ) ) ) ) ) ) ) ) ) ) ) ) ))) ))) ) ) ) ( ( ( ( ( ( ( ( ( ( ( ( ( ( ( ( ( ( ( ( ( ( ( ( ( ( ( ( ( ( (( ... ))) ) ) ) ) ) ) ) ) ( ( ( ( ( ( ( ( ( ( ( measuring device island operation
- 3. 2.2 Influence of Global Load Flow on Sys- tem Damping At certain times at which inter-area oscillations were recorded by WAMS the power exchanges between countries were analysed with regard to the relation of damping of inter-area oscillation and the global load flow situation. Though only few cases with poor system damping occurred, their analysis indicate, that power export from the most outer areas decreases damping of inter-area os- cillations, what was predicted from previous simu- lation studies [5], [6] and [7]. This relationship between damping and load flow situation is confirmed by comparing the recordings in Fig. 2 and Fig. 3. Every power plant outage in Spain causes a power flow from the centre area to Spain, because the needed primary control re- serve is activated by all partners in order to com- pensate the outage deficit. This leads to increasing power flow from the centre to Spain after the out- age of 900 MW, which contributes to the good damping in Fig. 2. On the other side the load outage in Spain leads to a regional surplus and consequently to an addi- tional export from Spain. In total the export from Spain relating the poor damping in Fig. 3 was about 800 MW, because there was an export of about 300 MW before the load outage of about 500 MW. It is obvious from the recordings that further inves- tigations are necessary to improve system damp- ing. This is an important goal not only to ensure reliable system operation but also to improve transmission capacity of the grid with the existing high voltage lines. 2.3 Prony Analysis of WAMS Recordings Prony analysis is a methodology that extends Fou- rier analysis by directly estimating the frequency, damping, strength, and relative phase of the modal components present in any signal. The method decomposes the signal into its dominant modes of oscillation. The method provides complex eigen- values and the associated eigenvector compo- nents. Real and imaginary parts of eigenvalues are proportional to the modes’ damping and frequency, respectively. Several WAMS recordings were analysed using a specified software tool [8]. A set of the more rele- vant are summarised here: A) Load outage in Spain, 16/12/97, see Fig. 3 B) Generation trip in Spain, 17/01/97, see Fig.2 C) Presumable short circuit, 17/08/98 at 17:56, location unknown Table I shows the predominant oscillation modes summary that were found in the WAMS recordings using the Prony analysis (damping in brackets). The Prony analysis of the WAMS recordings shows that there are two main oscillation modes: • Around 0.25 Hz, detected in all the countries of this study. • Around 0.35 Hz, detected in France, Hungary and Poland. Table I Predominant modes and damping of the WAMS recordings in the studied cases In general, almost all the oscillation modes are well damped. There are exceptions of modes poorly damped in case of high load flow from Spain to France, caused by the load outage in Spain, case A. The computed unstable mode is not realistic, because in practice only long lasting oscillations but no increasing amplitude occurred. This nu- merical effect may be caused by insufficient time interval for the Prony analysis. 3. Dynamic Modelling of the UCTE/ CENTREL Power System 3.1 Model Description The model is dedicated to the steady state analy- sis and represents accurately all the power system components involved in physical phenomena of inter-area oscillations. Almost the complete 220/400 kV transmission grid of UCTE/CENTREL is represented using a specific software package for power system simulation [9] and [10]. The dy- namic model contains 2300 transmission lines 820 transformers 400kV/220 kV 380 generators Typical load-flow situations obtained from real-time operation were considered. In order to limit the model size, all the units of one generation site are aggregated in one machine, which is valid as far as small-signal stability studies are concerned. The dynamic data, that is the generator characteristics, the excitation controllers, the power system stabi- lisers, the turbine characteristics and the gover- nors, are mostly described by detailed models in accordance with the IEEE standard, [11] and [12]. Special care was given to the modelling of the so called four loops controller using the rotation speed, active and mechanical power as stabilising Case A Case B Case C 0.25 Hz (7.4%) Spain 0.20 Hz (-0.7%) 0.26 Hz (4,5%) 0.29 Hz (15.0%) 0.24 Hz (8.9%) 0.36 Hz (3.9%) France 0.42 Hz (7.0%) 0.26 Hz (3.1%) Germany 0.25 Hz (8,5%) 0.26 Hz (11,6%) 0.24 Hz (3,0%) Slovakia 0.26 Hz (6.0%) 0.25 Hz (13.0%) Hungary 0.35 Hz (8.3%) 0.25 Hz (7.3%) 0.25 Hz (10.5%) Poland 0.35 Hz (6.0%) 0.24 Hz (7.2%)
- 4. Fig. 2 Inter-Area Oscillation after Power Plant Outage in Spain, 900MW Fig. 4 Simulation of Power Plant Outage in Spain, 900 MW Fig. 3 Inter-Area Oscillation after Load Outage in Spain, 487 MW Fig. 5 Simulation of Load Outage in Spain, 500MW signals, that equip a significant number of genera- tion units with a great positive influence on damp- ing of inter-area oscillations. In the analysis the controllers of CENTREL were at first considered with their origin settings before activities for optimising were undertaken. The effect of parameter optimising on system behaviour is taken into account in chapter 5. 3.2 Model Validation The model could be validated by the recordings collected from WAMS. As an example Fig. 4 and Fig. 5 show the simulation results after power plant outage and load outage in Spain respectively, which have to be compared with the recordings in Fig. 2 and Fig. 3. It can be concluded that the model represents the real system behaviour with sufficient accuracy regarding the analysis of inter- area oscillations. The dynamic characteristics of power flows and frequencies at different locations are in well accordance with the recordings, espe- 16.12.97; 16:19:... 49,92 49,93 49,94 49,95 49,96 49,97 35,5 55,5 15,5 35,5 55,5 15,5 35,5 55,5 15,5 35,5 55,5 time f [Hz] -900 -850 -800 -750 -700 -650 -600 P [MW] f ≈ 0.22 Hz active power: Vigy (France) - Uchtelfangen (Germany) (one 400-kV-system) frequency: Cantegrit (France, near Spain) frequency: Uchtelfangen (Germany, near France) Spain Poland Germany (border to France) active power France-Germany (one 400-kV system 0 3 6 9 12 15 seconds 15 5 -5 -15 -25 -35 -45 -55 -65 -75 -∆∆∆∆f [mHz] -20 -10 0 10 20 30 0 10 20 30 40 seconds ∆∆∆∆f [mHz] -100 -50 0 50 100 150 200 ∆∆∆∆P [MW] France (Border to Spain) Germany (Border to France) frequency active power Germany - France 49,93 49,94 49,95 49,96 49,97 49,98 49,99 50,00 50,01 50,02 33 35 37 39 41 43 45 47 time f [Hz] -600 -500 -400 -300 -200 -100 0 P [MW] Spain France Germany (border to France) Germany (east) Hungary Poland f = 0 26 Hz 17.01.97;01:38:... active power: Vigy (France) - Uchtelfangen (Germany) (one 400-kV-system) frequencies
- 5. cially the oscillation frequency, amplitude and damping of the physical quantities. Particularly the model represents the influence of the global load flow situation on system damping. The stability limit of the system, which is very sen- sitive to parameter variations and therefore re- quires a high accuracy of the model for its deter- mination, is approximately the same in the real system and in the model, see Fig. 3 and Fig. 5. From the time behaviour point of view the dynamic model is a reliable basis for further investigations. The reliability of the model will also be confirmed by comparison of the results of the Prony analysis of recordings and the computed eigenvalues of the dynamic model in chapter 4. 4. Eigenvalue Analysis Eigenvalue or Modal analysis is a powerful tool to investigate interarea oscillations in large power systems as it indicates the dynamic properties of the whole system by one single simulation per load flow scenario. Different modes, which are mixed with each other in curves of time domain simula- tion, are identified separately. It is indicated, which generator coherent groups swing against each other and which generators play a significant role and which not [13]. Furthermore information can be derived regarding the most effective sites of controllers, retuning existing ones or installing ad- ditional ones, taking into account the observability and the controllability. On the other hand Modal analysis describes the small signal behaviour of the system, i.e. the behaviour linearised around one operating point, and does not take into ac- count the non-linear behaviour of e.g. controllers at large system perturbations. Therefore time domain simulation and Modal analysis in the frequency domain complement each other in dynamic analy- sis of power systems. For a better understanding the results are given as frequency and relative damping for each oscillatory mode. Given an oscillatory mode: ωσ js += (1/second), the damping ratio (or relative damping) is defined by 22 / ωσσζ +−= . A damping ratio of 5% means that in 3 oscillation periods the amplitude is damped to about 32 % of its initial value. The minimum acceptable level of damping is not clearly known. A damping ratio less than 3% must be accepted with caution. Damping is considered adequate if all electromechanical modes have a predicted damping ratio of at least 5%. In addition to the value of the damping ratio the sensitivity to variations in operation conditions and system parameters is important [1]. In the following mode distribution charts the isoline of ζ = 5% is given as a reference. 4.1 Inter-Area Modes in the UCTE/ CENTREL System Four dominant inter-area swing modes in the low frequency range between 0.2 and 0.5 Hz have been identified. A loadflow scenario with a power flow of 350 MW from Spain to France and of 1300 MW from CENTREL to UCTE has been as- sumed as the base case for this investigation. The geographical mode shape of the four modes is given in Fig. 6 to 9. The mode distribution can be taken from Fig. 10a. For global mode 1, which is the mode with the lowest system frequency of appr. 0.2 Hz, the west- ern part of the system formed by the generators in Spain and Portugal swings against the eastern part mainly formed by the CENTREL machines (Fig. 6). Along a line from Belgium, the western border of Germany, Swiss and Italy the oscillation cannot be observed, at this border of the oscillation the fre- quency deviation is minimum. The damping of the global mode 1 is relatively weak (3.7%) for the given loadflow scenario. Three coherent groups participate in the second inter-area mode (global mode 2) with a frequency of about 0.3 Hz (Fig. 7): Spain and Portugal, form- ing the first group, are almost in phase with the group of CENTREL and eastern parts of Germany and Austria. The centre of Europe (France, Italy, Switzerland and the western parts of Germany and Austria) forming the third group is in phase opposi- tion to these two coherent structures. The maxi- mum rotor speed deviation is given for some polish generators. The damping of global mode 2 (8.9%) is much better than for mode 1. Besides these two global modes, where almost the whole UCTE/CENTREL system is involved, fur- thermore regionally restricted oscillations are in- herent to the interconnected power system. At a frequency of appr. 0.5 Hz mainly the genera- tors in Poland and Hungary are forming the so called CENTREL mode (Fig. 8), which is this weakly damped (2.3%) due to the assumed load flow condition within CENTREL. While the ma- chines in parts of Austria, Slovakia and Italy con- tribute partly to the rest of the UCTE system is almost not involved in this mode. Close to 0.4 Hz a so called North-South mode can be observed (Fig. 9). The two coherent groups are formed by Belgium, the Netherlands, northern parts of Germany and Denmark on the one hand and by Italy, Austria and Hungary on the other hand. As for the Italian system only standard dy- namic parameters were used, the damping value of this mode is a rough estimation. However the
- 6. Fig. 6 Geographical Mode Shape Global Mode 1 Fig. 7 Geographical Mode Shape Global Mode 2 analysis shows that this mode is not critical for east-west transits in the UCTE/CENTREL system but has to be observed carefully for future load flow transits from north to south e.g. by new inter- connections from Scandinavia (NORDEL). 4.1 Impact of Loadflow Variation on Global Mode 1 and 2 As indicated in chapter 2.2 the damping of the interarea modes is influenced by the global load- flow in the system. To investigate the influence the loadflow from the border to the centre of the sys- tem had been varied. Fig. 10 gives the mode shift (a) for an additional transit of 1100 MW from CENTREL to the centre of the UCTE (base case: 1300 MW CENTREL/UCTE, 350 MW Spain/France) and (b) for the variation of the loadflow between Spain and France from 400 MW France to Spain to 800 MW Spain to France (1300 MW CENTREL/UCTE). Increasing the transit from CENTREL to UCTE decreases the damping of the CENTREL mode significantly and of global mode 1 slightly. Global Fig. 8 Geographical Mode Shape CENTREL Mode Fig. 9 Geographical Mode Shape North-South Mode a) b) Fig. 10 Mode Shift due to Global Loadflow Variation Hz Global Mode 2 Isoline ζζζζ = 5% -0,5 North-South Mode CENTREL Mode 0,1 0,2 0,3 0,4 0,5 Global Mode 1 Hz Mode 2 Isoline ζζζζ = 5% -0,5 North-South CENTREL 0,1 0,2 0,3 0,4 0,5 Mode 1
- 7. mode 2 and the North-South mode are almost not affected. The details are given in Table II. Table II Mode Shift due to increased Transit from CENTREL to UCTE f Global Mode 1 0.21 Hz Global Mode 2 0.31 Hz Centrel Mode 0.52 Hz North- South Mode 0.39 Hz Scenario ζ [%] ζ [%] ζ [%] ζ [%] Base case 3.7 8.9 2.3 5.1 2400 MW CENTREL à UCTE 3.2 8.9 1.0 4.7 Loadflow variation between Spain and France affects mainly the global inter-area modes. While mode 2 shows always sufficient damping > 5%, damping of mode 1 decreases significantly with increasing loadflow from the border to the centre of the system, i.e. from Spain to France. The other modes are almost not affected by this loadflow variation. The details can be taken from Table III. Table III Mode Shift due to Loadflow Variation between Spain and France f Global Mode 1 0.21 Hz Global Mode 2 0.31 Hz Centrel Mode 0.52 Hz North- South Mode 0.39 Hz Scenario ζ [%] ζ [%] ζ [%] ζ [%] 400 MW France à Spain 5.9 9.3 3.0 5.2 150 MW Spain à France 4.2 9.0 2.7 5.1 800 MW Spain à France 1.8 8.1 2.3 5.0 This analysis generally corresponds to the results of the Prony analysis indicating good damping for global mode 2 and weak damping of global mode 1 as a consequence of a load outage in Spain (case A in chapter 2.3), which results in a loadflow from Spain to France. A generation trip in Spain leads to an increased loadflow from France to Spain. The subsequent power oscillation shows in general a much better damping (case B). 5. Improvement of System Damping 5.1 Siting Indices for Global Mode 1 and 2 The information of observability and controllability of a certain oscillation mode is given by the right and left Eigenvector respectively. The participation factor combines observability and the controllability information of a certain mode and can therefore be used as a siting index for PSS and FACTS loca- tion. Another appropriate method is the evaluation of transfer function residues taking into account additionally the dynamic properties of the excita- tion systems through PSSs operation [14]. For looking for the best location to improve damp- ing for both global modes, i.e. looking for genera- tors in the system, where optimisation of the con- troller (PSS) is most effective, the residues of the transfer function ∆ω/∆Vexitation have been calcu- lated. Fig. 11 and Fig. 12 give the residues for both global modes indicating the generators in the sys- tem, where a controller optimisation would be most effective concerning the damping of the mode. It is obvious that global mode 1 can mainly be af- fected by optimising PSS at generators in Spain followed by Portugal and some few machines in the rest of the system (Fig. 11).The optimum PSS to influence global mode 2 are at machines in France followed by Spain, Portugal and Po- land/Hungary (Fig. 12). The controllability of global mode 2 mainly by the controllers in France to- gether with the fact, that a number of PSS in France is equipped with an additional frequency input which allows for good damping at very low frequencies, explains the better damping of global mode 2 compared to mode 1. Fig. 11 Residues of Transfer Function ∆ω/∆Vexitation of Global Mode 1 Fig. 12 Residues of Transfer Function ∆ω/∆Vexitation of Global Mode 2
- 8. 5.2 Design of EDF Desensitised Four Loop Regulator (DFLR) The Desensitised Four Loop Regulator (DFLR) design method is a state feedback controller based on linear quadratic optimisation [15]. For robust- ness, the sensitivities of the state variables with respect to the variations of the operating point are also taken into account and included in the quad- ratic index. The design system is the classic single machine – infinite bus system reduced to order 3, whose states are ∆ω, ∆V, ∆Pa, i.e. the deviations of speed, terminal voltage and accelerating power with respect to their steady state values. For avoiding a steady state error on the terminal volt- age, this state is augmented by the additional sig- nal e defined by e =V-Vref. Finally, the control law is given by ∆u = -[Kω Kv Kp Ke]×[∆ω ∆V -∆Pa ∆e] T . DFLR has the structure described by the block-diagram in Fig 13. Notice that DFLR can be decomposed into an AVR part (consisting in a PI controller) and a stabilising part. Fig 13 Desensitised Four Loop Regulator Structure It has been shown by simulation studies using power system simulation software [16] that this controller is very efficient for damping inter-area oscillations in a multi-machine system: a very sim- ple case has been considered in [17], and this damping property has been confirmed in case of the New England test system in [18]. The good performance of DFLR for damping low frequency electromechanical modes can be ex- plained by its capability to stabilise the generator connected to an infinite bus, even when the equivalent reactance to the infinite bus has a high value (e.g. 100 % Sn including transformer reac- tance). This results from the parametrical robust- ness of DFLR. This robustness, performed by the desensitisation method, ensures a good perform- ance at all operating conditions, while some usual PSS design methods focus on one operating con- dition or one electromechanical mode to be damped. On the other hand, compared with other methods, desensitisation leads to higher AVR and PSS tran- sient gains values. Particularly, a high transient gain of the PSS increases the damping of the whole interconnected system but introduces a local influence of the active power on the stator voltage and reactive power. Here is a compromise to be found between these two effects. For each case, it should be investigated in which extend deviations of stator voltage and reactive power are accept- able. PSS can be for instance equipped with a switching system, that turns off the PSS during islanding. The tuning of the washout filter time constant and the output limiters of the PSS can also reduce this effect. Based on the residues for global mode 1 and 2 in a theoretical approach eight controllers at big gen- erators in CENTREL and Spain have been re- placed by controllers with an additional frequency input as described above. In addition the parame- ter optimisation practically carried out in CENTREL were taken into account. Fig. 14 gives the system response subsequent to a load outage in Spain in Fig. 14 Optimisation of PSS (Time Domain Simu- lation of Frequency Deviation) Fig. 15 Mode Shift due to Controller Optimisation Mode 1 Mode 2 ζ = 5% -1,0 North-South CENTREL 0,1 0,2 0,3 0,4 0,5 Isoline Vref - ∆ Pa u AVR uAVR ∆ω ustab Stabilising part 1/s - -- +++ KωKP KV Ke + - V C A D Load outage in Spain (500 MW) t [s]40 20 20 20 20 B Germany Spain Poland∆f [mHz]
- 9. time domain simulation for optimising controllers in CENTREL (B), in Spain (C) and a combination of both (D). As a reference the behaviour without controller optimisation is given (A). The analysis in frequency domain shows that the damping of both global mode 1 and 2 improves significantly, see Fig. 15. Further the damping of the CENTREL mode is sufficient, which is ap- proximately already achieved in practice by opti- mised controller settings in CENTREL, see also chapter 6. No investigations were made about the north-south mode in the framework of this analysis. 6. Activities in Power Plants This chapter gives an assessment about the activi- ties in power plants of the UCTE/CENTREL sys- tem regarding their contribution to system stability on the basis of the eigenvalue analysis in chapter 4 and 5. Generally in UCTE since more than twenty years modern control features are applied at the con- structed power plants and on the occasion of re- newing control devices. In the centre of the UCTE system, for example Belgium, Germany, Switzer- land, stability problems occurred only in extreme network conditions after disturbances. So the pa- rameter optimisation was carried out mostly re- garding local aspects and to manage disturbed network conditions. The eigenvalue results show that the contribution of units located in the centre to damping global mode 1 and 2 is generally poor. A practical need for stabilising measures was given in Italy and in the area of ex-Yugoslavia and Greece due to the longitudinal and initial local weak network structure. Due to the very low oscil- lation periods PSS with two input signals, power and speed, were used [19]. The former parallel operation of ex-Yugoslavia and Greece with UCTE was only possible after implementation of such controllers. The North/South mode in UCTE/CENTREL is mainly damped by the existing controllers in Italy. In France in the 1970’s at the beginning of the French nuclear generation program development a new concept of voltage controller was initiated by planning studies, which showed the risk of tran- sient and steady state stability problems. These controllers also use two input signals, power and speed, to build the four loop controller by the over- all optimisation of the AVR/PSS. The results in chapter 5 show, that the characteristics of these controllers have a significant contribution to the good damping of the today’s global mode 2 in the present UCTE/CENTREL system. In Portugal and Spain optimised parameters for voltage control and PSS are in operation since many years. After extension of UCTE by CENTREL in 1995 the system behaviour has changed significantly so that with the structure of the existing controllers a positive contribution to system damping, especially for the low frequency of global mode 1, is very poor. It is suggested to use two input PSS (power and speed) for future control devices in order to adapt the controller characteristics to the changed system behaviour after the extension of UCTE. In CENTREL the re-tuning of a lot of control de- vices was started in 1995 and continued till 1999, [20]. Almost all PSS’s have the real power as the input signal, which produces a damping effect mainly for local swings (≈ 1- 1.5 Hz) by means of a phase compensating function. An additional phase compensating element was implemented and the transient gain of the voltage controller was reduced to extend the damping effect for frequencies below 0.5 Hz. Such modifications were done at more than twenty big units, which produces in total a significant contribution to damping of global mode 1 and 2 and the CENTREL mode. In case of modernisation of control devices it was generally decided in CENTREL to implement a PSS with two input signals power and speed, which allows to create a controller with most effi- cient damping even of low frequencies and at the same time minimising the negative effects on other operational conditions as pointed out in chapter 5. Such new PSS are already implemented at several units in CENTREL and it is planned to install more such stabilisers in near future. 7. Conclusions The appropriate treatment of inter-area oscillations needs an international co-operation of TSO’s in which also the power plant operators must be in- volved by the respective TSO. Too, an accurate WAMS provides relevant power system information useful for model validation and measure of oscilla- tions. Generally a sufficient damping in UCTE/CENTREL was achieved by different stabilising measures taken in power plants, however this process should be continued in order to guarantee stable opera- tion also in extreme global load flow conditions, which may decrease damping. The implementation of PSS using power and speed as input signals is the most efficient approach to extend the stable operating region of the power system, by means of which in normal network condition of UCTE/CENTREL it can be expected that no transit
- 10. limitation are necessary with respect to steady state stability. The influence of interconnection of CENTREL and UCTE on the system behaviour confirms the expe- riences made in different power systems world- wide, that the meaning of inter-area oscillations increases, if the system size and/or the loading of the transmission grid grows. Thus the presented approach is very important to be prepared for fu- ture development in Europe regarding open market and possible further extensions towards Bulgaria, Romania [21] and the Mediterranean Ring [22]. 8. References [1] “Analysis and Control of Power System Oscil- lations”, CIGRE TF 07 of Advisory Group 01, SC 38, December 1996 [2] J. Machowski, J.W. Bialek, J.R. Bumbay: “Power System Dynamics and Stability”, John Wiley Sons New York, 1997, ISBN 0 471 97174 X (PPC) [3] H. Weber, E. Welfonder, Dynamic Model Reduction for the Modal Analysis of Frequency and Power Oscillations in large Power Sys- tems, IFAC Symposium Power Systems. Modelling and Control Applications, Brussels, September 1988 [4] Dmitry N. Kosterev, Carson W. Tylor, William A. Mittelstadt, Model Validation for the August 10. 1996 WSCC System Outage, IEEE Transactions on Power Systems, Vol. 14, No. 33, August 1999, pp 967 – 979 [5] D. Clodius, W. Glaunsinger, E. Grebe, M. Lösing, M. Luther, Parallel Operation of Cen- trel and UCPTE Networks under System Dy- namics Aspects, Ref.: PSCC 1996-425 [6] M. Spanner, H.-B. Tillmann, E. Welfonder, J. Zerenyi: “Load flow dependence of slow inter- area oscillations in the extended European power system”, CIGRE 1998, 38-103 [7] U. Bachmann, I. Erlich, E. Grebe; Analysis of interarea oscillations in the European electric power System in synchronous parallel opera- tion with the Central-European networks, pa- per BPT99-070-12, IEEE Power Tech 9 Con- ference, Budapest, August 29 – September 2, 1999 [8] PSS/E 26 Program Manual. Power Technolo- gies Inc. December 1998. [9] X. Lei, E. Lerch, D. Povh, O. Ruhle: ”A large Integrated Power System Software Package – NETOMAC”, Powercon 98, Beijing, China, 1998 [10]E. Lerch, B. Kulicke, O. Ruhle, W. Winter: “NETOMAC - Calculating, Analyzing and Op- timizing the Dynamic of Electrical Systems in Time and Frequency Domain“, 3rd IPST '99, Budapest, Ungarn, 20.-24.06.1999 [11]IEEE Committee Report: “Computer repre- sentation of excitation systems ”, IEEE Trans. PAS-87, No. 6, pp 1460-1464 [12]IEEE Committee Report: “Dynamic models for steam and hydro turbines in power system studies”, IEEE Trans. PAS-92, No. 6, pp 1904- 1915 [13]R. Witzmann, J. Rittiger, W. Winter: ”Inter-Area Oscillations during Development of Large In- terconnected Power Systems”; CIGRE Sym- posium. Working Plant and Systems Harder, 7- 9 June 1999, London (UK) [14]X. Wang: “Modal Analysis of Large intercon- nected Power Systems”, VDI fortschrittsbe- richte, Reihe 6: Energietechnik, Nr. 380, ISBN 3-18-338006 [15]Heniche, H. Bourlès, M.P. Houry: “A Desensi- tized Controller for Voltage Regulation of Power Systems”, IEEE Transactions on Power Systems, Vol. 10, No. 3, pp. 1461-1466, August, 1995. [16]B. Meyer, M. Stubbe, EUROSTAG, a Single Tool for Power System Simulation, Transmis- sion Distribution International, March 1992. [17]H. Bourlès, S. Peres, T. Margotin, M.P. Houry, “Analysis and Design of a Robust Coordinated AVR/PSS”, paper PE-537-PWRS-0-01-1997, IEEE PES Summer Meeting, Denver, 1997. [18]H. Quinot, H. Bourlès, T. Margotin: “Robust Coordinated AVR+PSS for Damping Large Scale Power Systems”, paper PE-455-PWRS- 0-12-1998, IEEE PES Winter Meeting, New York, 1999 [19]V. Arcidiacono, E. Ferrari, R. Marconato, F. Saccomanno: „Analysis of Factors Affecting the damping of low frequency oscillations in multimachine systems“, CIGRE session 1976, paper 32-19 [20]L. Kiss, J. Zerenyi´: A Simple Measuring Method to Determine the Damping Efficiency of the Excitation Systems and Power System Stabiliziers (PSS), IEEE Power Tech 9 Con- ference, Budapest, August 29 – September 2, 1999 [21]U. Bachmann, H. Breulmann, W. Glaunsinger, P Hoiss, M. Lösing, A. Menze, S. Römelt, U. Zimmermann: Verbundstabilität nach dem Synchronanschluß der Netze der Elek- trizitätsunternehmen von Bulgarien und Rumänien an den UCTE/CENTREL-Verbund, Munich, ETG-Tage ’99, ETG-Fachbericht 79, ISBN 3-8007-2502-9, pp.251-257 [22]R. Marconato: “Electricity Market in the Medi- terranean Basin: The Mediterranean Power Ring”, 22 nd IAEE Annual international Confer- ence, Rome, 9-12 June 1999.