Bringing Geospatial Analysis to the Social Studies: an Assessment of the City Sprawl in China

Current poster presents an example of Landsat TM image processing using ENVI GIS. Research area: Taipei, Taiwan. Located on the north of the island, Taipei is Taiwan’s core urban, political and economic center; population >2.6 M continuing to expand affecting urban landscapes. Research aim: spatio- temporal analysis of urban dynamics in study area during 15 years (1990- 2005) Research objective: application of GIS methodology and remote sens- ing data to spatial analysis for a case study of Taipei. Data: Landsat TM images taken from the USGS. Software: ENVI GIS. Workflow includes following steps: 1) Preliminary processing 2) Creation color composites 3) Classification using K-means algorithm 4) Mapping using classification results 5) Accuracy assessment. The preliminary data processing includes image contrast stretching, which is useful as by default, ENVI displays images with a 2\% linear contrast stretch. For better contrast the histogram equalization contrast stretch was applied to the image in order to enhance the visual quality. The analysis of landscape changes was performed by geospatial analysis. 2 satellite images Landsat TM were processed and classified using ENVI GIS. Result of classification: areas occupied by different land cover types were calculated and analyzed. It has been detected that different parts of the city of Taipei were developing with different rate and intensity. 3 different residential types of the city were recognized and mapped. The results demonstrated following outcomes: 1) intensive urban development of the city of Taipei; 2) decline of green areas and natural spaces and, on the contrary, increase in anthropogenic urban spaces; 3) not parallel urban development in different districts of the city of Taipei during the 15-year period of 1990-2005.
Recommended

Recommended
More Related Content
What's hot
What's hot (20)
Similar to Bringing Geospatial Analysis to the Social Studies: an Assessment of the City Sprawl in China
Similar to Bringing Geospatial Analysis to the Social Studies: an Assessment of the City Sprawl in China (20)
More from Universität Salzburg
More from Universität Salzburg (20)
Recently uploaded
Recently uploaded (20)
Bringing Geospatial Analysis to the Social Studies: an Assessment of the City Sprawl in China
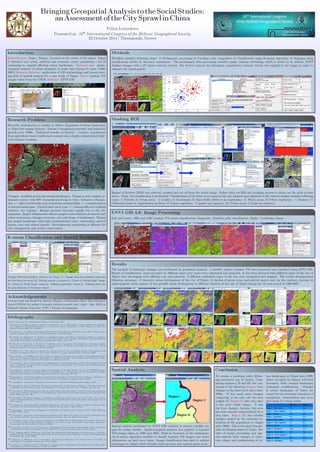
- 1. BringingGeospatialAnalysistotheSocialStudies: anAssessmentoftheCitySprawlinChina Polina Lemenkova Presented at: 10th International Congress of the Hellenic Geographical Society, 22 October 2014 | Thessaloniki, Greece Introduction Research area: Taipei, Taiwan. Located on the north of the island, Taipei is Taiwan’s core urban, political and economic center; population >2.6 M continuing to expand affecting urban landscapes. Research aim: spatio- temporal analysis of urban dynamics in study area during 15 years (1990- 2005) Research objective: application of GIS methodology and remote sens- ing data to spatial analysis for a case study of Taipei. Data: Landsat TM images taken from the USGS. Software: ENVI GIS. Research Problem Recently, urbanization is notable in Taipei. Expansion of urban landscapes in Taipei has unique features. Taiwan’s exceptional economic and industrial growth since 1980s: "industrial wonder of Taiwan". Country transformed from agriculture-based traditional economy into a highly industrialized high- tech oriented economy. Changes: modified social and natural landscapes. Taiwan is now a highly ur- banized country with 80% of population living in cities. Intensive urbaniza- tion => affect biodiversity and ecosystems sustainability => transformation of natural landscapes. Natural land cover type => human-affected artificial surfaces; city enlarges. Human pressure increases rapidly due to the city expansion. Rapid urbanization affects complex interrelations of natural and urban ecosystems, changes structure, size and shape of landscapes. Taiwan has unique landscapes with high environmental value, outstanding natural beauty, rare and extinct species. Environmental monitoring is effective for city management and nature conservation. K-mean Classification and Spatial Statistics: Change detection statistics: process, in 7 steps: 1). Change detection statistics (selection the tool from the menu )2). Setting options of process 3). Choice of ’Initial Stage’ image. 4). Choice of ’Final Stage’ image 5). Defining equivalent classes 6). Defining pixel size for area statistics 7) Statistics output Acknowledgements Current work was funded by Taiwan Ministry of Education Short Term Research Award (STRA) for author’s 2-month visiting research stay (April - May 2013) at National Taiwan University (NTU), Faculty of Geography. Bibliography Author’s publications on Geography, Remote Sensing and GIS: 1S. Gauger, G. Kuhn, K. Gohl, T. Feigl, P. Lemenkova, and C. Hillenbrand, “Swath-bathymetric mapping”, The expedition ANTARKTIS-XXIII/4 of the Research Vessel ’Polarstern’ in 2006. Reports on Polar and Marine Research 557, 38–45 (2007). 2K. Gohl et al., Crustal and Sedimentary Structures and Geodynamic Evolution of the West Antarctic Con- tinental Margin and Pine Island Bay (Bremerhaven, Germany, 2006). 3M. Klaučo, B. Gregorová, U. Stankov, V. Marković, and P. Lemenkova, “Landscape metrics as indicator for ecological significance: assessment of Sitno Natura 2000 sites, Slovakia”, in Ecology and environmental protection, Proceedings of International Conference (2014), pp. 85–90. 4M. Klaučo, B. Gregorová, U. Stankov, V. Marković, and P. Lemenkova, “Determination of ecological signifi- cance based on geostatistical assessment: a case study from the Slovak Natura 2000 protected area”, Central European Journal of Geosciences 5, 28–42 (2013). 5G. Kuhn et al., The response of quaternary climatic cycles in the South-East Pacific: development of the opal belt and dynamics behavior of the West Antarctic ice sheet (Bremerhaven, Germany, 2006). 6P. Lemenkova, “Cost-Effective Raster Image Processing for Geoecological Analysis using ISOCLUST Clas- sifier: a Case Study of Estonian Landscapes”, in Modern problems of geoecology and landscapes studies, Proceedings of the 5th International Conference (2014), pp. 74–76. 7P. Lemenkova, “Rural Sustainability and Management of Natural Resources in Tian Shan Region, Central Asia”, in Celebrating pastoral life. heritage and economic development, Proceeding of the international con- ference (2014), pp. 81–89. 8P. Lemenkova, “Opportunities for Classes of Geography in the High School: the Use of ’CORINE’ Project Data, Satellite Images and IDRISI GIS for Geovisualization”, in Perspectives for the development of higher education, Proceedings of 7th International Conference (2014), pp. 284–286. 9P. Lemenkova, “Monitoring changes in agricultural landscapes of Central Europe, Hungary: application of ILWIS GIS for image processing”, in Geoinformatics: theoretical and applied aspects (2013). 10P. Lemenkova, “Geospatial Technology for Land Cover Analysis”, MEA Geospatial Digest (2013). 11P. Lemenkova, “Impacts of Climate Change on Landscapes in Central Europe, Hungary”, in Current Problems of Ecology, Ecological monitoring and management of natural protection, Vol. 2 (2012), pp. 134–136. 12P. Lemenkova, “Water Supply and Usage in Central Asia, Tian Shan Basin”, in 4th international symposium for doctoral studies in the fields of civil engineering, architecture & environmental protection (phidac-2012) (Sept. 2012), pp. 331–338. 13P. Lemenkova, “Seagrass Mapping and Monitoring Along the Coasts of Crete, Greece”, M.Sc. Thesis (Uni- versity of Twente, Faculty of Earth Observation and Geoinformation (ITC), Enschede, Netherands, Mar. 8, 2011), 158 pp. 14P. Lemenkova, “Using ArcGIS in Teaching Geosciences”, Russian, B.Sc. Thesis (Lomonosov Moscow State University, Faculty of Educational Studies, Moscow, Russia, June 5, 2007), 58 pp. 15P. Lemenkova, “Geoecological Mapping of the Barents and Pechora Seas”, Russian, B.Sc. Thesis (Moscow, Russia, 2004), 78 pp. 16P. Lemenkova, Ecological and Geographical Mapping of the Baltic Sea Region in the Gulf of Finland, Rus- sian, Moscow, Russia: Lomonosov Moscow State University, Mar. 30, 2002, Term Paper. 17P. Lemenkova and I. Elek, “Clustering Algorithm in ILWIS GIS for Classification of Landsat TM Scenes: a Case Study of Mecsek Hills Region, Hungary”, in Geosciences and environment, Near-surface geophysics, Proceedings 3rd International Conference (2012). 18P. Lemenkova, B. Forbes, and T. Kumpula, “Mapping Land Cover Changes Using Landsat TM: A Case Study of Yamal Ecosystems, Arctic Russia”, in Geoinformatics: theoretical and applied aspects (2012). 19H. W. Schenke and P. Lemenkova, “Zur Frage der Meeresboden-Kartographie: Die Nutzung von AutoTrace Digitizer für die Vektorisierung der Bathymetrischen Daten in der Petschora-See”, German, Hydrographische Nachrichten 25, 16–21 (2008). 20I. Suetova, L. Ushakova, and P. Lemenkova, “Geoecological Mapping of the Barents Sea Using GIS”, in International Cartographic Conference (ICC) (2005). 21I. Suetova, L. Ushakova, and P. Lemenkova, “Geoinformation mapping of the Barents and Pechora Seas”, Geography and Natural Resources 4, 138–142 (2005). Methods Workflow includes following steps: 1) Preliminary processing 2) Creation color composites 3) Classification using K-means algorithm 4) Mapping using classification results 5) Accuracy assessment. The preliminary data processing includes image contrast stretching, which is useful as by default, ENVI displays images with a 2% linear contrast stretch. For better contrast the histogram equalization contrast stretch was applied to the image in order to enhance the visual quality. Masking ROI Region of Interest (ROI) was selected, masked and cut off from the whole image. Subset data via ROI and masking process is shown on the print screens above. Then, the classification is performed. Classification of the land cover types in the city adopted and adjusted to the current studies includes following types: 1) Forests; 2) Urban areas – 2 (roads); 3) Grasslands; 4) Open fields (little or no vegetation); 5) Water areas; 6) Urban vegetation – 1 (bushes); 7) Cultivated lands 8) Agricultural facilities; 9) Urban vegetation –2 (parks and squares); 10) Urban areas -2 (built-up surfaces). ENVI GIS 4.8: Image Processing Left and center: 2005 and 1990 Landsat TM scenes classification (fragment). Random color visualization. Right: Combining classes Results The analysis of landscape changes was performed by geospatial analysis. 2 satellite images Landsat TM were processed and classified using ENVI GIS. Result of classification: areas occupied by different land cover types were calculated and analyzed. It has been detected that different parts of the city of Taipei were developing with different rate and intensity. 3 different residential types of the city were recognized and mapped. The results demonstrated following outcomes: 1) intensive urban development of the city of Taipei; 2) decline of green areas and natural spaces and, on the contrary, increase in anthropogenic urban spaces; 3) not parallel urban development in different districts of the city of Taipei during the 15-year period of 1990-2005 Spatial Analysis Spatial analysis performed by ENVI GIS enabled to process satellite im- ages for urban studies. Spatio-temporal analysis was applied to Landsat TM images taken at 1990 and 2005. Built-in functions of the mathemati- cal K-means algorithm enabled to classify Landsat TM images and derive information on land cover types. Image classification was used to analyze landscapes in Taipei which includes built-up areas and natural green areas. Conclusion To resume a resulting table, follow- ing conclusion can be drawn. Com- paring regions I, II and III, the con- clusion is the following: Region I has changes in the land cover types since 1990s. It has much more changes comparing to the core, old city area (region II) Region II (the core city) is the most stable region. It has the least changes, because this area has been already industrialized for a long time. Region III, has notable changes caused by the intensive re- location of the population to Taipei after 1980s. This is the most dynami- cally developing region of Taipei. Re- sults of image processing and spa- tial analysis show changes in struc- ture, shape and configuration of ur- ban landscapes in Taipei since 1990. Areas occupied by human activities increased, while natural landscapes undergone modifications. Changes in urban landscapes of Taipei are caused by the increased relocation of population, urbanization and occu- pied lands for urban needs.