1. School to Prison Pipeline: A Public Health Approach
By: Nikki Parekh and Professor Debbie Borie-Holtz
American Civil Liberties Union of New Jersey
Significance
Methods
EvaluationOutcomes
Limitations
Acknowledgements
Newark
School
District
Presence of
Law
Enforcement
Labeling
Theory
Public Health
Issue
Decreased
Performance
Preliminary
Work
• Conduct a voluntary non-probability
student feedback survey.
• Clean up and transform data into SPSS.
SPSS
• Create a four dichotomous variable scale
on SPSS.
• Gather statistics regarding graduation
rate from the Department of Education.
Post Analysis
• Run bivariates between the four
dichotomous scale and graduation rate to
test the hypothesis that higher labeling
scores decreases overall student
performance.
• Study was not generalizable to the larger
population because of proportionality and
small sample sizes per school.
• In order to improve study, a random sample
of students with a minimum n size of 800 is
recommended.
Purpose
Assessing the influence of labeling theory
on the School to Prison Pipeline program.
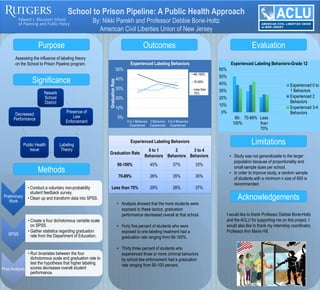
• Analysis showed that the more students were
exposed to these tactics, graduation
performance decreased overall at that school.
• Forty five percent of students who were
exposed to one labeling treatment had a
graduation rate ranging from 90-100%.
• Thirty three percent of students who
experienced three or more criminal behaviors
by school law enforcement had a graduation
rate ranging from 90-100 percent.
0%
10%
20%
30%
40%
50%
0 to 1 Behaviors
Experienced
2 Behaviors
Experienced
3 to 4 Behaviors
Experienced
GraduationRate
Experienced Labeling Behaviors
90-100%
70-89%
Less than
70%
0%
10%
20%
30%
40%
50%
60%
90-
100%
70-89% Less
than
70%
Experienced Labeling Behaviors-Grade 12
Experienced 0 to
1 Behaviors
Experienced 2
Behaviors
Experienced 3-4
Behaviors
I would like to thank Professor Debbie Borie-Holtz
and the ACLU for supporting me on this project. I
would also like to thank my internship coordinator,
Professor Ann Marie Hill.
Experienced Labeling Behaviors
Graduation Rate
0 to 1
Behaviors
2
Behaviors
3 to 4
Behaviors
90-100% 45% 37% 33%
70-89% 26% 35% 30%
Less than 70% 29% 28% 37%