Call for Papers - African Journal of Biological Sciences, E-ISSN: 2663-2187, ...
M.S.ENG. Lean/Six-Sigma Project Summary Poster
1. Define
Measure
Analyze Improve + Control
Application of Lean/Six‐Sigma + Human Factors Principles
To Power Distribution Network Optimization Efforts
MS Candidate: Nick Boyd Committee Chairs: Dr. Jerald Brevick + Dr. Carolyn Sommerich
I. Problem Space Definition II. Scope Prioritization
III. Balanced Project Scorecard IV. Affinity Diagram
Project focused on the distribution
network (as opposed to generation)
and equipment: Circuit Breakers,
Transformers and Transmission Lines.
Constraints related to project duration
and resources necessitated a focused
scope. Prioritization tool afforded a clear
direction forward and attainable end goal.
Relation between objective, action
and associated metric developed the
framework for implementation of the
Measure and Analyze phases.
Associations between project drivers
allowed for a clearer understanding of
relations between components and
informed an approach to progress.
I. Equipment Metric Classifications II. Interval Plot Trend Tracking
III. Value Distribution Mapping IV. Metric Class Stratification
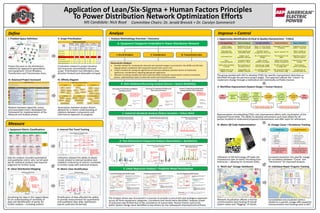
I. Analysis Methodology Overview + Outcomes
B. Data Validation/Screening Analysis (Source + System Reliability)
A. Equipment Categories Embedded in Power Distribution Network
C. Industrial Standards Analysis (Failure Duration + Failure Rate)
D. Two‐Dimensional Categorical Analysis (Quantitative + Qualitative)
E. Linear Regression Analysis + Predictive Model Development
The Analysis phase was structured in a manner to provide a concurrent and analogous approach
across all three equipment categories. Correlation and trends were identified, however power
of outcomes was limited due to the consistency of source data. Human Factors and errors
within System Design were identified as key drivers for the subsequent Improve/Control Phase.
Data for analysis included quantitative
and qualitative metric sets; not all were
apt for statistical analysis and required
judgment for further study.
Utilization allowed the ability to depict
trends related to interval duration and
establish a hierarchy of metrics correlated
to further study with statistical analysis.
Visualizing the data in this regard allows
for an understanding of normality of
data and identification of points for
further analysis – including outliers.
Stratification of data afforded the ability
to provide measurement for quantitative
and qualitative data alike; distribution
nature could also be derived.
I. Opportunity Identification (Critical to Quality Characteristics ‐ CTQCs)
The group worked with AEP to develop CTQCs for specific improvement directives as
identified through the pervious project stages. This approach affords the “means” to
implement change through a methodical and statistically verifiable manner.
II. Workflow Improvement (System Design + Human Factors)
Representation of embedding CTQCs into improvement efforts with visualization of the
proposed Future State. The ability to develop and present such tools allows for all
parties involved to understand proposed improvements and offer input for refinement.
III. Metric QR Code Implementation IV. Outage Cause + Persistence Tracking
V. “Bird’s Eye” Outage Dashboard VI. Individual Repair Progress Tracking
Utilization of QR technology off‐loads the
monotonous task of metric recording from
technician – allowing for increased utility.
Increased resolution into specific outage
for correlation between “Cause” and
“Persistence” for improved analysis.
Network visualization affords a tool for
communication and tracking of overall
system status and “flagging” of trends.
Consolidated and visualized metrics
related to a specific outage offer powerful
communication and tracking tools to AEP.