“Oh GOSH! Reflecting on Hackteria's Collaborative Practices in a Global Do-It...
Bowden 0
1. Continued on next page
The transistor enabled the electronic func-
tions of modulation and amplification to be
performed in a tiny piece of silicon, which
consumed a fraction of the power used by
vacuum tube based electronics, and ush-
ered in the era of solid-state electronics
exemplified by the popular transistor radio
of the 1950s.
The integrated circuit derived from the
development of the planar silicon process,
which permitted simultaneous fabrication of
multiple transistors and other electronic
components in the surface of a silicon
wafer. The individual components could
then be interconnected on the surface of the
chip to produce functional semiconductor
devices, such as memories and micro-
processors. These devices enabled the per-
sonal computer revolution, along with the
plethora of electronic equipment exempli-
fied by cell phones, digital cameras and
such like that today constitute a near trillion
dollar electronics market, sustained by a
$150B market for semiconductors.
Since its inception circa 1960, the modern
semiconductor industry has been driven for
reasons of economics, speed and reliability
to build more and more functionality into
the integrated circuit or ‘chip’. The princi-
pal means to accomplish this has been to
shrink the size of the individual circuit ele-
ments. By reducing the feature size associ-
ated with the circuit elements of the transis-
tors in a memory cell, for example, smaller
and smaller transistors can be fabricated
enabling more of them to be packed into a
given area of silicon real estate, thereby
increasing functionality while lowering the
cost of a memory ‘bit’. Since 1960, the
cost of a transistor has fallen by a factor of
107, which is a triumph of technology
matched by few other advances.
Shrinking the size of circuit elements, e.g.,
the gate feature of a transistor, also enables
the transistor to operate at faster speed,
thereby reducing the time required to per-
form certain operations. The 2.2 GHz
speed of a Pentium 4 processor, for exam-
ple, compared with 66 MHz of the earlier
generation Pentium 1 derives primarily from
the much smaller gate dimensions of the for-
mer. The third advantage attending shrink-
age of the device is reliability. Being able
to cram 1GByte of memory, for example,
into a single chip results in a more reliable
package than having to interconnect and
package 4 separate 256MByte chips.
These advantages provide a clear incentive
to chip manufacturers to shrink the feature
size as quickly as possible to gain competi-
tive advantage by bringing the latest gener-
ation in chip design to market before their
competitors. But how quickly?
Historically, the industry has been able to
double the number of transistors on a chip
approximately every 18 months. This trend
was actually first reported by Gordon
Moore in 1965 in a review article pub-
lished in Electronics. Moore who, subse-
Moore’s Law and the
Technology S-Curve
The birth of the modern electronics industry can be traced to two seminal inventions - the invention of the transis-
tor in 1948 at AT&T’s Bell Telephone Laboratories in New Jersey in 1948, and the invention of the integrated cir-
cuit in 1959 by Robert Noyce at
Fairchild and (independently) Jack
Kilby at Texas Instruments.
by Murrae J. Bowden
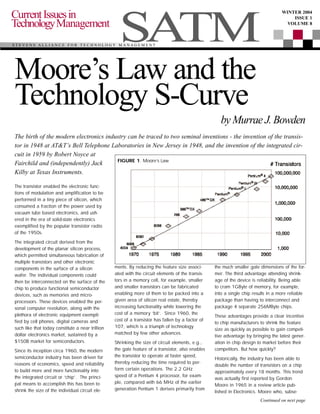
FIGURE 1. Moore’s Law
WINTER 2004
ISSUE 1
VOLUME 8
SATMS T E V E N S A L L I A N C E F O R T E C H N O L O G Y M A N A G E M E N T
CurrentIssuesin
TechnologyManagement
2. quently cofounded Intel along with Robert
Noyce, noted that the number of transistors
on a silicon chip, plotted as a semi log plot
against time, had increased linearly over
the preceding 5 years, doubling approxi-
mately every 18 months. Moore reasoned
that continued improvements in manufactur-
ing technology, innovation (device design)
and chip size should enable that trend to
continue for several more years. Just how
well Moore predicted the industry trend can
be seen in Figure 1, which shows a semi-
log plot of the number of transistors in the
various generations of microprocessor chips
against time through 2000 indicating con-
tinuation of the linear trend for the past 35
years!
So accurate was Moore’s prediction, it has
become enshrined in the industry lore as
Moore’s Law, and subsequently codified as
the International Road Map for
Semiconductors. For forty years, Moore’s
Law has been the yardstick driving innova-
tion as semiconductor manufacturers contin-
ually strove to gain competitive advantage
by being first to market at the next technolo-
gy node within the time frame ‘specified’
by Moore’s Law, or even earlier. Indeed,
‘beat Moore’s Law’ has become the com-
petitive mantra for leading-edge firms.
Moore’s Law is an example of a classic S-
curve whereby performance as measured
by some convenient metric, e.g., speed,
plotted on a linear scale follows the shape
of an S over time, ultimately reaching a
limit determined by some fundamental phys-
ical constraint associated with the underly-
ing technology, such as a basic law of
physics (Figure 2). At this point, the tech-
nology is mature with no potential for fur-
ther improvement.
To understand how the industry has been
able to adhere to the trajectory of Moore’s
Law, it will be helpful to have an under-
standing of the underlying technologies
used to manufacture integrated circuits.
Principal among these is optical lithogra-
phy, shown schematically in Figure 3.
A silicon wafer is first oxidized to create a
thin film of silicon dioxide on the surface of
the wafer. The wafer is then coated with a
thin film of a photosensitive material called
a photoresist, and exposed to a patterned
source of radiation (by means of a pho-
tomask) to form a latent image of the mask
pattern in the photoresist. Development of
that latent image creates a three-dimension-
al replica of the two-dimensional mask pat-
tern in the photoresist. The process is analo-
gous to photography with the exposure tool
equivalent to the camera, and the photore-
sist equivalent to the photographic film.
Etching the oxide layer bares the silicon
substrate, enabling subsequent modification
of the electrical properties in these precisely
patterned areas.
As seen in Figure 3, there are two critical
requirements associated with the lithograph-
ic process - tools to translate the circuit
image into a spatially modulated aerial
image, and resist materials to record that
image as a latent image, which can subse-
quently be developed to form a three-
dimensional pattern in the resist film. Both
are highly interdependent. Development of
a suitable resist requires tailoring the photo-
chemistry of the resist to the wavelength
associated with the exposure tool, and
development of the tool requires availability
of a suitable photoresist. Both exposure tool
and resist must be commercially available
to the chip manufacturer in the timeframe
"dictated" by Moore’s Law.
The problem is that the development of
viable lithographic tools and process tech-
nologies takes a considerable period of
time - typically10 years and more, which
means that technology choices must be
made long before the extant technology
has matured. Why should this be a prob-
lem?
In the early 1970s, technologists believed,
based on prevailing knowledge of physics
and materials science, that diffraction/engi-
neering constraints would limit the resolu-
tion of optical lithography to around 2.0
micro meters (µm). Hence, practical realiza-
tion of Moore’s Law beyond feature sizes of
2.0µm would require development of an
alternative exposure technology offering
Continued on next page
FIGURE 2. Technology S-curve
FIGURE 3. Lithographic Fabrication Scheme
3. higher resolution. Although the optical per-
formance "limit" was not anticipated for
several more years, early choice and devel-
opment of a substitute technology was
needed in order to assure timely availability
of the next generation of manufacturing
technology. In response, advanced R&D
organizations, such as Bell Labs, IBM,
Texas Instruments, Hitachi, and others
began around 1970 to pour millions of dol-
lars into the development of electron beam
lithography, which was seen as the logical
successor to optical lithography.
Committing to a successor technology and
development timeframe long before the
extant technology has matured carries enor-
mous risk. Factors include:
• The correctness of the assessment of
the performance limit associated with
the prevailing technology
• Potential for development of sustain-
ing technologies enabling further pro-
gression along the technology S-curve,
i.e., the predicted performance limit
derives from engineering limitations of
the prevailing technology, not with the
larger optical lithography paradigm
• The technical and economic viability of
the substitute technology
Failure to adequately consider these risks
may result in flawed technology strategies
and business decisions that can threaten the
viability of the business.
In the case of optical lithography, the pre-
diction of 2.0µm as the performance limit
proved completely wrong. Subsequent
improvements in sustaining technologies
associated with optical lithography, espe-
cially the development of reduction step-
and-repeat printing tools employing shorter
and shorter wavelengths, enabled printing
of circuit features well below 2.0µm.
However, this was not before millions and
millions of dollars had been spent on devel-
oping scanning electron beam exposure
tools, that subsequently came to be viewed
as impractical for chip manufacture, not for
reasons of resolution, but of throughput limi-
tations, which made manufacturability
uneconomical.
Fortuitously, the investment in e-beam lithog-
raphy was not entirely wasted. Bell Labs
recognized that this technique was ideal for
making the masks used in photolithography,
and subsequently commercialized their elec-
tron beam exposure system known as EBES,
together with the associated resist technolo-
gy also developed at Bell Labs. The EBES
system, commercialized by the ETEC corpo-
ration as MEBES, has been the industry
standard for e-beam mask making since its
introduction in the mid 1970s.
As the 1980s approached, the industry
again faced a critical decision.
Recognizing that the diffraction limitations
of optical lithography were wavelength
dependent (the limit was now thought to be
around 1.0um), technologists recognized
that diffraction effects could be all but elimi-
nated by making a two to three- order of
magnitude reduction in wavelength by mov-
ing to the X-ray region. Again, millions and
millions of dollars were committed to the
development of X-ray lithography by Bell
Labs, IBM and others. Again, these deci-
sions proved to be highly flawed.
Continued advances in the technologies sus-
taining optical lithography enabled fabrica-
tion of devices in the sub-micron regime.
Further, as with direct write e-beam lithogra-
phy, X-ray lithography also proved to be
impractical for commercial implementation
because of engineering constraints associat-
ed with source and mask. Those constraints
proved insurmountable, and those who
embraced the X-ray lithography paradigm
ended up writing off the hundreds of mil-
lions of dollars in investment, and in a num-
ber of cases, claiming bankruptcy.
It is interesting to speculate whether these
mistakes could have been avoided, or at
least the investment losses minimized. The
quest for an alternative to optical lithogra-
phy was driven by inaccurate predictions of
the performance limit of the technology. It
had been recognized in the 1970s that res-
olution, defined by the Rayleigh equation
as W = k1λ/2NA where λ is the exposing
wavelength, NA the numerical aperture of
the lens in the exposure tool, and k a pro-
cessing constant, was theoretically much
less than 2.0µm. There was no evidence to
suggest, however, that the wavelengths and
numerical apertures could be realized that
would enable such improvements. The
incorporation of short wavelength lasers,
for example, used in today’s advanced
steppers could not have even been con-
ceived back in 1970. In other words, the
predictions of the demise of optical lithogra-
phy were limited by assumptions regarding
the prevailing engineering technology not
fundamental physical limitations.
In reality, the S-curve encompassing
Moore’s Law is a composite of multiple
S-curves associated with the underlying
sustaining technologies, which include
• Mask
• Light Source
- Wavelength, bandwidth
• Image Projection
• Optics
- Materials (Chemistry)
- Aberration, Distortion (Physics)
• Tools
- Engineering
• Resists
FIGURE 4. Resist Evolution showing material platform transitions required by changes in
wavelength of the exposure tools
4. As the history of optical lithography has
shown, claiming the demise of a technolo-
gy based on the development status of
some subset of sustaining technologies can
be highly flawed. Improvements in lens
technology (materials and engineering)
have subsequently enabled fabrication of
lenses with close to theoretical numerical
apertures. Improvements in laser technolo-
gy have enabled practical light sources at
wavelengths down to 157nm.
Improvements in mask technology have
enabled implementation of wavelength
engineering techniques and k-factors per-
mitting fabrication of devices with minimum
feature size less than half the exposing
wavelength. Continued improvements in
materials technology enabled development
of resists matched to the shorter and short-
er wavelengths of evolving stepper tools.
Over time, the development path of each of
these technologies continued to evolve
along their individual S-curves (See Figure
4 which illustrates the evolution of resist
technology by wavelength with different
platforms emerging as the previous platform
reached its limit of performance).
Convolution of these individual S-curves has
enabled continued progression along the
composite S-curve for optical lithography.
The problem faced by the industry over the
years has been in accurately assessing just
where the technology in question lies on
the S-curve, and the difficulty of the techni-
cal challenge limiting the attainment of
optimum performance. Had the develop-
ments in the technologies supporting opti-
cal lithography been foreseen, the millions
of dollars in R&D costs invested by the
industry in alternative technologies might
have been forestalled.
Perhaps, but herein lies the tyranny of
Moore’s Law and the pressure it creates for
the semiconductor industry. Moore’s Law
says nothing about the manufacturing tech-
nology associated with a given technology
node, only the timeframe in which it will
be available, i.e., it defines the time frame
for technology evolution, without specifying
what that technology should or will be. In
this context, Moore’s law is simply an
expression of faith in the engineering com-
munity’s ability to have a manufacturing
solution available in the required time-
frame.
Given the long lead-time for technology
development in the semiconductor industry,
management must make a rational assess-
ment of practical performance "limits" of
the prevailing technology and decide
whether they reflect a true performance
limitation caused by some underlying phys-
ical principle, or an engineering limitation
in one or more of the sustaining technolo-
gies. S-curve methodology tells us that if
we are at the physical limit of performance
of a prevailing technology, we have no
choice but to opt for the discontinuity, pro-
vided a viable technology and business
model can be implemented.
The choice is more difficult when the limita-
tions are perceived as engineering in
nature. The industry’s commitment to
Moore’s Law precludes the luxury of wait-
ing to see if developments in the prevailing
technology prove capable of meeting man-
ufacturing needs several years hence. The
risks of adopting such a technology strate-
gy are simply too great. Hence the strategy
of the industry has been to do both, viz.,
attempting to solve the engineering prob-
lems thereby moving further up the S-curve
of the prevailing optical technology, while
evaluating alternative approaches aimed
at creating technological discontinuity. Had
the industry realized back in 1970 just
how far it was from the true physical limita-
tion of optical lithography, it may not have
committed the level of funds that it did to
the alternative technologies of e-beam and
X-ray. The fact is it did not know, which
drove the leading edge companies to
hedge their bets by pursuing e-beam and
X-ray lithography in addition to efforts
aimed at continuing the optical paradigm.
The optical lithography example demon-
strates another tenet of S-curve thinking,
viz., the extant technology will continue to
prevail as long as it provides an economic
solution to the problems it confronts. The
ultimate resolution capability of e-beam
lithography is higher than that of optical
lithography, but given the continued evolu-
tion of optical technology to meet indus-
try’s needs over the past 40 years, there
has been no economic incentive to switch
to e-beam. As a general rule, the invest-
ment in the prevailing technology is so
great that industry will extract every last
measure of performance before switching
to an alternative. This tenet also holds true
within the technologies sustaining optical
lithography. Taking wavelength as an
example, the switch by the industry to the
next (lower) wavelength has invariably
taken place only when the diffraction limit
of the preceding wavelength has been
reached. This has important implications
for resist developers who must anticipate
resolution needs encompassed by a partic-
ular exposure technology, in order to opti-
mize their R&D investment profile.
How much further will optical lithography
extend? And what lies beyond? As was
the case in 1970, massive investments con-
tinue to be made in alternative next gener-
ation lithographic technogies (NGL) in
anticipation of the death of optical lithogra-
phy, which is now expected around 50nm.
The front-runners are extreme ultraviolet
(EUV) and projection e-beam, but both
have engineering limitations that remain to
be overcome. Today, there is even talk of
the death of Moore’s Law itself which, like
the Concorde airplane, will likely be driven
by economic constraints rather than tech-
nology capability. s
Murrae Bowden is Executive in Residence and Director of the Executive Master of Technology Management program
at the Wesley J. Howe School of Technology Management (mbowden@stevens.edu). Dr. Bowden has had a distin-
guished 30-year career in research and research management in the telecommunications and chemical industries, includ-
ing the positions of Director, R&D Microelectronics Materials Division, Arch Chemicals (formerly Olin Microelectronic
Materials), and Assistant Vice President, Network Technologies Research, Bell Communications Research (Bellcore).
About theAuthor