2. bandgap, electron hopping dominates transport processes
where it accompanies lattice distortion, bearing small po-
laron hopping conduction. Vanadium ions in V2O5 take on
oxidation states of V4+
or V5+
, and the V4+
population is
essentially equivalent to the small polaron population. The
low concentration of the small polarons in V2O5 comes from
the unintentional dopants and/or oxygen vacancies. In addi-
tion, small polaron hopping materials tend to have low elec-
tron mobility. For V2O5, it is in the range of
ϳ0.03–2.2 cm2
V−1
s−1
.10
Both the small number of po-
larons and low electron mobility explain the low electrical
conductivity of V2O5. Our preliminary experiments have
shown that a pure V2O5 thin film has an electrical conduc-
tivity of ϳ4ϫ10−4
⍀−1
cm−1
, but has a high Seebeck coef-
ficient of ϳ−540 V/K ͑n type͒.
While the Seebeck coefficient of the V2O5 is high, which
is desirable, a subtle change in impurity or oxygen vacancy
concentrations causes a comparatively large variation in this
value. Obviously, this is not ideal for device applications,
where device to device variation of the Seebeck coefficient
must be minimized. As will be described later, Heike’s
formula11
can be generally applied to estimate the Seebeck
coefficient values; thus once the V4+
concentration increases
to more than ϳ5%, the change of the Seebeck coefficient
becomes less significant. From a device viewpoint, this could
be a practical solution to stabilize the Seebeck coefficient.
We proposed to increase the V4+
concentration by dop-
ing. This allows factors such as oxygen deficiencies or im-
purities to take fewer roles in determining Seebeck coeffi-
cient values. Instead, the thermoelectric properties are then
determined by the doping concentration, which is technically
easier to control. Sodium was chosen as a dopant in this
study for its ease of ionization and formation of several
phases of the composition NaxV2O5, including ␣-NaxV2O5
for xഛ0.02,10
-NaxV2O5 for 0.22ഛxഛ0.4,10
and
␣Ј-NaxV2O5 for x=1.12
Both ␣- and ␣Ј-NaxV2O5 form
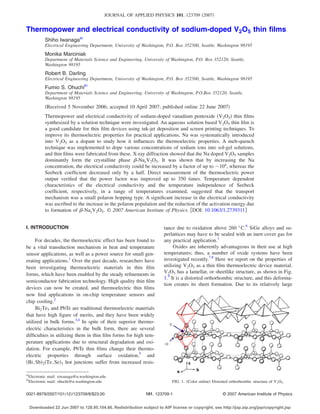
sheetlike two-dimensional structures, maintaining a distorted
orthorhombic V2O5 layered structure, whereas -NaxV2O5 is
known as a stable phase, crystallizing into a monoclinic,
quasi-one-dimensional structure with high electrical conduc-
tivity in the b direction.13
A -NaxV2O5 is the phase evalu-
ated in this study. Addition of sodium to V2O5 is also ex-
pected to improve the electrical conductivity ͑͒, whereas
any reduction of the Seebeck coefficient ͑S͒ may be compen-
sated by an increase of the electrical conductivity, thus im-
proving the overall power factor as described by S2
.
For processing, we developed a solution based method
to fabricate thin films by dip coating and/or screen printing,
since a stable V2O5 gel solution can be prepared through a
simple method called “melt quench.”14,15
This solution may
be further utilized for deposition with an ink-jet printer. Pre-
liminary results with V2O5 ink have shown that ink-jet print-
ing is a suitable deposition technique to make patterns on a
substrate. For example, various patterns including squares
and fine lines, with a width of about 80 m, were patterned
on a glass substrate. For device fabrication, this is an attrac-
tive method, since it eliminates the need for lithography and
chemical etching, and, if properly developed, it can be
readily used for on-chip applications.
This paper describes the electrical conductivity and ther-
mopower of Na doped V2O5 thin films that were fabricated
by an altered melt-quench method, which allows incorporat-
ing of Na ions into the V2O5 lattice. Analysis including See-
beck measurements, electrical conductivity, and power mea-
surements, x-ray diffraction ͑XRD͒, and x-ray photoelectron
spectroscopy ͑XPS͒, will be discussed to illustrate optimum
processing conditions and explain how the doping influences
the thermoelectric properties.
II. EXPERIMENTAL DETAILS
A. Sample preparation
To synthesize Na+
doped V2O5 thin film specimens, Na+
containing V2O5 solutions were prepared first by the melt-
quench technique. In this method, V2O5 powders were
melted to 900–1000 °C, in a ceramic or platinum crucible
and held at temperature for 30 min. Note that the melting
temperature of V2O5 is 670–685 °C.16
The melt was then
poured into de-ionized ͑DI͒ water containing NaCl, and was
stirred for an hour. By varying the amount of NaCl dissolved
in the water, the amount of Na doping in V2O5 was con-
trolled ͑Table I͒.
At a 1:1 molar ratio of V2O5:NaCl, the melt did not
gelatinize, instead precipitants were accumulated at the bot-
tom of the container. Successively reducing the molar ratios,
the melt solution was turned into a gel, leaving no precipi-
tants below the ratio of 1:0.38. A doped V2O5 solution cre-
ated in this manner was deposited on a quartz substrate by a
small pipette, uniformly spread over the surface using a tip
of the pipette and/or a thin sheet of silica substrate. After air
drying, a film was annealed in air at 400 °C for 10 min.
Three doped films, labeled NA3, NA2, and NA1, were
prepared from solutions with different Na+
concentrations.
Thin film sample NA3, created from a solution with the
V2O5:NaCl ratio of 1:0.38, contains the highest concentra-
tion of Na doping in V2O5. NA2 is a medium doped film,
and NA1 is lightly doped. It is noted that the molar ratios
shown in Table I only indicate the amount of Na+
contained
in the solution, thus the actual amount of Na+
present in the
thin films may be different. A total of four films, three doped
films and a V2O5 film as a reference, were used for this
investigation. The thickness of each film was measured by a
stylus profilometer ͑Alpha-Step, KLA-Tencor Inc.͒. The typi-
cal thickness was about 1 m.
TABLE I. Prepared samples with various concentration.
Sample V2O5 :NaCl ratio Remarks
V2O5 1:0
Successfully
made into the
films
NA1 1:0.028
NA2 1:0.2
NA3 1:0.38
– 1:0.5
Precipitated– 1:0.8
– 1:1
123709-2 Iwanaga et al. J. Appl. Phys. 101, 123709 ͑2007͒
Downloaded 22 Jun 2007 to 128.95.104.66. Redistribution subject to AIP license or copyright, see http://jap.aip.org/jap/copyright.jsp
3. B. Seebeck and electrical conductivity measurements
Seebeck coefficients were measured using a custom-built
probe system under low vacuum ͑ϳ10−2
mTorr͒ to prevent
heat conduction through air. The sample was bridged be-
tween two copper blocks; one end for the heat source and the
other end for the heat sink to establish a temperature gradient
necessary to generate the Seebeck voltage. An electrometer
͑Keithley model 6512͒ was used to measure the Seebeck
voltage between the two ends. Two thermocouples at both
ends of the sample measured the temperature difference ⌬T.
These were spring loaded and were pushed against the sam-
ple’s surface. The Seebeck coefficient was determined by
measuring the Seebeck voltage ⌬V as a function of tempera-
ture difference ⌬T. Since ⌬V=S⌬T, Seebeck coefficient
could be found from the slope.
For the measurement of electrical resistance at room
temperature, a custom-built four-point probe station was as-
sembled. The resistance was computed from V/I. To find the
absolute resistivity, the sample and electrode geometries
were compensated by a geometric factor F4 which takes into
account sample thickness ͑w͒, sample length ͑a͒, width ͑d͒,
and the distance between the probes ͑s͒. The F4 parameter
can be found in published tables,17
and the resistivity for a
square thin film sample is expressed as
=
V
I
wF4ͩa
d
,
d
s
ͪ for
w
s
Ͻ 0.5. ͑1͒
The activation energy for electrical conduction was de-
termined by measuring the resistance as a function of tem-
perature. The resistance was measured using a two-point
probe setup with the electrodes formed by silver paste with a
gold wire attached to them. Temperature of the vacuum fur-
nace was first raised to about 120 °C, and then slowly
cooled. Thermal equilibrium was maintained during the
course of measurements. As will be discussed later, the elec-
trical conduction is explained by small polaron hopping for
both pure V2O5 and Na doped V2O5. Plotting the natural log
of the quantity /T versus 1/T, the slope yields the activa-
tion energy.
C. Power factor measurements
In order to determine the power factor, the output power
P was directly measured by a method illustrated in Fig. 2.
This method allows the measurement of current and voltage
generated by the Seebeck effect, from which the output
power is calculated. In this measurement, an adjustable cur-
rent source ͑Isource͒ is connected to the sample in parallel so
as to provide a current with the direction opposite to the
thermoelectric current ͑I͒ generated by the Seebeck effect. If
Isource becomes equal to I, the total current reading is zero,
and the voltage reading is that of the open circuit voltage
͑VOC͒. By adjusting the current source, the operating point
can be swept along the load line. From these I-V character-
istics, the output power ͑load characteristic, P͒ was calcu-
lated. The maximum output power was taken from the maxi-
mum value of the curve.
D. X-ray diffraction and x-ray photoelectron
spectroscopy
Phase compositions of the thin films were determined by
a PW 1830 powder diffractometer ͑PANalytical Inc., Natick
MA͒ using a Cu K␣ x-ray source. XPS data were taken from
an Axis-Ultra DLD spectrometer ͑Kratos Inc. New York͒ at
FIG. 2. ͑Color online͒ Schematic of the power measurement setup.
FIG. 3. ͑Color online͒ ͑a͒ XRD of thin film samples with various Na con-
centrations, annealed at 400 °C for 10 min. ͑b͒ XRD of thin film made from
the same solution as NA3 with annealing temperatures of 500 and 600 °C
for 10 min. “?” is an undetermined peak.
123709-3 Iwanaga et al. J. Appl. Phys. 101, 123709 ͑2007͒
Downloaded 22 Jun 2007 to 128.95.104.66. Redistribution subject to AIP license or copyright, see http://jap.aip.org/jap/copyright.jsp
4. room temperature with an Al K␣ source. Pressure in the ana-
lytical chamber during spectral acquisition was less than 5
ϫ10−9
Torr. XPS was used for estimating the relative popu-
lation of V4+
and V5+
species from the area under the curve
of the respective peaks.
III. RESULTS
A. Crystal structure
Shown in Fig. 3͑a͒ is a series of XRD spectra obtained
from thin film samples annealed at 400 °C for 10 min. For
Na doped samples, diffraction peaks that belong to the
Na0.33V2O5 and/or -NaxV2O5 phase were observed. Two
characteristic peaks at 12.198° and 29.111°, which corre-
spond to the ͑002͒ and ͑104͒ planes of -NaxV2O5, respec-
tively, show high intensity, indicating that the b direction of
the crystalline phase is aligned parallel to the substrate.
The medium and low doped samples ͑NA1 and NA2͒
formed mixed phases. -NaxV2O5 is present in addition to
the original V2O5 phase, indicating that the amount of Na
incorporated in the whole structure was insufficient to form a
uniform phase. This explains the two observed phases in
these samples.
Increasing the Na concentration, the XRD spectrum for
sample NA3 shows no or little V2O5 phase present; instead,
there is a strong new peak appearing as a secondary phase.
The ␥-NaV3O8−␦ powder diffraction file was found to match
this peak. Annealing NA3 at higher temperatures for 10 min,
the secondary phase peak was successively reduced ͓Fig.
3͑b͔͒, and at 600 °C, a thin film consisting of mostly
-NaxV2O5 was obtained. This sample annealed at 600 °C is
named as NA3c. It contains minimum secondary phase, and
will be used for further investigation. Longer annealing times
͑more than 10 min͒ did not improve the thin film quality. A
summary of XRD results is shown in Table II.
B. XPS measurements
V2p photoemission spectra obtained from samples NA2
and NA3c are shown in Fig. 4, where a peak corresponding
to the V5+
state appears at 517.45 eV and V4+
at 515.87 eV.
The areas under the curve reflect the population of the re-
spective species, thus allowing the relative areas for the V5+
and V4+
states to be computed. For NA3c, it is found that the
V4+
/͑V5+
+V4+
͒ area ratio is 1641/͑18062+1641͒, thus the
fraction for V4+
is 0.0833, and for NA2, it is 714/͑21194
+714͒, or 0.0377. The fraction of V4+
for the V2O5 sample
was not determined since the V4+
peak was too small to be
measured.
C. Seebeck and electrical conductivity measurements
Typical data from the Seebeck measurements are shown
in Fig. 5, where the data form a straight line with a ⌬V
intercept of nearly 0 mV at ⌬T=0. Results from all the
samples ͑V2O5, NA1, NA2, NA3, and NA3c͒ exhibited simi-
lar characteristics, and their constant Seebeck coefficients
were determined over the whole range of ⌬T measured.
Variation of the Seebeck coefficient and the electrical
conductivity measured at room temperature are shown in
Figs. 6͑a͒ and 6͑b͒, respectively. The pure V2O5 thin film
sample had a high Seebeck coefficient of −540 V/K and an
electrical conductivity of 4ϫ10−4
⍀−1
cm−1
. With increased
doping, the Seebeck coefficient successively decreased, and
dropped by a factor of 2 for NA3. Annealing at higher tem-
peratures did not affect the Seebeck value as seen in NA3c.
As expected, the electrical conductivity dramatically in-
creased with Na doping by an overall factor of ϳ104
increase
for both NA3 and NA3c, although slightly larger for NA3c
than NA3. This dramatic increase in the electrical conductiv-
ity with a simultaneous factor of 2 decrease in the Seebeck
coefficient leads to a improvement of the power factor de-
scribed by S2
. To further assess this effect, the following
experiments were conducted.
Shown in Fig. 7 is the power factor ͑PF͒ measurement
using the method described in Sec. II C. The horizontal axis
is the measured current, and the vertical axis is the PF. Fig-
ure 7͑b͒ shows the maximum values for PF found from the
measurements in Fig. 7͑a͒. It was found that NA3 and NA3c
showed an increase of PF by factors of ϳ150 and 350, re-
spectively.
TABLE II. Summary for XRD results.
Sample Anneal temp. Phases
V2O5 400 C V2O5
NA1 400 C V2O5, -NaxV2O5
NA2 400 C V2O5, -NaxV2O5
NA3 400 C -NaxV2O5, ␥-NaV3O8−␦
NA3b 500 C -NaxV2O5, ␥-NaV3O8−␦ ͑reduced͒
NA3c 600 C -NaxV2O5, ␥-NaV3O8−␦ ͑reduced͒
FIG. 4. ͑Color online͒ XPS spectrum
of V2p and its curve fitting for ͑a͒
NA2 and ͑b͒ NA3c.
123709-4 Iwanaga et al. J. Appl. Phys. 101, 123709 ͑2007͒
Downloaded 22 Jun 2007 to 128.95.104.66. Redistribution subject to AIP license or copyright, see http://jap.aip.org/jap/copyright.jsp
5. IV. DISCUSSION
While the thin film samples obtained through the melt-
quench technique consist of multiple phases, subsequent an-
nealing can suppress the amount of ␥ phase with increasing
the temperature. At annealing temperature of 600 °C, a
nearly single phase of -NaxV2O5 is formed. A binary phase
diagram for V2O5–NaVO3, shown in Fig. 8,18
was used to
assess the phase relations for the V2O5–NaV2O5 system.
The molecular percentage in this diagram is determined by
calculating how much Na, V, and O are present in the glassy
form of the film sample. It should be noted that, although the
melt-quench method is a unique way of incorporating ions
into the glassy V2O5 structure, care must be taken to inter-
pret the phase diagram, as the systems under investigation
are not in thermal equilibrium, however, subsequent anneal-
ing was made under nearly equilibrium conditions.
Based on the amount of NaCl used during preparation,
the estimated concentration of Na in NA2 is 17.3 mol %.
This is indicated by location ͑1͒. The phase diagram indi-
cates two phases, ␣- and -NaxV2O5 at 400 °C, recalling
that the XRD results previously shown contained two phases,
-NaxV2O5 and V2O5. Since V2O5 is ␣-NaxV2O5 at x=0,
this diagram predicts the film composition of what would be
thermally stabilized, so that the result can be compared to the
phases found from XRD. For the NA3 sample, the concen-
tration is estimated to be about 32.9 mole %, which is indi-
cated by location ͑2͒. At an annealing temperature of
400 °C, this composition lies in the two-phase field, consist-
ing of -NaxV2O5 and ␥-NaxV3O8−␦. This also suggests that
the second phase in the XRD spectra is most likely
␥-NaxV3O8−␦.
At temperatures above 592 °C, the phase diagram pre-
dicts that the ␥ phase will be liquefied, replaced by the 
+L field. Annealing at temperatures slightly higher than
592 °C, the majority of the phase becomes -NaxV2O5 plus
a small amount of L ͑based on the Lever rule͒; thus, the
quenching from this temperature produces material consist-
ing predominantly of -NaxV2O5. The XRD results of
samples with annealing temperatures of 500 and 600 °C in
Fig. 3͑b͒ show the decreasing intensity of ␥-NaxV3O8−␦. This
tendency is consistent with the phase diagram. Thus, the re-
duction of the ␥ phase by increasing the annealing tempera-
ture can be understood from the phase diagram.
FIG. 5. ͑Color online͒ A typical Seebeck coefficient data.
FIG. 6. ͑Color online͒ ͑a͒ Seebeck coefficient vs Na% and ͑b͒ electrical
conductivity vs Na%.
FIG. 7. ͑Color online͒ ͑a͒ Power factor ͑PF͒ measurement and ͑b͒ maximum
PF. NA3c, annealed in higher temperature of 600 °C, is in blue triangle. It
has increased conductivity, thus improving the PF.
123709-5 Iwanaga et al. J. Appl. Phys. 101, 123709 ͑2007͒
Downloaded 22 Jun 2007 to 128.95.104.66. Redistribution subject to AIP license or copyright, see http://jap.aip.org/jap/copyright.jsp
6. Successively fabricated samples mostly consisting of
-NaxV2O5 by combination of melt quench and subsequent
annealing have shown approximately twofold decreases in
their Seebeck values and a factor of ϳ104
increases in their
electrical conductivity, resulting in the overall improvement
of the power factor up to 350 times ͑Figs. 6 and 7͒. This
improvement is obviously advantageous from the device per-
spective.
There is evidence that small polarons are responsible for
determining the transport properties of the Na doped V2O5
samples. The activation energy for electrical conduction is
calculated from the slope of the Arrhenius plot shown in Fig.
9. There are two models describing polaron hopping: ͑a͒ the
Holstein model for small polaron hopping and ͑b͒ the vari-
able range hopping ͑VRH͒ model.19
For conduction ex-
plained by the small polaron hopping model, the natural log
of the quantity /T should be proportional to 1/T, whereas
the VRH model predicts the natural log of to be propor-
tional to 1/T1/4
. The linear curve fittings are also shown in
Fig. 9 as dotted lines. The R2
values to determine the likeli-
hood for the fitting function were 0.9997 and 0.9983 for
small polaron hopping and VRH, respectively. Although the
difference was small, the present data are consistent to the
small polaron model for given temperature range of the mea-
surements as compared to the fitting done by VRH. The ac-
tivation energies evaluated from each sample were plotted in
Figure 10.
Next, a typical Seebeck measurement result shown in
Fig. 5 indicates that the Seebeck coefficient is independent of
the applied temperature. This is a typical characteristic of the
small-polaron-hopping-type material.20
At least in the mea-
sured temperature range up to the average temperature of
ϳ62.6 °C, this trend was observed for all samples. In this
case, most polaron carriers are thermally activated or ion-
ized. If, however, only a fraction of the carriers were to be
activated at a given temperature, the carrier concentration
would have changed depending on the temperature, thus a
temperature dependence on the Seebeck coefficient would
have been seen. Obviously, this is not in the case, where the
Seebeck coefficient is independent of the operating tempera-
ture.
Since small polaron hopping is responsible for carrier
transport, Heike’s formula represents a relationship between
the Seebeck coefficient and the small polaron population C
for the Na doped V2O5 samples,21
FIG. 8. ͑Color online͒ The phase diagram of V2O5 –NaVO3. Location ͑1͒
indicate where NA2 sample would be placed in this diagram. ͑2͒ NA3 and
͑3͒ NA3c.
FIG. 9. ͑Color online͒ ͑a͒ Typical ln͑/T͒ vs 1/T graph of the sample
NA3c. Experimental data are in solid blue line, and the curve fit is the red
dotted line. It shows a better match to Holstein’s small polaron model over
the variable range hopping ͑VRH͒ model shown in ͑b͒.
123709-6 Iwanaga et al. J. Appl. Phys. 101, 123709 ͑2007͒
Downloaded 22 Jun 2007 to 128.95.104.66. Redistribution subject to AIP license or copyright, see http://jap.aip.org/jap/copyright.jsp
7. S =
k
q
lnͩ C
1 − C
ͪ=
k
q
lnͩV4+
V5+ͪ, ͑2͒
where C is the ratio of V4+
concentration to the total vana-
dium ions concentration ͑V4+
+V5+
͒, k is Boltzmann’s con-
stant, and q is the electronic charge.
Seebeck coefficients for NA3c and NA2 were calculated
using C found from XPS analysis, and were compared with
the measured Seebeck coefficient values. The Seebeck coef-
ficient of the NA3c sample was estimated from Heike’s for-
mula ͓Eq. ͑2͔͒ using the V4+
concentration, S
=͑k/q͒ln͑V4+
/V5+
͒=͑k/q͒ln͑1641/18062͒=−207 V/K.
This value matches reasonably with the measured value,
−218 V/K. Similarly, the Seebeck coefficient of NA2
sample was calculated to be −289 V/K, corresponding to
the measured value of −245 V/K. In Fig. 11, the Seebeck
coefficient versus small polaron concentration C ͑or V4+
͒ for
NA2 and NA3c is plotted as a solid red square and a solid
blue triangle, respectively. The solid green line indicates
Heike’s formula. Using independently measured Seebeck co-
efficients, C for V2O5 and NA1 samples were estimated us-
ing Heike’s formula as shown in Table III in polaron concen-
tration. C is, therefore, increased by ϳ50 times after doping.
In the phase diagram of Fig. 8, a possible origin of the ␥
phase found in NA3 is described. We have utilized the phase
diagram to minimize the amount of ␥ phase in NA3c. De-
spite the large difference in the amount of the ␥ phase
present in the NA3 and NA3c samples, their Seebeck values
were similar. This suggests that the ␥ phase present in NA3
does not contribute to the overall Seebeck effect of the
sample. However, there is no supporting data currently avail-
able for elucidating the role of this phase in the Seebeck
effect in these materials.
The increase in electrical conductivity by a factor of
ϳ104
times was observed upon doping, and this can be at-
tributed to the large changes in both Nernst-Einstein mobility
and the activation energy. Electrical conductivity in the small
polaron hopping model is described by the Nernst-Einstein
equation,21,22
=
Ne2
d2
C͑1 − C͒
kT
expͩ− EA
kT
ͪ. ͑3͒
The preexponent part is called the Nernst-Einstein mobility.
N is the total carrier concentration of electrons and holes
͑V4+
+V5+
͒, is the hopping frequency, d is the hopping
distance between V ions, C is the ratio ͓V4+
/͑V4+
+V5+
͔͒,
and EA is the activation energy. The increase in C by about
50 times has been determined by XPS analysis ͑Table III͒
and this increase in the concentration of small polarons con-
tributes to the increase in Nernst-Einstein mobility. Other
factors such as d and should not be significantly varied. In
particular, the interatomic distance of vanadium atoms for
V2O5 is reported to be 3.08 Å, and 3.06–3.49 Å for
Na0.33V2O5.20,23
Further, a decrease in the activation energy from
0.26 to 0.122 eV also contributes to the increase in the ex-
ponential part of the equation. Reported values of the activa-
tion energies for V2O5 range from 0.22 eV ͑Ref. 14͒ to
0.5 eV ͑Ref. 24͒, and single crystal Na0.33V2O5 is cited as
0.05 eV.25
This trend of decreasing activation energy is also
reported from successive Na doping in ␣-NaxV2O5.10
These
reports support our result of decreasing activation energy.
Considering these facts together, it is concluded that signifi-
cant improvement in the electrical conductivity of Na doped
V2O5 is due to the increase in the Nernst-Einstein mobility
and the decrease in the activation energy for small polaron
hopping.
FIG. 10. ͑Color online͒ Activation energy of the samples.
FIG. 11. ͑Color online͒ Seebeck coefficient vs C concentration graph of the
samples. C values for NA2, in red square, and NA3c, in blue triangle, were
derived from XPS data. Solid dark green line is Heike’s formula. Using
measured Seebeck coefficients, C values for V2O5 and NA1 samples were
estimated from Heike’s formula, as shown in arrows.
TABLE III. C determined from combination of XPS analysis and Heike’s
formula.
Sample C
Seebeck
͑XPS͒
Seebeck
͑measured͒
V2O5 0.00169a
– −540
NA1 0.01809a
– −345
NA2 0.0377 −289 −245
NA3c 0.0833 −207 −218
a
Values estimated from Heike’s formula, based on measured Seebeck coef-
ficients.
123709-7 Iwanaga et al. J. Appl. Phys. 101, 123709 ͑2007͒
Downloaded 22 Jun 2007 to 128.95.104.66. Redistribution subject to AIP license or copyright, see http://jap.aip.org/jap/copyright.jsp
8. V. CONCLUSIONS
A V2O5 melt quench technique was modified to incorpo-
rate Na ions into V2O5 solutions. This preparation method
was demonstrated to fabricate high quality Na doped V2O5
thin films for thermoelectric device applications. XRD re-
sults revealed successive incorporation of Na to V2O5, form-
ing -NaxV2O5 together with ␥ phase at annealing tempera-
tures of TϽ400 °C. Increasing the annealing temperature to
600 °C, the amount of the ␥ phase was substantially re-
duced. The V2O5–NaVO3 binary phase diagram was used to
explain the reduction of the ␥ phase. The Seebeck coefficient
and electrical properties measurements showed that the
phase change to -NaxV2O5 significantly improved the elec-
trical conductivity by a factor of ϳ104
, but decreased the
Seebeck values by a factor of 2 only. The activation energy
measurement and small polaron concentration estimation by
XPS and Heike’s formula revealed that the significant in-
crease in the electrical conductivity was attributed to the in-
crease in the small polaron concentration by 50 times, and a
decrease in the activation energy by a half. The power factor
was increased up to ϳ350, demonstrating that this technique
improved the thermoelectric properties of the V2O5 thin
films.
ACKNOWLEDGMENTS
This work was financially supported in part by the
FY2004 International Joint Research Program of the New
Energy Development Organization ͑NEDO͒, the 2005-06
Ford Motor Company Fellowship, and a University of Wash-
ington Royalty Research Fund grant.
1
J. Yang and T. Caillat, MRS Bull. 31, 224 ͑2006͒.
2
R. C. Chu and R. E. Simons, Proceedings of the International Conference
on Thermoelectric, 1999 ͑IEEE, New York, 1999͒, p. 270.
3
H. J. Goldsmid, Proc. Phys. Soc. London 71, 633 ͑1958͒.
4
Y. Gelbstein, Z. Dashevsky, and M. P. Dariel, Physica B 363, 196 ͑2005͒.
5
E. I. Rogacheva, S. G. Lyubchenko, and M. S. Dresselhaus, Thin Solid
Films 476, 391 ͑2005͒.
6
C. Huang and A. Christou, Mater. Sci. Eng., B 29, 233 ͑1995͒.
7
I. Terasaki, Y. Sasago, and K. Uchinokura, Phys. Rev. B 56, R12685
͑1997͒.
8
K. Koumoto, I. Terasaki, and R. Funahashi, MRS Bull. 31, 206 ͑2006͒.
9
F. Hulliger, in Structural Chemistry of Layer-Type Phases, edited by F.
Lévy ͑Reidel, Dordrecht, 1976͒, Fig. 100, with kind permission of
Springer Science and Business Media.
10
D. K. Chakrabarty, D. Guha, and A. B. Biswas, J. Mater. Sci. 11, 1347
͑1976͒.
11
J. Doumere, J. Solid State Chem. 110, 419 ͑1994͒.
12
H. G. von Schnering, Yu. Grin, M. Kaupp, M. Somer, R. K. Kremer, O.
Jepsen, T. Chatterji, and M. Weiden, Z. Kristallogr. - New Cryst. Struct.
213, 246 ͑1998͒.
13
H. Yamada and Y. Ueda, J. Photogr. Sci. 68, 2735 ͑1999͒.
14
J. Bullot, O. Gallais, M. Gauthier, and J. Livage, Appl. Phys. Lett. 36, 986
͑1980͒.
15
Y. Zhang, X. Hu, Y. Liu, Q. Gu, and Y. Cheng, Electrochem. Solid-State
Lett. 8, A646 ͑2005͒.
16
The Oxide Handbook Second edition, edited by G. V. Samsonov ͑IFI/
Plenum, New York, 1982͒, p. 52.
17
CRC Handbook of Thermoelectrics, edited by D. M. Rowe ͑CRC, Boca
Raton, 1995͒.
18
E. M. Levin, C. R. Robbins, and H. F. McMurdie, Phase Diagrams for
Ceramists, edited by M. K. Reser ͑ACS, Columbus, Ohio 1964͒ Fig. 5076.
Reprinted with permission of The American Ceramic Society, www.ce-
ramics.org. Copyright 1964. All rights reserved.
19
R. Dannenberg, S. Baliga, R. J. Gambino, A. H. King, and A. P. Doctor, J.
Appl. Phys. 86, 514 ͑1999͒.
20
J. B. Goodenough, Annu. Rev. Mater. Sci. 1, 101 ͑1971͒.
21
P. Kounavis, A. Vomvas, E. Mytilineou, M. Roilos, and L. Murawski, J.
Phys. C 21, 967 ͑1988͒.
22
M. M. El-Desoky, J. Mater. Sci.: Mater. Electron. 14, 215 ͑2003͒.
23
R. Rambez, B. Casal, L. Utrera, and E. Ruiz-Hitzky, J. Phys. Chem. 94,
8960 ͑1990͒.
24
D. S. Volzhenskii and M. V. Pashkovskii, Sov. Phys. Solid State 11, 950
͑1969͒.
25
J. H. Perlstein and M. J. Sienko, J. Chem. Phys. 48, 174 ͑1968͒.
123709-8 Iwanaga et al. J. Appl. Phys. 101, 123709 ͑2007͒
Downloaded 22 Jun 2007 to 128.95.104.66. Redistribution subject to AIP license or copyright, see http://jap.aip.org/jap/copyright.jsp