
Recommended
More Related Content
Similar to Lap experiments and reports (physics: classical mechanics).pdf
Similar to Lap experiments and reports (physics: classical mechanics).pdf (20)
Recently uploaded
Recently uploaded (20)
Lap experiments and reports (physics: classical mechanics).pdf
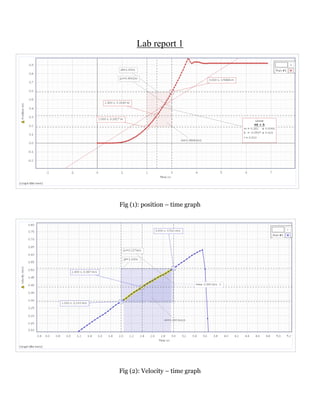
- 1. Lab report 1 Fig (1): position – time graph Fig (2): Velocity – time graph
- 2. Fig (3): Acceleration – time graph Fig (4): report readings
- 3. Fig (5): Kinetic energy K, potential energy U, total energy E and angle graphs with time In Potential energy graph, what does the maximum value represent? Total energy when body is at the maximum height (displacement) as Kinetic energy at this height is zero where M = K + U In the kinetic energy graph, what does the maximum value represent? Total energy when the body is at the equilibrium position in the middle where U = 0 What is the relation between potential and kinetic energy? It is expressed through mechanical energy as M = K + U where M is mechanical energy, K is kinetic energy and U is potential energy (Mechanical energy = Kinetic energy + potential energy) so it is a decreasing relation where M is constant Write your comment on the graphs. The data could have been more accurate by considering air friction, friction in the rope and Any energy losses in form of heat
- 4. Is total mechanical energy conserved? And how can you support your answer? Yes, when K decreases by a certain value during approaching equilibrium point, U increases by the same value so their sum which is the total mechanical energy stays the same (M = K + U) At t= 6 sec, write the value of each graph (Potential, kinetic and total mechanical energy)? Write whether it’s maximum, minimum, increasing, decreasing or constant? K = 0.025 J increasing U = 0.022 J decreasing M = 0.047 J Constant
- 5. Lap report (2) Exp 1: Newton’s second law
- 9. Velocity – time graph (run 1 – run 10)
- 14. Force – time graph (run 1 – run 10)
- 15. Procedures – part B Force – acceleration graph
- 16. Do these graphs support Newton’s second law? Explain your answer fully! Don’t forget that there is some uncertainty here (𝛥a from Procedure B). Does it explain any deviations from what Newton would predict? With a percentage of error ranging between 2.5% and 8%, those graphs support newton’s second law to the much of extent they can withstand given certain conditions being omitted or misrepresented during experimentation. What is the percentage of difference between the theoretical and experimental values? Theoretical cart mass = 0.375 kg Experimental cart mass = 0.345 kg Theoretical (cart + mass bar) mass = 0.625 kg Experimental (cart + mass bar) mass = 0.642 kg For a cart-only system: the percentage of difference is ( |𝑚(𝑡ℎ) − 𝑚(𝐸𝑥𝑝)| 𝑚(𝑡ℎ) ) ∗ 100 = ( |0.375 − 0.345| 0.375 ) ∗ 100 = 8% For a (cart + mass bar) system: the percentage of difference is ( |𝑚(𝑡ℎ) − 𝑚(𝐸𝑥𝑝)| 𝑚(𝑡ℎ) ) ∗ 100 = ( |0.625 − 0.642| 0.625 ) ∗ 100 = 2.72% Would you expect the vertical intercept to equal zero? Is it? Explain. Yes, because the equation of the line which is y = mx+b is a representation for Newton’s second law formula which is F = ma + 0 when comparing it is obvious that b or the vertical intercept is zero What physical property does the slope of a Force vs. Acceleration graph represent? Hint: what are the units of the slope? Why are the slopes different? Explain.
- 17. Mass, the slope is the ratio between 𝛥𝑦 and 𝛥𝑥 where y is force and x is the acceleration so when considering Newton’s second law F = ma, it is clear that the ratio between F and a is m or the mass of the object which is measured in Kilograms (SI units) … Since the slope in the graphs represents mass and the masses are different (cart only and cart + bar) then the slopes are different How well do your slopes match what you should expect? Not a typical match as there are factors like air friction and friction between the cart and track that were not considered in any of the 10 runs
- 18. Exp 2: Mass oscillation and spring (Hooke’s law) Position – time graph Force – elongated length graph
- 19. 𝑇 = (𝑡2 − 𝑡1) 4 = 0.84 𝑠𝑒𝑐 𝑘(𝑒𝑥𝑝) = 3.05 𝑒𝑟𝑟𝑜𝑟% = ( |3.07 − 3.05| 3.07 ) ∗ 100 = 0.65%
- 20. Lap report (3) Exp 1: Bouncing balls Ball 1 Ball 2 The Energy lost for Ball 1 = ( (0.06215−0.00356) 0.06215 ) ∗ 100 = 94.27% The Energy lost for Ball 2 = ( (0.06023−0.02303) 0.06023 ) ∗ 100 = 61.76%
- 21. Conclusions: 1. It is clear that the elasticity of Ball 2 is greater than that of ball 1 2. High elasticity corresponds with lower energy loss which is clear when analyzing the energy lost from ball 2 and ball 1 Exp 2: Rotational inertia M: Disk mass, r: radius of pulley, R: radius of disk, m: hanged mass, g: gravitational acceleration, 𝛼: angular acceleration Only disk 𝐼𝑡ℎ𝑒𝑜𝑟𝑖𝑡𝑖𝑐𝑎𝑙 = 1 2 𝑀𝑅2 = 0.5 ∗ (0.0444)2 = 1.039 ∗ 10−4 𝑘𝑔 ⋅ 𝑚2 𝐼𝐸𝑥𝑝𝑒𝑟𝑖𝑚𝑒𝑛𝑡𝑎𝑙 = 𝑟𝑚(𝑔−𝑟𝛼) 𝛼 = 0.0245⋅0.01(9.8−0.0245⋅18.6) 18.6 = 1.23*10-4 kg.m2 𝐸𝑟𝑟𝑜𝑟 % = ( |𝐼𝑡ℎ𝑒𝑜𝑟𝑖𝑡𝑖𝑐𝑎𝑙 − 𝐼𝐸𝑥𝑝𝑒𝑟𝑖𝑚𝑒𝑛𝑡𝑎𝑙| 𝐼𝑡ℎ𝑒𝑜𝑟𝑖𝑡𝑖𝑐𝑎𝑙 ) ∗ 100 = 18.38%
- 22. Disk and Ring 𝐼𝑡ℎ𝑒𝑜𝑟𝑖𝑡𝑖𝑐𝑎𝑙 = 1 2 𝑀𝑅(𝑅𝑖⋅ 2 + 𝑅0 2 ) = 1 2 ⋅ 0.1015(0.04452 + 0.03942) = 1.79*10-4 kg.m2 𝐼𝐸𝑥𝑝𝑒𝑟𝑖𝑚𝑒𝑛𝑡𝑎𝑙(𝐷+𝑅) = 𝑟𝑚(𝑔−𝑟𝛼) 𝛼 = 0.0245⋅0.01(9.8−0.0245⋅7.32) 7.32 = 3.22*10-4 kg.m2 Where 𝛼 is angular acceleration for (disk + ring) IExperimental(R) = IExperimental(D+R) − IExperimental(D)= 3.22*10-4 - 1.23*10-4 = 1.99*10-4 kg.m2 𝐸𝑟𝑟𝑜𝑟 % = ( |𝐼𝑡ℎ𝑒𝑜𝑟𝑖𝑡𝑖𝑐𝑎𝑙 − 𝐼𝐸𝑥𝑝𝑒𝑟𝑖𝑚𝑒𝑛𝑡𝑎𝑙| 𝐼𝑡ℎ𝑒𝑜𝑟𝑖𝑡𝑖𝑐𝑎𝑙 ) ∗ 100 = 11.17%
- 23. Experiment Angular accelertation Rotaional Inertia (experi. ) D+R 7.32 rad/s^2 3.22*10-4 kg.m2 D 18.6 rad/s^2 1.23*10-4 kg.m2 Final Table Rotational Inertia (theoritical) Rotaional Inertia (experi. ) Error % D+R 1.039 ∗ 10−4 𝑘𝑔 ⋅ 𝑚2 1.23*10-4 kg.m2 18.38% R 1.79*10-4 kg.m2 1.99*10-4 kg.m2 11.17%
- 24. Lap Report (4) Exp: conservation of linear momentum experiment Explosion for equal masses Explosion for un-equal masses
- 25. Inelastic collision for equal masses Inelastic collision for un-equal masses
- 26. Elastic collision for equal masses Elastic collision for un-equal masses
- 27. Was the momentum conserved in all types in collision? Yes, momentum is always conserved either in elastic or inelastic collisions Was Energy conserved for all types of collisions? It depends but probably the question is referring to the kinetic energy. For kinetic energy: No, it was conserved in elastic collisions but not conserved in inelastic collisions. However, the TOTAL energy was conserved in all cases because the lost kinetic energy turned into other forms of energy as thermal energy or internal energy represented by surface deformations. Where did the extra kinetic energy come from in the explosion? The elastic potential energy that was stored in the cart spring was converted into kinetic energy after collision where the total energy stayed the same. In a more real-life scenario, the kinetic energy would come from the chemical energy stored in car fuel. What happens to the initial kinetic energy that is lost in a collision? As was illustrated before, It turns into other forms of energy such as thermal energy or internal energy being any surface deformations or stored bond-energy or atoms vibration or else.