This study aims to determine signatures in placer gold that indicate hypogene and supergene mineralization processes using trace element analysis via LA-ICP-MS. Samples from several placer deposits were analyzed for major and trace elements. Results show that hypogene gold retains distinct trace element signatures, while supergene gold precipitated by bacterial biofilms does not. Specifically at Prophet Mine, Australia, supergene gold rims on grains do not have clear signatures, likely due to heterogeneous inclusions, but tend to have lower base metals and higher chalcophile elements than hypogene cores. Trace elements like Fe, Se, Sb, Te, Pt, and Hg best differentiate sample populations and signatures.
1. Trace Element Analysis of Placer Gold:
Fingerprinting placer gold populations to track hypogene and supergene processes
Mikkel Tetland1 Dr. John Greenough1 Dr. Frank Reith2
1 University of British Columbia Okanagan 2 University of Adelaide
u Goal of this project is to determine signatures in placer gold of
hypogene and/or supergene mineralization (Fig. 1) using trace
element concentrations determined by LA-ICP-MS analysis.
u Trace element chemistry of placer gold preserving the
hypogene, bedrock source, signature may indicate factors such as
deposit-type, host rock, or temperature/composition of
mineralizing fluids, providing target generation for exploration.
u Placer gold paradox: Why do some placer occurrences contain
coarser sized gold than their bedrock source? Bacterial biofilms
have been shown to precipitate gold in placer settings (Reith et al.
2010); trace elements may fingerprint this supergene gold.
u Sample sets from the Prophet Placer Deposit (Australia), Nus
River (Colombia), Piaba Laterite (Brazil), and 3
placer/paleoplacer occurrences in the Kelowna, BC area (Lambly
Creek, Mission Creek, Winfield) were analyzed for this project.
u SEM-EDS analysis was conducted for major element
composition (Au, Ag, ±Hg) and LA-ICP-MS for trace elements
(Fig. 2) with AuRM2 reference material used as an external
standard (had to first be proven homogenous for micro-analysis).
Introduction
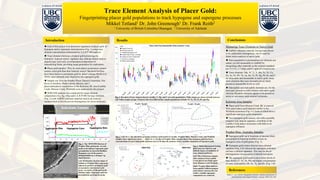
Fig. 2 Box plots of trace element data by locality; V, Hg, and U are semi-quantitative. Wide ranges are observed both between
and within sample groups. Elements that best differentiate sample populations include: Fe, Se, Sb, Te, Pt, and Hg.
Results
Measuring Trace Elements in Native Gold
u AuRM2 reference material, having been shown
to be sufficiently homogenous, can be used for
future micro-analysis of native gold.
u Semi-quantitative concentrations for elements not
added, yet still measurable in AuRM2 by
designating other materials as the external standard,
are: 0.3 (V), 3.7 (Hg), and 0.1 ppm (U) respectively.
u Trace elements: Mg, Al, Ti, V, Mn, Fe, Ni, Cu,
Zn, As, Se, Rh, Pd, Sn, Sb, Te, Pt, Hg, Pb, Bi, and U
are detectable and measurable in native gold; many
more elements that were not analyzed are likely
present at measurable levels as well.
u Siderophile and chalcophile elements are, for the
most part, present in solid solution with native gold
whereas lithophile elements appear to be present as
micro or sub-micro scale mineral inclusions.
Kelowna Area Samples
u Placer gold from Mission Creek, BC is sourced
from paleo-placer gold deposits similar to the
Winfield occurrence (Fig. 4 L) both of which have a
significant supergene gold component.
u Two hypogene gold sources, one with a possibly
orogenic-type deposit signature, contribute to the
Lambly Creek placer occurrence with little to no
supergene influence.
Prophet Mine, Australia, Samples
u Supergene gold, up to hundreds of microns thick,
precipitated by bacterial biofilms occurs on
hypogene cores of gold grains (Fig. 1).
u Hypogene gold retains discrete trace element
signature (Fig. 4 R) whereas the supergene gold does
not have a distinct signature. This may be due to
heterogeneous incorporation of detrital inclusions.
u The supergene gold tends to have lower levels of
base metals (V, Ni, Zn, Pb) and higher concentration
of some chalcophiles (Sb, Se, Te, and Bi). (Fig. 3 R)
Conclusions
References
Reith, F., et al. (2010). Nanoparticle factories: Biofilms hold the key to
Fig. 1 Top: SEM-EDS linescan of
Prophet Mine gold grain. Au rich
peaks (red) indicate supergene gold
precipitation by bacterial biofilms.
Hypogene core of the grain is
distinguishable by a stronger Ag
signal (green).
Left: Backscatter electron image of
biofilm on Prophet Mine gold grain.
Spherical particles of biogenic gold
at nanometer-micrometer scale
occur on surface of the gold grain
(bottom right). Supergene gold has
accumulated, growing the grain.
Fig. 4 Multi-dimensional Scaling
plots (axes are unit-less and
indicate degree of similarity of
trace element patterns)
Left: Plot of Kelowna samples
show analyses from Lambly
Creek plot in two fields apart
from Mission Creek/Winfield .
Right: Prophet Mine analyses
from entirely within hypogene
cores cluster whereas the rest
(with a variable supergene
component) are scattered.
Fig. 3 Left: Pt vs. Hg plot shows grouping of placer gold mostly by locality. Prophet Mine, Mission Creek, and Winfield
samples show significant scatter. Right: Se vs. Sb plot of Prophet Mine samples shows that hypogene gold has lower
concentrations of some chalcophile elements such as Sb than the analyses with a variable component of supergene gold.
gold dispersion and nugget formation. Geology, 38(9), 843–846.
MDS Plot MDS Plot
Gold Grain Transect
Hypogene Core Supergene RimSupergene Rim
Bacterial Biofilm on Gold