
Recommended
Recommended
More Related Content
What's hot
What's hot (20)
Similar to Math for anomaly detection
Similar to Math for anomaly detection (20)
More from MenglinLiu1
Recently uploaded
Recently uploaded (20)
Math for anomaly detection
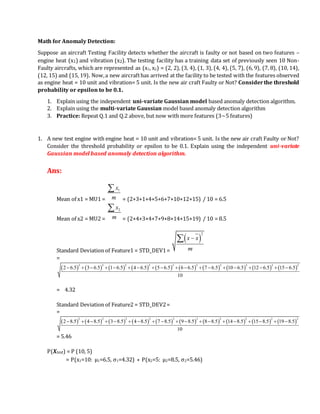
- 1. Math for Anomaly Detection: Suppose an aircraft Testing Facility detects whether the aircraft is faulty or not based on two features – engine heat (x1) and vibration (x2). The testing facility has a training data set of previously seen 10 Non- Faulty aircrafts, which are represented as (x1, x2) = (2, 2), (3, 4), (1, 3), (4, 4), (5, 7), (6, 9), (7, 8), (10, 14), (12, 15) and (15, 19). Now,a new aircrafthas arrived at the facility to be tested with the features observed as engine heat = 10 unit and vibration= 5 unit. Is the new air craft Faulty or Not? Considerthe threshold probability or epsilon to be 0.1. 1. Explain using the independent uni-variate Gaussian model based anomaly detection algorithm. 2. Explain using the multi-variate Gaussian model based anomaly detection algorithm 3. Practice: Repeat Q.1 and Q.2 above, but now with more features (3~5 features) 1. A new test engine with engine heat = 10 unit and vibration= 5 unit. Is the new air craft Faulty or Not? Consider the threshold probability or epsilon to be 0.1. Explain using the independent uni-variate Gaussian model based anomaly detection algorithm. Ans: Mean of x1 = MU1 = 1x m = (2+3+1+4+5+6+7+10+12+15) / 10 = 6.5 Mean of x2 = MU2 = 2x m = (2+4+3+4+7+9+8+14+15+19) / 10 = 8.5 Standard Deviation of Feature1 = STD_DEV1= 2 x x m = 2 2 2 2 2 2 2 2 2 2 2 6.5 3 6.5 1 6.5 4 6.5 5 6.5 6 6.5 7 6.5 10 6.5 12 6.5 15 6.5 10 = 4.32 Standard Deviation of Feature2 = STD_DEV2= = 2 2 2 2 2 2 2 2 2 2 2 8.5 4 8.5 3 8.5 4 8.5 7 8.5 9 8.5 8 8.5 14 8.5 15 8.5 19 8.5 10 = 5.46 P(Xtest) = P (10, 5) = P(x1=10: µ1=6.5, σ1=4.32) * P(x2=5: µ2=8.5, σ2=5.46)
- 2. 1 1 2 2 1 2 2 2 2 2 1 22 21 1 2 2 x x e e 2 2 2 2 10 6.5 5 8.5 2 4.32 2 5.461 1 4.32 2*3.1216 5.46 2*3.1216 e e = 0.09235 * 0.72022 * 0.07307 * 0.81428 = 0.00396 P(Xtest) = 0.00396, whichis much smaller than the threshold (epsilon) of 0.1 Hence, Xtest (10, 5)is an AnomalyorOutlier!
- 4. 2. A new test engine with engine heat = 10 unit and vibration= 5 unit. Is the new air craft Faulty or Not? Consider thethreshold probability orepsilon to be0.1. Explain using the multi-variateGaussianmodel based anomaly detection algorithm For the multi-variate Gaussian model, First you have to construct the variance-covariance matrix. Another Example (for Learning how to Find the COVARIANCE Matrix): The table below displays scores on math, English, and art tests for 5 students. Student Math English Art 1 90 60 90 2 90 90 30 3 60 60 60 4 60 60 90 5 30 30 30 Note that data from the table can be represented in matrix A, where each column in the matrix shows scores on a test and each row shows scores for a student. A = 90 60 90 90 90 30 60 60 60 60 60 90 30 30 30 Given the data represented in matrix A, compute the variance of each test and the covariance between the tests. If you have a set of m examples in the Training Set o {x(1), x(2), ..., x(m) }, Each x ( i ) has n features/dimensions within it Σ - covariance matrix ([n x n] matrix, where n: no. of Features or Variables Also called: Variance-Covariance Matrix
- 5. Now, come back to Our Given Problem … We have 2 Features and 10 examples, as shown below: (x1, x2) = (2, 2), (3, 4), (1, 3), (4, 4), (5, 7), (6, 9), (7, 8), (10, 14), (12, 15) and (15, 19).
- 7. Thus, the value of P(10, 5) is much smaller than ε or 0.10 Hence, the test point (10, 5) is an Anomaly / Outlier!!! ===================================================== 3. Practice: Repeat Q.1 and Q.2 above, but now with more features (3~4 features)