SlideShare a Scribd company logo
1 of 148
Download to read offline
1 | P a g e
Government of India Ministry of Agriculture & Farmers’ Welfare
Department of Agriculture,
Cooperation & Farmers’ Welfare Mahalanobis National Crop
Forecast Centre Near Krishi Vistar Sadan Pusa Campus, New
Delhi-110012
Invitation for Expression of Interest for GP (Gram Panchayat) level
Crop Yield Estimation Using
Technology File No. 6/7(2)/PMFBY/2017-MNCFC (May 2019)
2 | P a g e
i. Introduction
Crop yield monitoring and estimation have proved to be of vital importance for planning and
for taking various policy decisions. The early prediction or forecasting of crop yield well before
harvest is crucial especially in regions characterized by climatic uncertainties. This enables
planners and policy makers to determine the amount of crop insurance to be paid to farmers in
case of famine or a natural calamity. It also enables decision makers to predict how much to
import in case of shortfalls or export in case of surplus.
Remote sensing has proved to be one of the important technologies for the agricultural
sector, as it is one of the backbones for precise agricultural resource mapping and monitoring.
The availability of satellite borne multispectral, multi- resolution and multi-temporal data play an
important role in crop management; their ability to represent crop growth and yield estimation on
the spatial and temporal scale is remarkable.
Precision agriculture (PA) is the application of geospatial techniques and remote sensors to
identify variations in the field and to deal with them using alternative strategies. Precision
agriculture is a way of addressing production variability and optimising management decisions.
Precision agriculture accounts for production variability and uncertainties, optimises resource
use and protects the environment (Gebbers and Adamchuk, 2010; Mulla, 2013).By definition, a
complete precision agriculture system consists of four aspects:
■ Field variability sensing and information extraction, ■ Decision making, ■ Precision field
control, and ■ Operation and result assessment (Yao et al., 2011). Precision agriculture adapts
management practices within an agricultural field, according to variability in site conditions
(Seelan et al., 2003).
Variability is well known to exist within many of agricultural fields. The causes of variability of
crop growth in an agricultural field might be due to tillage operations, influence of natural soil
fertility and physical structure, topography, crop stress, irrigation practices, incidence of pest and
disease etc. Effective management of the crop variability within the field can enhance financial
returns, by improving yields and farm production and reducing cost of production. Various
inputs to the farm such as fertilizers, irrigation, pesticides, seeding, etc. can be adjusted and
applied precisely according to the variability in soil properties and crop growth (Atherton et al.,
1999).
Aerial images have been widely used for crop yield prediction before harvest. These images can
provide high spatial cloud free information of the crop’s spectral characteristics. Analysis of
vegetation and detection of changes in vegetation patterns are important for natural resource
management and monitoring, such as crop vigour analysis. Healthy crops are characterized by
strong absorption of red energy and strong reflectance of NIR energy. The strong contrast of
absorption and scattering of the red and near-infrared bands can be combined into different
3 | P a g e
quantitative indices of vegetation conditions. The potential application of aerial images is
limitless in agriculture; some of them are as under:
■ Identifying and monitoring the spread of crop destroying weeds/pests ■ Monitoring the crop
health ■ Nitrogen content mapping, soil brightness mapping ■ Crop cover, Biomass estimation,
yield prediction.
Biophysical parameters such as plant height and biomass are monitored to describe crop growth
and serve as an indicator for the final crop yield. Multi-temporal Crop Surface Models (CSMs)
provide spatial information on plant height and plant growth.
ii. About the Organisation
Name of the Organization Amity University Uttar Pradesh , Noida
Location of the Principal
Office
Sector- 125, Gautam Buddha Nagar, Noida - 201 313 (India)
Telephone: 0120-4392359
Fax: 0120-2431870
Email: nkaushik5@amity.edu
Website: www.amity.edu
Date of Establishment 24 March, 2005
Copy of Gazzette Notification No. 404/VII-V-1-1(Ka)-1/2005 Dated
Lucknow,March 24,2005.
PAN Card No. : AAATR7314Q
GST No. : 09AAATR7314Q1ZW
Professional strength
No. of full time manpower available: 4200 plus
(a) Agriculture & Allied: 80
(b) Other Sector: 4100 plus
Financial capacity of Amity University
2017-18: 953.72 Crores
2016-17: INR 844.75 Crores.
2015-16 : INR 717.37 Crores.
4 | P a g e
Institutes and Centres at AAUP:
Various institutes and centers at Amity University which are performing academic and research activities in
food, agriculture and allied sciences. Some of them are listed below:
1. Amity Institute of Organic Agriculture
2. Amity Institute of Horticulture Studies & Research
3. Amity International Centre for Post Harvest Technology & Cold Chain Management
4. Centre for Agricultural Biotechnology
5. Amity Centre for Extension Services
6. Amity Centre for Bio Control & Plant Disease Management
7. Amity Institute for Herbal Research and Studies
8. Amity Institute of Phytochemistry & Phytomedicine
9. Amity Institute of Food Security Management
10. Amity Institute of Food Technology
11. Amity Institute of Biotechnology
12. Amity Institute of Microbial Biotechnology
13. Amity Institute of Microbial Technology
14. Amity Institute of Seabuckthorn Research
15. Amity Centre for Carbohydrate Research
16. Centre for Plant Cell Culture Technology
17. Amity Institute of Marine Science & Technology
18. Amity Institute of Environmental Toxicology, Safety and Management
19. Amity Institute of Environmental Sciences
20. Amity School of Natural Resources and Sustainable Development
21. Amity Institute of Geo-Informatics and Remote-Sensing
22. Amity Institute of Global Warming and Ecological Studies
23. Amity Institute of Water Technology and Educating Youth for Sustainable Development
Details of Project Coordinator
Name: DR.NUTAN KAUSHIK
Designation: Director General, Amity Food and Agriculture Foundation
Amity University Uttar Pradesh was established under RBEF vide The Amity University
Uttar Pradesh Act, 2005 (U.P. Act No.11 of 2005) in the State of Uttar Pradesh through state
legislature. The University has a rich resource of expertise in the field of social sciences,
economics, political science, agriculture, microbiology, biotechnology, anthropology, natural
resources, Organic Agriculture, Plan Protection, environment, education, psychology, Finance
5 | P a g e
Experts, Management Experts, Legal Experts, travel, Tourism and Hospitality experts etc. Amity
also has in-house training department which on the continuous basis is running trainings and
workshops from various government banks, other institutions, and other Central as well as State
Government Departments.
Description of Institutes
There are a number of institutes at AUUP but for the said project we have chosen a few.
1. Amity Institute of Organic Agriculture:
Amity Institute of Organic Agriculture (AIOA) is an unique Institute, the first of its kind in the
country and among the few in the world. Amity University known for academic excellence,
quality research, international linkages and strong industry interface. Visualizing the need for
sustainable food security and food safety management systems, the Institute consistently has set
standards for excellence towards human resource development in long-term sustainable
agricultural technologies manifested in the most viable option of Organic Agriculture in contrast
with the chemical-intensive conventional agriculture integrated and strongly supported with a
comprehensive and multifaceted management focused education. The Institute has also a
mandate in carrying out basic and applied research in organic production management systems,
an innovative farmer’s knowledge management apart from training, advisory, and consultancy
services. Institution is working on continuous development of the society and has also
implemented various projects.
2. Amity Institute of Geo-Informatics and Remote Sensin, Noida
Amity Institute of Geo-Informatics and Remote Sensing (AIGIRS) is an interdisciplinary center,
established as a part of Amity University Uttar Pradesh, NOIDA.
These Programmes in Geoinformatics combines technical, mathematical, computational and visual
knowledge and offers the students the possibility to not only use geoinformatics technology but also
develop and create new computational methods and applications. In addition to gaining an overall
perspective, students can further focus their skills on one of the subjects within geoinformatics, such as
geodesy, photogrammetry, laser scanning, remote sensing, geographic information technologies or
cartography. The programs have a long tradition as a technically and mathematically oriented curriculum.
This is why, for example, programming skills, basic courses in mathematics and statistics as well as an
interest in GeoIT are required. The programme provides both theoretical and practical skills, and develops
academic capabilities, problem-solving skills and analytical thinking, just to name a few. Teaching is
tightly connected to ongoing cutting-edge research.
The Institute conducts interdisciplinary research in the following areas of Remote Sensing & GIS
Applications:
 Groundwater Resource Management
 Groundwater Modeling
6 | P a g e
 Watershed management and Modeling
 Geophysics based Groundwater Survey
 Groundwater Pollution and Prediction Modeling
 GIS based decision support System for Solid Waste Management
 River dynamics and Mapping
 Web GIS based application in Resource Mapping
 Geological / Mineralogical Studies
 Urban Planning and Management
 Glaciology
 Landscape Evaluation
 Flood Mapping and Monitoring
 Drought Mapping and Monitoring
 Climate Change Studies
3. Amity Institute of Information technology (AIIT), Noida
Amity Institute of Information technology (AIIT), Noida, integral part of Amity University Uttar
Pradesh, is a centre of excellence for quality education in Information Technology with special
focus on emerging trends. AIIT is a CISCO Regional Networking Academy since March 2001,
now known as CISCO Instruction Training Center (ITC) and Network Academy. AIIT is
providing this course as a Value Addition Course to external students as well as the students of
MCA, M.Sc.(NT&M), Ph.D(IT), BCA, B.Sc. (IT), BCA+MCA (dual) and BCA (Evening). AIIT
also has a tie-up with CISCO and Intersystems Pvt. Ltd. and it is the first Institute in India to
offer InterSystems CacheCampus Program to foster knowledge about Cache among the student
community.
Amity University has collaboration with EMC2, Sun MicroSystems, Oracle , SAP, Infosys, etc.
Being a part of the University, the students of AIIT have the opportunity to avail access to the
courses offered by these organizations.
iii. List of Technical persons with their qualification.
Seri
al
No.
Name Qualification Expertise Experience
1. Dr. Nutan Kaushik, Ph.D. Agriculture 28 years
2. Dr. Neelani Ramawat Ph.D. Agronomy 18 years
3. Dr. Renu Yadav Ph.D. Botany 12 years
4. Dr. Prafull Singh Ph.D. Remote Sensing 10 years
5. Dr. Neel Mani Ph.D. Machine Learning 12 years
6. Dr. Mahesh M. Kadam Ph.D. Agril. Economics 6 years
7. Dr. Rachna Rana Ph.D. Agronomy 02 years
8. Dr. Saurabh Agarwal M.Tech, Ph.D. Machine Learning 12 years
9. Dr. Vandana Bhatia M.Tech, Ph.D. Machine Learning 02 years
10. Dr. Deepak Sharma M.Tech,Ph.D. Machine Learning 10 years
7 | P a g e
iv. Details of the previous study carried out:
Name of the Study Efficient Pattern Mining of Big Data using Graphs
(Dr. Vandana Bhatia)
Geographical location Not Applicable
Description
Big data has great amount of hidden knowledge and many insights which have
raised remarkable challenges in knowledge discovery and data mining. For
certain types of data, the relationships among the entities is of much more
importance than the information itself. Big data has many such connections
which can be mined efficiently using graphs. However, it is very challenging to
obtain ample profits from this complex data.
To overcome these challenges, graph mining approaches such as clustering and
subgraph mining are used. In recent times, these approaches have become an
indispensable tool for analyzing graphs in various domains.
The research work undertaken in the field of pattern mining approaches for
large graphs. The main objective of this research is to investigate the benefits of
using scalable approaches for mining large graphs.
Two fuzzy clustering algorithms namely “PGFC” and “PFCA” are proposed for
large graphs using different concepts of graph analysis. Furthermore, a scalable
deep learning based fuzzy clustering model named “DFuzzy” is proposed that
leverages the idea from stacked autoencoder pipelines to identify overlapping
and non-overlapping clusters in large graphs efficiently. Our proposed
clustering approaches are proved to be effective for small and large graph
dataset, and generate high quality clusters.
For mining frequent subgraphs, a scalable frequent subgraph mining algorithm
named “PaGro” is proposed for a single large graph using pattern-growth based
approach. In PaGro, a two-step hybrid approach is developed for optimization of
subgraph isomorphism and subgraph pruning task at both local and global levels
to avoid the excess communication overhead. Additionally, an approximate
frequent subgraph mining algorithm named “Ap-FSM” is proposed which
exploits PaGro using sampling for faster processing. The results of PaGro and
Ap-FSM show that both outperform the competent algorithms in various aspects
of processing Time, no. of iterations and memory overhead.
It is suggested that the utilization of graph clustering and frequent subgraph
mining generate discriminate and significant patterns, which can help in many
tasks such as classification and indexing of big data. The proposed algorithms
can be used in many applications like Social networks, Biological networks, etc.
The work can also be used for finding similar patterns in business and
agriculture.
8 | P a g e
Name of the Study
(Dr. Praful Singh)
Application of Thermal Imaging and Hyperspectral Remote Sensing for
Crop Water Deficit Stress Monitoring
Geographical location Not applicable
Description
Water deficit in crops induces a stress that may ultimately result in low
production. Identification of response of genotypes towards water deficit stress
is very crucial for plant phenotyping. The study was carried out with the
objective to identify the response of different rice genotypes to water deficit
stress. Ten rice genotypes were grown each under water deficit stress and well
watered or non-stress conditions. Thermal images coupled with visible images
were recorded to quantify the stress and response of genotypes towards stress,
and relative water content (RWC) synchronized with image acquisition was also
measured in the lab for rice leaves. Synced with thermal imaging, Canopy
reflectance spectra from same genotype fields were also recorded. For
quantification of water deficit stress, Crop Water Stress Index (CWSI) was
computed and its mode values were extracted from processed thermal imageries.
It was ascertained from observations that APO and Pusa Sugandha-5 genotypes
exhibited the highest resistance to the water deficit stress or drought whereas
CR-143, MTU-1010 and Pusa Basmati-1 genotypes ascertained the highest
sensitiveness to the drought. The study reveals that there is an effectual
relationship (R² = 0.63) between RWC and CWSI. The relationship between
canopy reflectance spectra and CWSI was also established through partial least
square regression technique. A very efficient relationship (Calibration R²= 0.94
and Cross-Validation R²= 0.71) was ascertained and 10 most optimal wavebands
related to water deficit stress were evoked from hyperspectral data resampled at
5nm wavelength gap. The identified ten most optimum wavebands can
contribute in the quick detection of water deficit stress in crops. This study
positively contributes towards the identification of drought tolerant and drought
resistant genotypes of rice and may provide valuable input for the development
of drought-tolerant rice genotypes in future.
.
9 | P a g e
Comparison of Various Modelling Approaches for Water Deficit Stress
Monitoring in Rice Crop through Hyperspectral Remote Sensing.
Agriculture Water Management
This study was conducted to understand the behaviour of ten rice genotypes for
different water deficit stress levels. The spectroscopic hyperspectral reflectance
data in the range of 350–2500 nm was recorded and relative water content
(RWC) of plants was measured at different stress levels. The optimal wavebands
were identified through spectral indices, multivariate techniques and neural
network technique, and prediction models were developed. The new water
sensitive spectral indices were developed and existing water band spectral
indices were also evaluated with respect to RWC. These indices based models
were efficient in predicting RWC with R2 values ranging from 0.73 to 0.94. The
contour plotting using the ratio spectral indices (RSI) and normalized difference
spectral indices (NDSI) was done in all possible combinations within 350–2500
nm and their correlations with RWC were quantified to identify the best index.
Spectral reflectance data was also used to develop partial least squares
regression (PLSR) followed by multiple linear regression (MLR) and Artificial
Neural Networks (ANN), support vector machine regression (SVR) and random
forest (RF) models to calculate plant RWC. Among these multivariate models,
PLSR-MLR was found to be the best model for prediction of RWC with R2 as
0.98 and 0.97 for calibration and validation respectively and Root mean square
error of prediction (RMSEP) as 5.06. The results indicate that PLSR is a robust
technique for identification of water deficit stress in the crop. Although the
PLSR is robust technique, if PLSR extracted optimum wavebands are fed into
MLR, the results are found to be improved significantly. The ANN model was
developed with all spectral reflectance bands. The 43 developed model didn’t
produce satisfactory results. Therefore, the model was developed 44 with PLSR
selected optimum wavebands as independent x variables and PLSR-ANN model
45 was found better than the ANN model alone. The study successfully conducts
a comparative 46 analysis among various modelling approaches to quantify
water deficit stress. The methodology developed would help to identify water
deficit stress more accurately by predicting RWC in the crops.
10 | P a g e
Name of study
Morphometric analysis of Morar River Basin, Madhya Pradesh, India,
using remote sensing and GIS techniques
Hydrogeological mapping and drainage analysis can form an important tool for
groundwater development. Assessment of drainage and their relative parameters
have been quantitatively carried out for the Morar River Basin, which has made
positive scientific contribution for the local people of area for the sustainable
water resource development and management. Geographical Information
System has been used for the calculation and delineation of the morphometric
characteristics of the basin. The dendritic type drainage network of the basin
exhibits the homogeneity in texture and lack of structural control. The stream
order ranges from first to sixth order. The drainage density in the area has been
found to be low which indicates that the area possesses highly permeable soils
and low relief. The bifurcation ratio varies from 2.00 to 5.50 and the elongation
ratio (0.327) reveals that the basin belongs to the elongated shaped basin
category. The results of this analysis would be useful in determining the effect
of catchment characteristics such as size, shape, slope of the catchment and
distribution of stream net work within the catchment.
Name of study
Monitoring spatial LULC changes and its growth prediction based on
statistical models and earth observation datasets of Gautam Budh Nagar,
Uttar Pradesh, India
Description
It is well known and witnessed the fact that in recent years the growth of
urbanization and increasing urban population in the cities, particularly in
developing countries, are the primary concern for urban planners and other
environmental professionals. The present study deals with multi-temporal
satellite data along with statistical models to map and monitor the LULC change
patterns and prediction of urban expansion in the upcoming years for one of the
important cities of Ganga alluvial Plain. With the help of our study, we also
11 | P a g e
tried to portray the impact of urban sprawl on the natural environment. The
long-term LULC and urban spatial change modelling was carried out using
Landsat satellite data from 2001 to 2016. The assessment of the outcome
showed that increase in urban built-up areas favoured a substantial decline in the
agricultural land and rural built-up areas, from 2001 to 2016. Shannon’s entropy
index was also used to measure the spatial growth patterns over the period of
time in the study area based on the land-use change statistics. Prediction of the
future land-use growth of the study area for 2019, 2022 and 2031 was carried
out using artificial neural network method through Quantum GIS software.
Results of the simulation model revealed that 14.7% of urban built-up areas will
increase by 2019, 15.7% by 2022 and 18.68% by 2031. The observation
received from the present study based on the long-term classification of satellite
data, statistical methods and field survey indicates that the predicted LULC map
of the area will be precious information for policy and decision-makers for
sustainable urban development and natural resource management in the area for
food and water security.
Name of the Study
(Dr. Renu Yadav)
Physiological and Biochemical studies on the essentiality and toxicity of Nickle
and cobalt on certain plant species
Geographical location Udaipur , Rajasthan
Description
This thesis work entitled Title:” Physiological and Biochemical studies on the
essentiality and toxicity of Nickle and cobalt on certain plant species” was
carried at Udaipur district of Rajasthan. Experiments was conducted to evaluate
response of Triticum aestivum L and Vigna sinensis L to the basal applications
of nickel and cobalt. Significant increase in the growth was observed at 5 & 25
µg g-1 nickel and cobalt doses. Addition of metals above this level reduced the
leaf area, plant growth, root length and yield of the plants. Fruiting stage showed
more severe toxicity symptoms in comparison to the vegetative stages.
Chlorophyll contents, protein contents and the nitrate reductase activity
increased significantly at the lower nickel doses. Peroxidase and superoxide -
dismutase activity increased in a concomitant manner by increasing the nickel
concentrations. Accumulations of nickel and cobalt in different parts of the
plants were studied. Increased concentrations of the soil applied nickel and
cobalt demonstrated an increase in the content of metals in roots as well as
shoots. The information obtained from this study should be useful for studying
the essentiality and toxicity of Nickle and cobalt on certain plant species.
12 | P a g e
Name of the study
(Dr. Mahesh M. Kadam)
Comparative Analysis of Public and Private Warehousing in Vidarbha
region of Maharashtra
It reveals from the study that the investment in land and building was a major
share of total investments in both Maharashtra State Warehousing Corporation
and Private Warehouses. The policies could be diverted towards investment on
mechanizing the warehouses, whereby cost of maintenance could be reduced to
a larger extent. The average occupancy of warehouses was found to be less than
40 per cent by different categories of users. The occupancy rate can be increased
by providing the customers with good facilities and less procedural system in
warehousing operation. The profile of commodities also could be diversified by
providing special structures for storage for different type of commodities as
demanded by the customers. The composition of user groups shows that the
government sector occupying a larger section of the capacity utilization
compared to other user groups. The operations of Maharashtra State
Warehousing Corporation could be made more competitive through various
measures and policies to attract diverse composition of user groups. It reveals
from the study that generally the farmers do not get adequate space especially
during the peak seasons, which may deny the farmers from utilizing the
advantages of temporal price variations in agricultural commodities. The
policies of the Maharashtra State Warehousing Corporation may focus to
provide adequate space to farmers during the peak months of harvest by keeping
a kind of reserved occupancy for the benefit of farmers at large.The development
of optimum sized structures to suit the location looking to the season and crops
grown. The warehouses may be managed to have a year round occupancy, thus
achieving efficiency and reduction in the operational costs.
13 | P a g e
Name of the Study
(Dr.Naleeni Ramawat)
Simulation, validation and application of CERES-Maize model for yield
maximization of maize in North Western Himalayas
Geographical location Palampur, Himachal Pradesh
Description
Maize (Zea mays L.) is one of the most important cereal crops of the
world. Investigations were carried out for determination of genotypic
coefficients of important varieties of maize by using CERES-Maize model in
the Decision Support System for Agrotechnology Transfer (DSSAT v 3.5). The
CERES-Maize model was evaluated with experimental data collected during
two field experiments conducted in Palampur, India. Field experiments
comprising of four dates of sowing (June 1, June 10, June 20 and June 30)
and four varieties(KH 9451, KH 5991, early composite and local) of maize
were conducted during Summer 2003 and 2004 in split plot design.
Observations on development stages, dry matter accumulation at 15 days
interval, yield attributes, yield (grains, stover and biological), nitrogen content
and uptake were recorded. Genotypic coefficients of important varieties of
maize were worked out. CERES-Maize model successfully simulated
phenological stages, yield attributes (except single grain weight), yield and also N
uptake with coefficient of variation (CV) nearly equal to 10 %. CERES-Maize
model was validated with fair degree of accuracy. Simulation guided management
practices were worked out under potential production and resource limiting
situations. Best time of sowing of both hybrids (KH 9451, KH 5991) was worked
out to be last week of April. While for early composite (EC), first week of May
proved advantageous and for local variety second fortnight of April was the
best time of sowing. The best schedule of N application was 60 kg ha-1 at sowing
time and 30 kg ha-1 at knee high stage for all varieties except for local where it was
60 kg ha-1 at sowing and 30 kg ha-1 each at knee high and silking stages.
14 | P a g e
Name of Study
Name of study
Methods of LeafArea for Stevia rebaudiana (Bert.) Bertoni
Leaf area is a valuable index for evaluating growth and development of sweet herb
Stevia [Stevia rebaudiana (Bert.) Bertoni]. A simple methodology was developed
during 2006 to estimate the leaf area through Leaf Area Distribution Pattern
(LADP) and regression equations. Plant height, leaf height as well as the length and
breadth of all the measurable leaves were measured and their area was measured
through Area meter (AM 300) for a six month old crop of Stevia. A leaf area
coefficient of 0.548 was found to fit for the linear equation without intercept.
LADP was prepared with relative leaf height and relative leaf area. Based on the
adjusted second order polynomial equation of LADP, the relative leaf height of
plants representing the mean leaf area was ascertained and a regression equation
was obtained to calculate the total leaf area of the plant. The results were validated
with 3, 4 and 5 months old crops as well as with another accession. Different
combinations of prediction equations were obtained from length and breadth of all
leaves and a simplest equation i.e, linear equation was used to predict the leaf area.
A non-destructive methodology for estimating leaf area of Stevia based on linear
measurement was developed in this study.
SIMULATION AND VALIDATION OF CERES-MAIZE AND CERES-
BARLEY MODELS
Investigations were carried out for determination of genotypic co-efficients of
important varieties of maize and barley, simulation and validation of CERES-Maize
and CERES- Barley crop models for growth, yield and yield attributes, and working
out simulation-guided management practices for yield maximization of both the
crops. Field experiments comprising of four dates of sowing (June 1, June 10, June
20 and June 30) and four varieties (KH 9451, KH 5991, early composite and local)
of maize and four dates of sowing (October 10, November 1, November 20 and
December 10) and three varieties (Dolma, Sonu and HBL-113) of barley were
conducted during Kharif 2002 to Rabi 2004-05 in split plot design. Observations on
development stages, dry matter accumulation (leaves, stem and grains) at 15 days
interval, yield attributes, yield (grains, stover/straw and biological), nitrogen
content and uptake were recorded. Genotypic coefficients of important
recommended varieties of maize and barley were worked out. CERES-Maize model
successfully simulated phenological stages, yield attributes (except test weight),
yield and also N uptake, but failed to simulate accurately dry matter accumulation
in different plant parts at different growth periods. CERES-Barley model also
successfully simulated phenological stages, yield attributes and grain yield, but
failed to simulate straw yield, dry matter accumulation in different plant parts at
different growth periods and N content and uptake. Both the models were validated
with fair degree of accuracy. Simulation guided management practices were
worked out under potential production and resource limiting situations. In case of
maize, best time of sowing of both hybrids(KH 9451, KH 5991) was worked out to
be last week of April. While for early composite, first week of May proved
advantageous and for local second fortnight of April. The best schedule of N
application was 60 kg /ha at sowing time and 30 kg/ha at knee high stage for all
varieties except for local where it was 60 kg /ha at sowing and 30kg/ha at knee high
stage and 30 kg/ha at silking. In case of barley, best time of sowing for Dolma and
15 | P a g e
Sonu was last week of October to first week of November but for HBL-113 earlier
sowing from 20th to 27th October were best. Best N schedule was 60 kg/ha at
sowing time followed by 20 kg/ha top dressing at 30 DAS for Dolma and Sonu and
50 kg/ ha at sowing time and 50kg/ha as top dressing at 30DAS for HBL-113.
Study Area
(Dr. Rachna Rana)
Effect of integrated nutrient management on productivity, profitability and
seed quality in okra-pea cropping system
The experiment was carried out at the Experimental Farm of Department of Seed
Science and Technology, Chaudhary Sarwan Kumar Himachal Pradesh Krishi
Vishvavidyalaya, Palampur during kharif, 2012 to rabi, 2013-14 to study the effect
of integrated nutrient management on productivity, profitability and seed quality in
okra-pea cropping system. Experiment consisted of seven integrated nitrogen
treatments in okra viz; 25% nitrogen through FYM + 75% nitrogen through
fertilizer; 25% nitrogen through fortified vermicompost + 75% nitrogen through
fertilizer; 25% nitrogen through vermicompost + 75% nitrogen through fertilizer;
50% nitrogen through FYM + 50% nitrogen through fertilizer; 50% nitrogen
through fortified vermicompost + 50% nitrogen through fertilizer; 50% nitrogen
through vermicompost + 50% nitrogen through fertilizer and recommended dose of
fertilizer. These seven treatments were tested in randomized block design with 3
replications in okra crop during kharif and three treatments viz; 50% RDF, 75%
RDF and 100% RDF constituting 21 treatment combinations, following pea crop in
rabi were evaluated in split plot design with 3 replications. Growth, yield attributes,
seed yields of okra and pea increased significantly and consistently with combined
application of 50% nitrogen through fortified vermicompost + 50% nitrogen
through fertilizer as main effects in okra and residual effects in peas. Significantly,
higher seed yield of okra (694.4 kg ha-1 and 745.4 kg ha-1) was obtained with the
application of 50% nitrogen through fortified vermicompost + 50% nitrogen
through fertilizer during both the years (2012 and 2013), respectively. Residual
effect of 50% nitrogen applied through fortified vermicompost + 50% nitrogen
through fertilizer applied in okra also resulted in significantly higher seed yield of
peas (1550 kg ha-1 and 1584 kg ha-1) during both the years of experimentation. N,
P, K uptake and available N, P, K was found significantly higher with the
application of 50% N through fortified vermicompost + 50% N through fertilizer in
both okra and pea crops. Further it was observed that application of 50% nitrogen
through fortified vermicompost + 50% nitrogen through fertilizer resulted in
significantly higher germination percentage, seedling length, seedling dry weight,
field emergence, seedling vigour and lowest electrical conductivity in okra and pea
seeds after harvest indicating better seed quality. Among direct effects (fertility
levels), 100% RDF also resulted in increased growth, development, yield attributes,
seed yield and quality of peas. The okra equivalent yield (1112 kg ha-1 annum-1),
net returns (₹ 263853 ha-1 annum-1) and net returns per rupee invested (₹ 3.79)
were recorded significantly higher with the application of 50% N through fortified
vermicompost + 50% N through fertilizers in okra-pea cropping system.
16 | P a g e
Name of the Study
Designing Algorithms for Trends Analysis in Research
Geographical location
Netaji Subhas Institute of Technology, University of Delhi, Sector-3,
Dwarka, New Delhi-110078
Description
My research is mainly focussed on identifying Trends in Research. We
have identified and analyse trends in Machine Learning Research.
The name of Machine Learning firstly devised by Arthur Samuel, who
was acknowledged for the checkers-playing program to improve game
by game and studying which moves makeup winning strategies and
incorporating those moves into the program. It is a subset of artificial
intelligence area, and its methodology has unconventional in
17 | P a g e
performance with the primary concerns of the field. The machine
learning field has reincarnated many times in past and is known for its
existence for many decades. For decades, there have always been
challenges to researchers in artificial intelligence to build machines that
can mimic the human intellect. The machine learning algorithms have
motivated the researchers to empower a computer to autonomously drive
cars, write and publish sport match reports, communicate with human
beings and find the suspected terrorist. These algorithms are used
unconventionally to obtain knowledge from the data. In machine
learning, the computers don’t require to be explicitly programmed, but
they can improve and change their algorithms by themselves. The
machine learning systems automatically learn the program from data,
which is a challenging task to make them manually. In the last couple of
decades, the use of machine learning has spread rapidly in various
disciplines. Therefore, the algorithms in machine learning field are also
known as algorithm about algorithms. In particular, the popularity of
machine learning motivates us to understand the research trends in this
field since the existing machine learning techniques have been applied to
large-scale data processing environments or have extended to various
application areas such as fraud detection, the stock market, weather
forecasting, etc. Also, the algorithms changed according to newly
emerged technology. So understanding the machine learning research
themes of the past five decades will help to study the current machine
learning trends and applies it to practical applications. We have prepared
a dataset of machine learning research articles from 1968~2017.
In our thesis, we adopted various methodologies to analyze trend in
machine learning research which are given below:
 Trend Analysis in Machine Learning Research Using Text
Mining.
 A Trend Analysis of Machine Learning Research with Topic
Models and Mann-Kendall Test.
 Trend Analysis of Machine Learning Research Using Topic
Network Analysis.
 A Trend Analysis of Significant Topics over Time in Machine
Learning Research.
 Identify and Recommending Researchers in Machine Learning
Based on Author-Topic Model.
 Uncovering Research Trends and Topics of Communities in
Machine Learning.
List of Publications:
1. Sharma, Deepak, Kumar, Bijendra, & Chand, Satish (2018). A
Trend Analysis of Machine Learning Research with Topic
18 | P a g e
Models and Mann-Kendall Test. International Journal of
Intelligent Systems and Applications(IJISA), Vol.11, No.2,
pp.70-82, 2019. DOI: 10.5815/ijisa.2019.02.08
2. Kumar, Rajneesh, & Sharma, Deepak. A Survey on Sentiment
Analysis of Speech. Journal on Multimodal User Interfaces.
(May 2019)(Submitted)
3. Kumar, Manoj, Sharma, Deepak, Agarwal, Jyoti, Rani, Anuj, &
Singh, Gurpreet. A DE-ANN Inspired Skin Cancer Detection
Approach using Fuzzy C-Means Clustering. Journal of Digital
Imaging. (May 2019)(Submitted)
4. Sharma, Deepak, Kumar, Bijendra, Chand, Satish, & Shah,
Rajiv Ratn (2018). Research Topics over Time: A Trend
Analysis using Topic Coherence Model with LDA. ACM
Transactions on Data Science. (Nov 2018)(Submitted)
5. Sharma, Deepak, Kumar, Bijendra, Chand, Satish, & Shah,
Rajiv Ratn (2018). Uncovering Research Trends and Topics of
Communities in Machine Learning. ACM Transactions on
Knowledge Discovery from Data. (Oct 2018) (Submitted)
6. Sharma, Deepak, Kumar, Bijendra, & Chand, Satish (2017). A
Survey on Journey of Topic Modelling Techniques from SVD to
Deep Learning. International Journal of Modern Education and
Computer Science(IJMECS), Vol.9, No.7, pp.50-62, 2017. DOI:
10.5815/ijmecs.2017.07.06
7. Sharma, Deepak, Kumar, Bijendra, & Chand, Satish (2018).
Trend Analysis in Machine Learning Research Using Text
Mining. International Conference on Advances in Computing
Communication Control and Networking (ICACCCN-2018) on
12th−13th October 2018.
8. Sharma, Deepak, Kumar, Bijendra, & Chand, Satish (2018).
Trend Analysis of Machine Learning Research Using Topic
Network Analysis. In: Panda B., Sharma S., Roy N. (eds) Data
Science and Analytics. REDSET 2017. Communications in
Computer and Information Science, vol 799. Springer,
Singapore.
9. Singh, Yash Veer, Kumar, Bijendra, & Chand, Satish, Sharma,
Deepak (2018). A Hybrid Approach for Requirements
Prioritization Using Logarithmic Fuzzy Trapezoidal Approach
(LFTA) and Artificial Neural Network (ANN). In International
Conference on Futuristic Trends in Network and
Communication Technologies (pp. 350-364). Springer,
Singapore.
10. Sharma, Deepak, Kumar, Bijendra, & Chand, Satish (2017).
Identify and Recommending Researchers in Machine Learning
Based on Author-Topic Model. International Conference on
Pattern Recognition (ICPR-2017) on 22nd − 23rd December
2017.
19 | P a g e
Name of the Study
Design & Analysis of Image Forensic Techniques
Geographical location NSIT, University of Delhi, Delhi
Description
My research is mainly focussed on forensic analysis of digital images. Digital
images directly or indirectly affect every aspect of human life like medical,
traffic management, agriculture, journalism, etc. So credibility of digital content
should be assured. There are many operations that can be performed on the
images. Out of which some are for good purpose and some are for wrong
purpose. Generally, image enhancement operations like contrast enhancement,
histogram equalization, etc. are performed to enhance the image visual quality.
These operations are harmless. However, investigation of these operations
20 | P a g e
helpful in image forensic analysis. Fake images are created with wrong
intentions using one or more pristine images. The editing softwares are so
precise that tampering cannot be detected easily. There have been discussed
many methods for image forgery detection. They have their own limitations as
most method relies on: hardware (camera) dependent image parameters, images
lighting conditions, and image compression, etc. The image forgery detection
techniques can be divided to the following two categories: active and passive
(blind). In active forgery detection techniques authentication is achieved via
analysis of some predefined content- like digital watermark or signature. In case
of passive forgery detection, no prior knowledge about the images is made
available for authentication. Image forgery can be detected using camera
artifacts, compression artifacts, lighting/illumination disturbance, internal
statistical properties, etc. Most of these methods directly or indirectly based on
internal statistical features of the image and can classify pristine and fake
images. This classification broadly comes in to the category of machine
learning. I have also applied techniques for image segmentation.
Publications in International Journals:
1. Saurabh Agarwal and Satish Chand, “A Content-Adaptive Median
Filtering Detection Using Markov Transition Probability Matrix of
Pixel Intensity Residuals,” Journal of Applied Security Research,
Taylor & Francis (Accepted)
2. Saurabh Agarwal and Satish Chand, “Blind Forensics of Images Using
Higher OrderLocal Binary Pattern,” Journal of Applied Security
Research, Taylor & Francis, vol.
13(2), January 2018, pp. 209-222
3. Saurabh Agarwal, Satish Chand and S. Nikolay, “SPAM Revisited for
Median Filtering Detection Using Higher-Order Difference,” Security
and communication networks, Wiley publications, vol. 9(17),
November, 2016, pp. 4089-4102
4. Saurabh Agarwal and Satish Chand, “Anti-forensics of JPEG images
using interpolation,” International journal of image, graphics and
signal processing, vol. 7(12), November, 2015, pp. 10-17.
5. Saurabh Agarwal and Satish Chand, “Image forgery detection using
multi scale entropy filter and local phase quantization,” International
journal of image, graphics and signal processing, vol. 7(10),
September 2015, pp. 78-85.
Publications in International Conferences:
1. Saurabh Agarwal and Satish Chand, “Median filtering detection using
Markov Process in
Digital Images,” International conference on Biomedical Engineering
Science & Technology, NIT, Raipur, 20-21 December, 2019
(Accepted)
21 | P a g e
2. Saurabh Agarwal and Satish Chand, “Image Forgery Detection Using
Co-occurrence Based Texture Operator in Frequency Domain,” 4th
ICACNI, Advances in Intelligent
Systems and Computing series Springer, 22-24 September, 2016
3. Saurabh Agarwal and Satish Chand, “Image Forgery Detection Using
Markov Features in Undecimated Wavelet Transform,” Ninth
International Conference on Contemporary Computing, JP, Noida, 11-
13 August, 2016, pp. 178-183.
4. Saurabh Agarwal and Satish Chand, “Image Tampering Detection
using Local Phase
based Operator,” International Conference on Emerging Trends in
Electrical, Electronics
& Sustainable Energy Systems, KNIT, Sultanpur, 11-12 March, 2016,
pp. 355-360.
5. Saurabh Agarwal and Satish Chand, “Texture operator based image
splicing detection
hybrid technique,” International Conference on Computational
Intelligence & Communication Technology (CICT), ABES, Ghaziabad,
12-13 February, 2016, pp. 116-120.
6. Saurabh Agarwal and Satish Chand, “Image Forgery Detection using
Texture Descriptors,” International Conference on Modern
Mathematical Methods and High
Performance Computing in Science and Technology, RKGIT,
Ghaziabad, 27-29 December, 2015, pp. 44.
22 | P a g e
v. Study Area intended to be taken up.
States District Gram Panchayat Crops
Uttar Pradesh Bulendshaer, Meerut 10 Wheat, Rice
Maharashtra Nagpur 10 Cotton
Madhya Pradesh Bhopal, Indore 10 Soybean, Chickpea
vi. Crops to be taken
1. Wheat,
2. Rice
3. Cotton
4. Soybean
5. Chickpea
vii. Methodology/Technology to be used:
Methodology regarding Remote Sensing approach
Many models are available for crop health and acreage estimation from the satellite data by
developing various indices from processing of multi set satellite images such as leaf area index
(LAI), Normalized Difference Vegetation Index (NDVI), Enhanced Vegetation Index (ENDVI)
and many other models. The methodology applied in most of the models is based on indices
based and crop type. The overall methodology will be selection of appropriate set of multi-
temporal satellite images and image processing techniques to extract the information from the
23 | P a g e
data and their quality assessment. The overall steps shall be followed in the entire process for
crop yield estimation and monitoring has given in the flow chart.
Standard methodology shall be followed for Crop Yield Estimation and monitoring.
Methodology regarding Machine Learning approach
24 | P a g e
Satellite data &
Field based
digital
photograph
Field Data
Labeled
Data
Crop growth
Characteristics
Machine Learning Algorithms
Data
Cleaning
Feature
Engineering
and Feature
Selction
Model
Selection
and
Training
Prediction
and
Evalauation
Satellite data &
Field based
digital
photograph
Field Data
Labeled
Data
Crop growth
Characteristics
Machine Learning Algorithms
Data
Cleaning
Feature
Engineering
and Feature
Selction
Model
Selection
and
Training
Prediction
and
Evalauation
The steps which will be carried out in order to fulfill Machine Learning Algorithms are as
follows
1. Data Cleaning
Provided the satellite imagery and received crop growth characteristics, data cleaning will be
performed by removing duplicates, filling missing values. Data normalization and type
conversion will also be used.
2. Feature Engineering and Feature Selection
In machine learning, the process of selecting a subset of relevant features (variables, predictors)
for use in model construction. It enables the machine learning algorithm to train faster, reduces
25 | P a g e
the complexity and makes it easier to interpret. The appropriate features of the provided data will
be selected. The features can be among following:
 Crop type
 Timestamp
 Temperature
 Rainfall amount
 Crop production Amount
 Geographic Area
 Soil Type
3. Model selection and Training
The literature review shows that the most popular models in agriculture are Artificial and Deep
Neural Networks (ANNs and DL) and Support Vector Machines (SVMs).
ANNs are inspired by the human brain functionality and represent a simplified model of the
structure of the biological neural network emulating complex functions such as pattern
generation, cognition, learning, and decision making. Such models are typically used for
regression and classification tasks which prove their usefulness in crop management and
detection of weeds, diseases, or specific characteristics. The recent development of ANNs into
deep learning that has expanded the scope of ANN application in all domains, including
agriculture. ANN and Deep Learning can be implemented by using Tenserflow, H2o, etc.
SVMs are binary classifiers that construct a linear separating hyperplane to classify data
instances. SVMs are used for classification, regression, and clustering. In farming, they are used
to predict yield and quality of crops as well as livestock production. Scalable models will be
designed by using advanced technologies and environments.
4. Prediction and Evaluation
After getting output from the machine learning models, final prediction will be performed. Here,
the value of machine learning is realized. The valuable patterns are analyzed and final results
based on the analysis will be provided. It may include the best time of harvesting crops, yield
prediction and crop quality.
26 | P a g e
Field Survey and Validation Use
The study will comprise of three states, namely, U.P., Maharashtra and M.P. respectively. The
study will lead with selection of 5 districts from above states by random sampling method.
Further from each district, 10 Gram panchayats will be selected on the basis of crop area,
production and productivity. The crops selected for study purpose are Wheat, Rice, Cotton,
Pigeon pea and chick pea.
States District Gram Panchayat Crops
Uttar Pradesh Bulendshaer, Meerut 10 Wheat, Rice
Maharashtra Nagpur 10 Cotton
Madhya Pradesh Bhopal, Indore 10 Soybean, Chickpea
The following parameters for crop data collection are discussed below
Crop Growth Parameters Yield Parameters
Wheat a. Plant height (cm)
b. Dry matter
accumulation (g/m2
)
c. Chlorophyll content
d. Leaf area index
a. Effective tillers/m2
b. Spike length
c. Grains/spike
d. 1000 grain weight
e. Grain yield
f. Straw yield
g. Harvest index
Rice a. Plant height (cm)
b. Dry matter
accumulation
(g/m2
)
c. Chlorophyll content
d. Leaf area index
a. Effective tillers/hill
b. panicle length
c. no. of filled
gains/plant
d. no. of unfilled
grains/plant
e. 1000 grain weight
f. Grain yield
g. Straw yield
h. Harvest index
Cotton a. Plant height (cm)
b. Dry matter
accumulation
(g/m2
)
c. Chlorophyll content
d. Sympodial length
e. Sympodial
number/plant
f. Monopodial length
g. Monopodial
number/plant
a. No. of bolls/plant
b. Boll weight
c. Seed cotton
yield/plant
d. Ginning percentage
e. Seed index
f. Lint index
27 | P a g e
Soybean a. Plant height (cm)
b. Dry matter
accumulation
(g/m2
)
c. Chlorophyll content
d. Number and dry
weight of nodules
a. Number of branches
b. Pods per plant
c. No. of seeds per pod
d. 100 seed weight
e. Seed yield
f. Biological yield
g. Harvest index
Chick Pea a. Plant height (cm)
b. Drymatter
accumulation
(g/m2
)
c. Chlorophyll content
d. Number and dry
weight of nodules
h. Number of branches
i. Pods per plant
j. No. of seeds per pod
k. 100 seed weight
l. Seed yield
m. Biological yield
n. Harvest index
Other Parameters 1. Weather parameter
studies
2. Crop quality studies
such as protein content
3. Moisture content
Field Selection and Conduction of Crop Cutting Experiments (CCE)
1. Each CCE plot will be of minimum 5x5 sq m size or as defined by the Revenue Department of
the concerned state.
2. The plots for CCE will be selected based on the vegetation condition map (NDVI and NDWI)
derived from high resolution satellite data
3. The Field, where CCE will be conducted, should be at least of 1 acre area.
4. The CCE plot within the field will be representative of the whole field, not affected by site
specific external factors.
5. The selected field will be sole-cropped (no mixed cropping) with the concerned crop.
6. The CCE should be conducted in the field, which is ready for harvest.
7. The CCE plot will be at least 3 m away from the field borders.
8. The CCE data will be collected through Smartphones using the Android App. It will be
checked that the GPS accuracy is <5 m.
9. The smartphone will have Navigation App, for showing GPS reading and North Direction.
28 | P a g e
10. Each CCE information will come along with latitude - longitude and 2 photographs (of crop
cutting and grain weighing)
11. Additionally, 2 photographs i) of the field and ii) of the CCE plot (taken from 1 m above
nadir viewing) will also be provided.
12. For Cotton crop CCE will be conducted for at least 3 pickings.
13. The accuracy of Biomass weighing will be 2 decimal levels in kg and grain yield in 3
decimal levels.
14. The Biomass and Grain yield should be weighed using high precision digital balance.
Different digital balances should be used for weighing different items (Biomass, Grain Weight,
1000 Seed Weight)
15. Apart from the information coming through smart phones, the hardcopy form to be filled up
and signed by the Observer, farmer and a third party not related to above two, along with their
name and phone numbers will also be provided to the Centre.
16.The moisture percentage of Biomass will be obtained, at least in 5% cases, through drying
method. The Grain moisture percentage will be obtained using portable grain moisture meter
29 | P a g e
viii. Experimental Setup
 Identification of Villages, Gram Panchayats.
 The data will be recorded in four stages of crop growth i.e, Early, Mid growth, Pre-
harvest, Harvest. In all this stages the data will be recorded two times. The data will be
recorded as per the agronomical parameters which are shown in methodology.
 Data will be analyzed for the estimation of yield of concern crop.
Generation of Vegetation Index(NDVI)
Geo-Referencing
SATTELLITE IMAGES(At Different Vintages)
District wise Individual Crop estimation
Change detection between normal and current
year
Identification of loaction under stress
Hybrid Classification
Identification of Signatures
Delineation of Total Agriculural Land
30 | P a g e
Field Validation and Survey
Growth parameters Yield parameters
Machine Learning
Model selection Prediction and evaluation
Machine Learning
Data cleaning Feature engineering and selection
CROP YIELD ESTIMATION
Field Validation and Survey
Integration of all approaches
Remote sensing Machine Learnig
31 | P a g e
ix. Time line: 24 months
x. Expected Results:
 The data obtained from the project will be helpful to estimate the yield of the crops
 It help the farmers to overcome the risk and uncertainties
 Benefit cost Analysis
 Help farmers time, cost and energy
 Government can frame policies regarding crop insurance
 Collaboration of I.T. ,Remote Sensing and Agriculture to overcome the risk and
uncertainties
 Low income and marginal farmers can benefit with technology applied attributes.
xi. Tentative Cost/Budget
Tentative Budget
Manpower
(2 Research Associates, 6 J.R.F, 4 Field
Staff)
Rs.37,20,000/- (Thirty Seven Lakh Twenty Thousand)
Multi-temporal Satellite Data information
Rs. 7,00,000/- (Seven lakh)
Hard ware/ Software
(Graphical Processing Unit (GPU) enabled
Server with 512GB RAM, Client machine
with Intel i7 processor, 64GB RAM, 1 TB
SSD, External Hard Disk 10 TB
Rs. 10,00,000/- (Ten lakh)
Field verification and Data Collection Rs. 8,00,000/- (Eight Lakh)
Consumables Rs.6,00,000/- (Six Lakh)
Total Rs. 68,20,000/- (Sixty Eight Lakh Twenty Thousand)
32 | P a g e
xii. Lists of Patents/publications in the similar works:
 Prafull Singh (2019) Application of Thermal Imaging and Hyperspectral Remote
Sensing for Crop Water Deficit Stress Monitoring.Geocarto International. DOI:
10.1080/10106049.2019.1618922 (Impact Factor 1.759).
 Prafull Singh (2019) Comparison of Various Modelling Approaches for Water Deficit
Stress Monitoring in Rice Crop through Hyperspectral Remote Sensing. Agriculture
Water Management. 213, 231–244. (Impact Factor 3.182).
 Prafull Singh (2019) Probabilistic Landslide Hazard Assessment using Statistical
Information Value (SIV) and GIS Techniques: a case study of Himachal Pradesh, India.
1-12, American Geophysical Union. John Wiley & Sons,
 Prafull Singh (2019) A Comparative Study of Spatial Interpolation Technique (IDW and
Kriging) for Determining the Ground Water Quality.GIS and Geostatistical Techniques
for Groundwater Science, 1-15, doi.org/10.1016/B978-0-12-815413-7.00005-5 .Elsevier
(USA).
 Prafull Singh (2018) Monitoring spatial LULC changes and its growth prediction based
on Statistical Models and Earth Observation Datasets of Gautam Buddha Nagar, Uttar
Pradesh, India. Environment, Development and Sustainability. 1-19 (Impact Factor
1.379).
 Prafull Singh (2018) Morphotectonic Analysis of Sheer Khadd River Basin Using Geo-
spatial Tools. Spatial Information Research. 26, 4 , 405–414.
 Prafull Singh (2018) Modeling LULC Change Dynamics and its Impact on Environment
and Water Security: Geospatial Technology Based Assessment. Journal of Ecology,
Environment and conservation .24, 300-306.
 Prafull Singh (2018) Hydrological inferences through morphometric analysis of lower
Kosi river basin of India for water resource management based on remote sensing data .
Applied Water Science, DOI: 10.1007/s13201-018-0660-7.
33 | P a g e
 Prafull Singh (2017) Geoinformatics for assessing the inferences of quantitative
drainage morphometry of the Narmada Basin in India. Applied Geomatics. 9. 167–189.
 Prafull Singh (2017) Assessment of impervious surface growth in urban environment
through remote sensing estimates. Environmental Earth Science, 76:541-554. (Impact
Factor 1.435).
 Prafull Singh (2017) Impact of Land use Change and Urbanization on Urban Heat
Islands in Lucknow City, Central India. A Remote Sensing Based Estimate. Sustainable
Cities and Society. 32: 100-114. (Impact Factor 3.072).
 Pafull Singh (2016) Hydrogeological Component Assessment for Water Resources
Management of Semi-Arid Region: A Case Study of Gwalior, M.P., India. Aabian
Journal of Geoscience. DOI: 10.1007/s12517-016-2736-8.(Impact Factor 0.860).
 Prafull Singh (2016) Appraisal of Urban Lake Water Quality through Numerical Index,
Multivariate Statistics and Earth Observation Datasets. International Journal of
Environmental Science and Technology. 445-456. (Impact Factor 2.037).
 Prafull Singh (2016) Assessment of Urban Heat Islands (UHI) of Noida City, India
using multi-temporal satellite data. Sustainable Cities and Society, 19–28. (Impact Factor
3.072).
 Prafull Singh (2016) Appraisal of surface and groundwater of the Suburnarekha River
Basin, Jharkhand, India: Using remote sensing, Irrigation Indices and statistical
techniques. Geospatial technology for Water Resource Application. CRC Press, Taylor
Francis. ISBN: 978-1-4987-1968-1.
 Prafull Singh (2015) Morphometric evaluation of Swarnrekha watershed, Madhya
Pradesh, India: an integrated GIS-based approach. Applied Water Science. DOI:
10.1007/s13201-015-0354-3.
 Prafull Singh (2014) Hydrological Inferences from Watershed Analysis for Water
Resource Management using Remote Sensing and GIS Techniques. The Egyptian Journal
of Remote Sensing and Space Sciences. 17, 111–121.
34 | P a g e
 Prafull Singh (2015) Water Reuse Product in Urban Area. Urban Water Reuse Handbook.
CRC Press, Taylor Francis. ISBN: 9781482229141.
 Prafull Singh (2013) Assessment of Groundwater Prospect zones of a hard rock terrain
using Geospatial tool. Hydrological Science Journal (58: 213-223). (Impact Factor
2.546).
 Prafull Singh (2013) Morphometric analysis of Morar River Basin, Madhya Pradesh,
India, using remote sensing and GIS techniques. Environmental Earth Science (68:1967–
1977). (Impact Factor 1.435).
 Prafull Singh (2013) Geochemical modelling of fluoride concentration of hard rock
terrain of Madhya Pradesh, India. Acta Geologica Sinica. (87: 1421-1433). (Impact
Factor 2.506).
 Prafull Singh (2012) Groundwater resource evaluation in the Gwalior area, India, using
satellite data: an integrated geomorphologic and geophysical approach. Hydrogeology
Journal(19: 1421–1429). (Impact Factor2.071).
 Naleeni Ramawat, H.L. Sharma, and Rakesh Kumar 2012. Simulation and validation of
CERES-Maize model in North Western Himalayas. Applied Ecology and Environment
Research. 10(3):301-318.
 Ramawat Naleeni, Sharma Hira Lal and Kumar Rakesh 2009 Simulating sowing date
effect on barley varieties using CERES-Barley model in North Western Himalayas.
Indian Journal of Plant Physiology14 (2):147-155.
 K. Ramesh, Naleeni Ramawat and Virendra Singh. 2007. Leaf Area Distribution Pattern
and Non-Destructive Estimation Methods of Leaf Area for Stevia rebaudiana (Bert.)
Bertoni .Asian Journal of Plant Sciences 6 (7): 1037-1043.
 Ramawat Naleeni, Sharma Hira Lal and Kumar Rakesh 2009 Simulating sowing date
effect on barley varieties using CERES-Barley model in North Western Himalayas.
Indian Journal of Plant Physiology14 (2):147-155.
 Monika Choudhary and Renu Yadav (2013). Antagonistic potential of bacillus species
against plant pathogenic fungi. Progressive. Agriculture. 13(1): 49–54.
 Monika Choudhary, D.C. Sharma and Renu Yadav (2013). Antagonistic activities of
bacillus spp. strains isolated from the different soil samples. Progressive. Agriculture.
13(2): 223-227.
 Soi, Sangita; Chauhan, U.S.; Yadav, Renu; Kumar, J.; Yadav, S.S.; Yadav, Hemant and
Kumar, Rajendra(2014). STMS based diversity analysis in chickpea(Cicer arietinum L.),
35 | P a g e
New Agriculturist, New Agriculturist, 25(2) : 243–250. NAAS ISSN-0971-0647, NAAS
I.F.-4.17.
 Yadav, Yashwant K; Singh, Rajesh K.; Yadav, Manju; Kumar, Pushpendra Yadav,
M.K.; Kumar , Sujit ; Yadav, Renu; Upadhyaya, H.D. ; Yadav, Hemant and, Kumar,
Rajendra .(2014).Molecular characterization of a subset of minicore germplasm of
pigeonpea (Cajanus cajan ). BIOG-An International Journal, 1(1):39-46.
 Renu Yadav and Archana yadav (2015) Organic Farming management for Vegetable
Production in rural areas. Indian Journal of applied Research, 5(2): 40-42. (Impact factor:
2.1652).
 Renu Yadav and Archana yadav (2015) Low Cost Agricultural Practices to reduce heavy
metals..4(4) 70-71Global journal of research Analysis 2277-8160 Impact
factor3.1218
 Archana Yadav and Renu Yadav(2015). Role of Stress Tolerant Microbes in Sustainable
Agriculture. Indian journal of Research, 4(1):30-31. (Impact factor : 1.6714)
 Yadav Renu, Nainwal Navin Chandra (2015) Micropropagation of walnut (Juglans regia
L) trees Annals of Horticulture Year : Volume : 8, Issue : 1: ( 16) Last page : ( 21) Print
ISSN : 0974-8784. Online ISSN : 0976-4623.
 Yadav A.,Kumar A., Yadav Renu &Kumar R (2016) In-Vitro regeneration through
organogenesis in pigeonpea (Cajanus cajan(L.) Journal of Cell and Tissue Research
Vol. 16(1) ISSN: 0973-0028; E-ISSN: 0974-0910
 Naleeni Ramawat & Renu Yadav (2015) Organic Management practices to enhance
nitrogen use efficiency in rice. Global journal of Research Analysis.volume 4 Issue 8
ISSN NO 2277-8160 (2015)
 Sangeeta Mehrotra, Narendra K. Jawali, U.K.Chauhan and Renu Yadav
(2016)Transferability of Sequence tagged Microsattelite site (STMS)markers from Vigna
unguiculata (L). Progressive Agriculture 16 (1) pp36-40.
 Katoch Omika, Chauhan U.S., Yadav Renu & Kumar Rajendra (2016) Nitrate
Reductase based phylogenetic analysis in chickpea Research Journal of Chemistry and
Environment Vol. 20 (7) ISSN2249-555X
36 | P a g e
 Sashi prabha, Renu Yadav & Archana Yadav (2016) Isolation & Optimization of culture
conditions for polyBeta Hydroxybutrate (biopolymer)producing bacteria pp1926-
1929Journal of Global BiosciencesISSN 2320-1355 PEER Reviewed1.115.
 Renu Yadav, Syam Prasad, Sumeet Kumar Singh, Vishnu Vijay, Twinkle Sabu, Sonam
Lama, Pawan Kumar, Jadhav Sandesh, Anjali Thakur and Naleeni Ramawat. (2016). Bio-
management of sugarcane aphid Melanaphis Sacchari (z.) In sorghum. Plant Archives
Vol. 16 No. 2, 2016 pp. 559-562.Scopus Indexed journal
 Monica Chaudhary, Anjali. Malik, Archana Yadav, Naleeni Ramawat and Renu Yadav
(2016).evaluation of microbial antibiotic and commercial antibiotics. Journal of Global
Biosciences.volume5,No.5, pp 4145-4148.ISSN 2320-1355
 J.P. Misra, Gyan Manjary Rao, Ashwani Kumar, Ashwani Yadav,Sujit Kumar, Renu
Yadav, R. Kumar and Seweta Srivastava1Molecular Assisted Breeding for Ascochyta
Blight Resistance in Chickpea (Cicer arietinum L.) - A Review JOURNAL OF PURE
AND APPLIED MICROBIOLOGY, June 2016. Vol. 10(2), p. 1469-1475.
 Yadav Ashwani , Sharma Anubhuti , Kumar Ashwani , Yadav Renu , Misra J.P., Kumar
P., Singh D. and Kumar R. Expression Analysis of DREB2A Transcriptional Factor
under drought stresses in rice (Oryza sativa L.) Research Journal of BiotechnologyVol.
11 (8) August (2016).
 Misra J.P, Yadav Ashwani , Kumar Ashwani1,, Yadav Renu, Vaishali1 and Kumar R.
Bio-chemical characterization of chickpea genotypes with special reference to protein.
Research Journal of Chemistry and EnvironmentVol. 20 (8) August (2016).
 Naleeni Ramawat and Renu Yadav (2017) Influence of Bio-Fertilizers on growth
attributes of Gaur (Cymopsis Tetraagonoloba) Plant Archives Vol. 17 No. 2, 2017 pp.
869-870ISSN 0972-521
 Beila Sehdev Krishnan, Shivam, Naleeni Ramawat and Renu Yadav Investing in the
health of Soil: Paramount to Future of Organic Farming Plant Archives Vol. 17 No. 1,
2017 pp. 69-74 ISSN 0972-5210
 Rana R Badiyala D and Gunjan G. 2018. Effect of variable nitrogen sources on seed
yield, seed quality and nutrient uptake of okra (Abelmoschus esculentus (L.) Moench).
37 | P a g e
Indian Journal of Agricultural sciences 88 (6): 910–915, June {NAAS-6.22}/I028/0019-
5022
 Rana R and Badiyala D. 2014. Effect of integrated nutrient management on seed yield,
quality and nutrient uptake of soybean (Glycine max) under mid hill conditions of
Himachal Pradesh. Indian Journal of Agronomy 59(4): 641-645 {NAAS-
5.46}/I030/0537-197X
 Rana R and Badiyala D. 2014. Influence of organic manures, fertility levels and method
of storage on storability of soybean (Glycine max (L.) Merr.). Journal of Environment
and Bio-sciences 28(2): 145-150{NAAS- 4.43}J175/0973-6913
 Rana R and Badiyala D. 2014. Physiological parameters, nodulation and yield in
soybean as influenced by organic manures and fertility levels. Himachal Journal of
Agricultural Research 40(2): 110-117 /H011/0970-0595
 Gautam P, Sharma GD, Rana R and Lal B. 2013. Effect of integrated nutrient
management and spacing on growth parameters, nutrient content and productivity of rice
under system of rice intensification. International Journal of Research in Bio-sciences
2(3): 53-59
 Gautam P, Sharma GD, Rana R and Joshi E. 2013. Evaluation of integrated nutrient
management and plant density on productivity and profitability of rice (Oryza sativa)
under system of rice intensification in mid-hills of Himachal Pradesh. Indian Journal of
Agronomy 58 (3): 421-423
 Manoj R. Mane, Nilesh P. Tayade And Mahesh M. Kadam, Impact of adoption startup
scenario of recommended potato production technology by the potato growers in Gujarat,
Agriculture Update, Volume : 1, Issue : 12 , Feburary : 2017, Pg. no. 344-350.
 MANOJ R. MANE, NILESH P. TAYADE AND MAHESH M. KADAM, Extent of
adoption of potato production technology by the potato growers in Sabarkantha district of
Gujarat, Agriculture Update, Volume : 1, Issue : 12 , Feburary : 2017, Pg. no. 101-109.
 Kadam M.M., Sharad Sachan and R.G.Deshmukh (2016): Economic Analysis of Public
and Private Warehouses in Maharashtra- A Stochastic frontier Approach, Indian Journal
of Applied Research, Volume : 6 , Issue : 12 , December : 2016, Pg. no. 731-733.
 Kadam M.M., Sharad Sachan and R.G.Deshmukh (2016): Comparative Analysis of
Public and Private Food grain Warehousing in Vidarbha region of Maharashtra, Indian
Journal of Applied Research Volume : 6 , Issue : 12 , December : 2016, Pg. no. 727-
730.
 J. A. Lamtule, R. G. Deshmukh, V. K. Khobarkar And M. M. Kadam, Growth in Export
and Import of Cotton Under WTO Regime in India, Advances in Life Sciences 5(11),
2016. Pg. No. 4651-4657.
38 | P a g e
 J. A. Lamtule, R. G. Deshmukh, V. K. Khobarkar And M. M. Kadam, Growth and
Instability in Cotton Production Under WTO Regime, Advances in Life Sciences 5(11),
2016. Pg. No. 4338-4394.
 Gebbers and Adamchuk, 2010, Precision agriculture and food security, National Center
for Biotechnology Information, Science. 2010 Feb 12;327(5967):828-31. doi:
10.1126/science.1183899.
 David J. Mulla, 2012-13, Twenty five years of remote sensing in precision agriculture:
Key advances and remaining knowledge gaps, Elsevier Ltd. All rights reserved.
http://dx.doi.org/10.1016/j.biosystemseng.2012.08.009
 Vandana Bhatia 2019, A distributed overlapping community detection model for large
graphs using autoencoder, Elsevier-Future Generation Computer Systems( IF4.639), vol.
94, pp-16-26.
 Vandana Bhatia 2018, PFCA: An influence based parallel fuzzy clustering algorithm for
large complex networks, Wiley- Expert Systems, vol. 35, no. 6.
 Vandana Bhatia , 2018 Ap-FSM: A parallel algorithm for approximate frequent
subgraph mining using Pregel, Elsevier-Expert Systems with Applications (IF-3.768),
106, 217-232.
 Vandana Bhatia, 2018 DFuzzy: A Deep Learning Based Fuzzy Clustering Model for
Large Graphs, Springer-Knowledge and Information System, vol. 57, no. 1, pp159-181.
 Vandana Bhatia , 2017 A Parallel Fuzzy Clustering Algorithm for Large Graphs using
Pregel, Elsevier-Expert Systems with Applications (IF-3.768), 78, 135-144.
 Vandana Bhatia , 2017 An Efficient Influence based Label Propagation Algorithm for
Clustering large Graphs, presented in International Conference on Infocom Technologies
and Unmanned Systems (ICTUS'2017) held in Dubai during Dec 18-20.
 Vandana Bhatia , 2017 An Efficient Algorithm for Sampling of a Single Large Graph,
presented in IEEE Tenth International Conference on Contemporary Computing held at
JIIT, Noida on 10-12 August 2017.
39 | P a g e
 Vandana Bhatia ,2015 An Efficient Storage framework design for Cloud Computing:
Deploying Compression on De-duplicated No-SQL DB using Hadoop Distributed File
System, In IEEE 1st International Conference on Next Generation Computing
Technologies (NGCT), pp 1-6.
 Vandana Bhatia ,2014 SETiNS: Storage Efficiency Techniques in No-SQL database for
cloud based design, In IEEE International Conference on Advances in Engineering and
Technology Research (ICAETR), held on 1st and 2nd August 2014 at Dr. Virendra
Swarup Group of Institutions, Unnao, Uttar Pradesh, India.
 Vandana Bhatia ,2014 A review on Cloud Computing and Data Management in Cloud,
In 2nd International Conference on Futuristic Trends in Engineering and Management
held on 3rd and 4th May 2014, Ambala, Haryana, India. 2013 A Study on Swarm
Artificial Intelligence, International Journal of Advanced Research in Computer Science
and Software Engineering, Volume 3, Issue 8, August 2013.
 Mehta, Akriti, &Sharma, Deepak(2014). Towards SolvingtheGoogleCAPTCHA..
International Journal of Computer Applications, 89.20 , 32–35.
 Sharma, Deepak, & Devale, R. Prakash (2012). Approach for Transforming
Monolingual Text Corpus into XML Corpus. International Journal of Applied
Information Systems, 1.9, 1–5.
 Sharma, Deepak, Kumar, Bijendra, & Chand, Satish (2017). A Survey on Journey of
Topic Modelling Techniques from SVD to Deep Learning. International Journal of
Modern Education and Computer Science(IJMECS), Vol.9, No.7, pp.50-62, 2017. DOI:
10.5815/ijmecs.2017.07.06.
 Sharma, Deepak, Kumar, Bijendra, & Chand, Satish (2018). A Trend Analysis of
Machine Learning Research with Topic Models and Mann-Kendall Test. International
Journal of Intelligent Systems and Applications(IJISA), Vol.11, No.2, pp.70-82, 2019.
DOI: 10.5815/ijisa.2019.02.08.
 Saurabh Agarwal, Satish Chand and S. Nikolay, “SPAM Revisited for Median Filtering
Detection Using Higher-Order Difference,” Security and communication networks,
Wiley publications, vol. 9(17), November, 2016, pp. 4089-4102.
40 | P a g e
 Saurabh Agarwal and Satish Chand, “Anti-forensics of JPEG images using
interpolation,” International journal of image, graphics and signal processing, vol. 7(12),
November, 2015, pp. 10-17.
 Saurabh Agarwal and Satish Chand, “Image forgery detection using multi scale entropy
filter and local phase quantization,” International journal of image, graphics and signal
processing, vol. 7(10), September 2015, pp. 78-85.
 Mani, Neel, Helfert, Markus and Pahl, Claus (2016), Business Process Model
Customisation using Domain-driven Controlled Variability Management and Rule
Generation, International Journal on Advances in Software, vol. 9, pp. 179 - 190, 2016.
 Mani, Neel, Helfert, Markus, Pahl, Claus, Nimmagadda, Shastri L and Vasant, Pandian
(2017), Domain Models Definition for Rule Generation Using Controlled Variability
Management, Computational Intelligence, Innovative Computing, Optimization and Its
Applications.
 Mani, Neel, Helfert, Markus and Pahl, Claus (2017), A Framework for Generating
Domain-specific Rule for Process Model Customisation, In, International Conference on
Computer-Human Interaction Research and Applications (CHIRA), 31 Oct, 1-2 Nov
2017, Funchal, Maderia- Portugal.
 Mani, Neel, Helfert, Markus and Pahl, Claus (2017), Domain-specific Generation Using
Variability for Business Process Model Constraint, In, 21st International Conference on
Knowledge-Based and Intelligent Information & Engineering Systems, 06-08 Sep 2017,
Marseille, France.
 Sanjay Kumar, Mani, Neel and Singh, Bharat (2016) A framework for extracting reliable
information from unstructured uncertain big data In: 8th International KES Conference
on INTELLIGENT DECISION TECHNOLOGIES IDT 2016,15-17 June 2016 in Teneri
ORIGINAL PAPER
Appraisal of urban lake water quality through numerical index,
multivariate statistics and earth observation data sets
S. K. Singh1 • Prafull Singh2 • S. K. Gautam3
Received: 6 January 2015 / Revised: 23 May 2015 / Accepted: 5 July 2015 / Published online: 7 August 2015
Ó Islamic Azad University (IAU) 2015
Abstract The earth observation data sets were employed
to study the land use/land cover change in study area from
year 2000–2010. Vegetation, built-up area and agriculture
classes had shown maximum changes. The lake water
samples were analyzed, and further, Water Quality Index
(WQI) was computed to categorize the lake water. The
average value of WQI is 64.52, 52.23 and 42.45 in pre-
monsoon, monsoon and post-monsoon seasons, respec-
tively. Generally, pre-monsoon samples have higher num-
ber of polluted samples. Moreover, we applied the
multivariate statistical techniques for handling large and
complex data sets in order to get better information about
the lake water quality. Factor analysis and principal com-
ponent analysis are applied to understand the latent struc-
ture of the data sets, and we have identified a total of four
factors in pre-monsoon, three factors in monsoon and three
factors in post-monsoon season, which are responsible for
the whole data structure. These factors have explained that
90.908, 89.078 and 85.456 % of the cumulative percentage
variance of the pre-monsoon, monsoon and post-monsoon
data sets. Overall analysis reveals that the agricultural
runoff, waste disposal, leaching and irrigation with
wastewater, land transformation in the surrounding areas
are the main causes of lake water pollution followed by
some degree of pollution from geogenic sources such as
rock weathering. Hence, there is an urgent need of proper
attention and management of resources.
Keywords Lake Á Land use/land cover change Á
Pollution Á Earth observation data sets
Introduction
There are very limited studies on lake in India. In recent
decades, the developing countries are witnessed of water
pollution after industrialization, and unprecedented popu-
lation growth (Singh et al. 2013a, b, c, d; Ois¸te 2014;
Thakur et al. 2015; Gautam et al. 2015). The increasing
population around the urban lake has continuously
encroached lake area due to demand of land and water
(Singh et al. 2010) and acts as waste dumping sites which
have many adverse effects on humans (Rast ; Mishra and
Garg 2011). The direct discharge of sewage from the
households into the urban lake and the surface runoff
brings sediment, nutrients and chemicals from catchment
area into lake, and hence, they get polluted. These exces-
sive nutrients mainly nitrate and phosphates promote
excessive growth of aquatic plants in the lake and make
them anaerobic (Gautam et al. 2013) and destroy the
aquatic flora and fauna. Such undesirable change in water
chemistry (Akoto and Adiyiah 2007) brings deterioration
of lake water quality.
With rapid urban development since 1956, when Bhopal
became the state capital of Madhya Pradesh, the lake has
simultaneously been affected by increased inflows of silt,
untreated sewage, nutrients and pesticides from urban and
rural areas, and growing domestic water demand and
treatment costs for the municipal water supply. Therefore,
& Prafull Singh
singhgeoscience@rediffmail.com
1
K. Banerjee Centre of Atmospheric and Ocean Studies, IIDS,
Nehru Science Centre, University of Allahabad, Allahabad
211002, India
2
Amity Institute of Geo-Informatics and Remote Sensing,
Amity University, Sector 125, Noida 201303, India
3
School of Environmental Sciences, Jawaharlal Nehru
University, New Delhi 110067, India
123
Int. J. Environ. Sci. Technol. (2016) 13:445–456
DOI 10.1007/s13762-015-0850-x
the regular monitoring and assessment are a prerequisite to
understand the water quality. Many governments are now
seeing other approaches in response to increasing aware-
ness of degrading lake water resources and growing con-
cern over the significant fiscal burden of agricultural
subsidies.
Earth observation data sets, e.g., satellite images, are
quite useful, which could be used for synoptic representa-
tion of any area (Srivastava et al. 2010). Land use/land
cover change (LULCC) quantification is one of the major
application of earth observation data sets, and it is impor-
tant for assessing global environmental change processes
and helps in making new policies and optimizing the
maximum use of natural resources in sustainable manners
(Srivastava et al. 2012). The land use/land cover
(LULC) types, such as agricultural land and urban area, are
associated with human activities that often affect the water
quality and change the aquatic ecological environment;
hence, monitoring spatial–temporal changes is essential to
understand the driving factors which influence the water
quality of any area. Amin et al. (2014) and Mishra and
Garg (2011) has did research on lake of India by implying
the satellite data.
According to Singh et al. (2015), the concept of water
quality to categorize water according to its degree of purity
or pollution dated back to year 1848. Around the same
time, the importance of water quality to public health was
recognized in the UK (Snow 1856). Water Quality Index
(WQI) methodologies have been developed to provide
single number that expresses the overall water quality at a
certain location and time, based on several water quality
parameters (Parmar and Bhardwaj 2013; Vasanthavigar
et al. 2010; Avvannavar and Shrihari 2008; Singh et al.
2015) and can be used to provide the overall summaries of
water quality on a scientific basis. Parmer and Bhardwaj
(2013) have applied WQI and fractal dimension approach
to study the water of Harike lake on the confluence of Beas
and Sutlej rivers of Punjab (India). Many researchers have
discussed the importance and applicability of WQI for
water characterization (Couillard and Lefebvre 1985;
House and Newsome 1989; Bordalo et al. 2001; Smith
1989; Swamee Tyagi 2000; Sanchez et al. 2007).
In combination with remote sensing water quality, the
use of multivariate statistical techniques offers a detailed
understanding of water quality parameters and possible
factors that influence the water quality behavior (Srivastava
et al. 2012). Principal component analysis (PCA) and factor
analysis (FA) offer a valuable tool for consistent, reliable,
effective management of water resources (Srivastava et al.
2012; Singh et al. 2009, 2013d, 2015). Many authors in past
have used multivariate statistical techniques to characterize
and evaluate surface and groundwater quality and have
found it interesting for studying the variations caused by
geogenic and anthropogenic factors (Shrestha and Kazama
2007; Singh et al. 2005). For understanding the lake water
quality, multivariate statistical techniques integrated with
remote sensing, and WQI (Srivastava et al. 2012) could be
used for identification of the possible factor/sources that
influences urban lake water quality.
As the study area occupied by hard basaltic terrain and
groundwater resource are limited. Hence, largely the water
supply in urban areas setteled at hard rock terrain depends
on lake water too for drinking and small scale industrial
purposes. The water supply of bhopal urban area mainly
depends on the Bhopal lake for drinking, irrigation and
small scale industries.
The specific objective of this research was focused on to
quantify the historical changes in LULC using satellite data
sets and its probable impact on the lake water quality with
integration of statistical techniques to know the pollution
status of Bhopal lake and to categorize lake water by WQI
method. The findings of the study will be useful for the
restoration of Bhopal lake.
Materials and methods
Description of study area
District Bhopal [latitudes 20°100
–23°200
N and longitudes
77°150
–77°250
E (Fig. 1)] is the capital city of the state of
Madhya Pradesh, India. Upper lake commonly known as
Bhoj wetland is the main lake of the city and provides
water to the dwellers. The lake surrounded by natural
landscape, settlements and agricultural fields. The average
annual rainfall is 1270 mm. The southern part of the city
receives more rainfall than northern part of the city. The
maximum rainfall takes place during the month of July.
The area is drained by small drains which are lastly
contributing water to the river Betwa in the downstream.
Bhopal has been growing at a fast rate due to urban
development and industrialization, in search of better
facilities and for educational purposes. The major part of
the city is covered by Vindhyan hills and by basaltic
Deccan trap. The Deccan trap covers almost one-third of
the area followed by Vindhyan sandstone (Singh and Singh
2012). In Deccan trap basalts, aquifer is encountered at
shallow depth and in Vindhyan sandstone depth ranges
more than 150 meter below ground level (mbgl). The water
supply to Bhopal city mainly comes from surface water
bodies and small amount by groundwater. Nowadays, a
number of boreholes/tube wells are drilled in the area
without consideration of hydrological status of the aquifer
formation to meet the water requirement, and this unaware
drilling has also led to the declining trend of water level
and also failure of well in successive years. Upper lake is a
446 Int. J. Environ. Sci. Technol. (2016) 13:445–456
123
major source of drinking water for the urban residents,
serving around 40 % of the residents with nearly
140,000 m3
of water per day. Bada talaab, along with the
nearby Chhota talaab, constitutes Bhoj wetland, which is
now a Ramsar site. The two lakes support flora and fauna.
White stork, blacknecked stork, barheaded goose,
spoonbill, etc., which have been rare sightings in the past,
have started appearing. A recent phenomenon is the gath-
ering of 100–120 sarus cranes in the lake. The largest bird
of India, sarus crane (Grusantigone), is known for its size,
majestic flight and lifetime pairing. Flora 106 species of
Macrophytes (belonging to 87 genera of 46 families),
Fig. 1 Location map of Bhopal
Lake, MP, India
Int. J. Environ. Sci. Technol. (2016) 13:445–456 447
123
which includes 14 rare species and 208 species of Phyto-
plankton comprising 106 species of Chlorophyceae, 37
species of Cyano phyceae, 34 species of Euglenophyceae,
27 species of Bacilariophyceae and 4 species of Dino-
phyceae. Fauna 105 species of zooplanktons, which
includes (rotifera 41, Protozoa 10, Cladocera 14, Copepoda
5, Ostracoda 9, Coleoptera 11, and Diptera 25). Fish fauna
consist of 43 species (natural and cultured species), and 27
species of avifauna, 98 species of insects and more than 10
species of reptiles and amphibians (including 5 species of
tortoise) have been recorded.
Geology and geomorphology of the study area
The Deccan trap sequence consists of multiple layers of
solidified lava flows. It is more than 2000 m thick on its
western margin and decreases in thickness eastward and
occupies *5, 00,000 km2
area spread over parts of Mad-
hya Pradesh, Maharashtra, Gujarat, Andhra Pradesh and
Karnataka (Singh et al. 2011, 2013a, b, c). The basaltic
lava flows vary in color from dark gray to purple and pink.
Each lava flow consists of an upper vesicular unit and a
lower massive unit which may or may not be fractured/
jointed. Two lava flows at some places are separated by
intertrappean sedimentary beds. Therefore, unlike other
hard rocks, the Deccan trap behaves as a multiaquifer
system, somewhat similar to a sedimentary rock sequence.
Bhopal is occupied by the rocks of Vindhyan and Deccan
trap basalt and alluvial formations. Hydrogeologically, area
is divided into three major type’s alluvium, Deccan trap
and Vindhyan sandstones with small patches of shale
which makes the major aquifers of the city.
In the study area, Deccan trap is sporadically distributed
mainly in the form of linear patches. On the satellite image,
this rock type is seen with distinct gray color with rough
texture. The derivatives of Deccan trap rock are the black
soils, which are seen on the satellite image as dark gray tone
with smooth texture. The major geomorphic landforms
within the catchment of Bhopal lake are pediplain, shallow
weathered/shallow buried pediplain and pediplain weath-
ered/buried with varying thickness. On the basis of thick-
ness and composition of weathered material, the pediplain
has been classified into shallow weathered pediplain and
moderate weathered pediplain (Singh et al. 2013a, b, c).
Most of the area covers under shallow pediplain; hence, this
landform classified as good zone of groundwater and agri-
cultural activity within the lake catchment.
Data and Methodology
The study is mainly based on laboratory based data, sup-
plemented by primary information especially of social and
economic characteristics.
Land use/land cover
The earth observation data sets used for the preparation
of LULC maps of year 2000 and 2010 using Landsat
satellite images. The multispectral satellite image from
the Landsat data was geometrically rectified and regis-
tered with Survey of India (SOI) topographical sheets
used as a reference for taking ground control points
(GCP) by using UTM projection and WGS 84 datum.
Further, all geocoded images were mosaic using
ERDAS Imagine 9.1. Further, for assistance in the
process of interpretation, SOI (55 E/7 and 55 E/8) at
1:50,000 scales was used as the reference map for
interpretation of the basic information of the lake
catchment (Table 1).
Field and laboratory analysis
Water samples were collected during month of January
2010–December 2010 on monthly time intervals in 1 L
plastic bottles. Total of 15 sample collection sites were
monitored for chemical pollutant analyses during pre-
monsoon, monsoon and post-monsoon seasons. The col-
lected samples were separated into three aliquots. All
samples were stored at 4 °C for further analysis. Col-
lection and analysis were performed as specified standard
international methods (APHA, 1999). Total alkalinity (as
HCO3
-
), total hardness, calcium, magnesium, chloride,
phosphate, nitrate, biological oxygen demand (BOD) and
chemical oxygen demand (COD) were measured from
the collected samples on the monthly basis. Alkalinity is
measured using a Hath field titration kit (through titration
with 0.1 M HCl). The major cations are (Mg2?
and
Ca2?
) analyzed using an atomic absorption spectropho-
tometer. Major anions (Cl-
, NO3–N and PO4
3-
) for
samples are undertaken by ion chromatography. The
Table 1 Different standard given by World Health Organization
Sr. no. Parameters Standard (Si) Wi
1 Total alkalinity 120 0.0084
2 Total hardness 500 0.002
3 Calcium content 75 0.0134
4 Magnesium content 75 0.0134
5 Chloride 250 0.004
6 Phosphate 1.5 0.6689
7 Nitrate 50 0.0201
8 BOD 5 0.2007
9 COD 14.5 0.0692
P
Wi = 1
Vi = 0 for the parameters except for pH and dissolved oxygen
(D.O) (Sinha and Saxena 2006)
448 Int. J. Environ. Sci. Technol. (2016) 13:445–456
123
methodological limitations starts from collection of
samples, transportation, sample analysis in laboratory,
instrumentation limitation in terms of sensitivity and
precision, and interpretation of results. The sampling and
analysis were performed according to APHA (1999).
Methodological limitation of ion chromatography is
equivalency, and a high concentration of any one ion
also interferes with the resolution, and sometimes
retention, of others. Sample dilution or gradient elution
overcomes much interference. To resolve uncertainties of
identification or quantitation, use the method of known
additions. The most troublesome type of interference is
termed ‘‘chemical’’ and results from the lack of absorp-
tion by atoms bound in molecular combination in the
flame. This can occur when the flame is not hot enough
to dissociate the molecules or when the dissociated atom
is oxidized immediately to a compound that will not
dissociate further at the flame temperature. Such inter-
ferences may be reduced or eliminated by adding specific
elements or compounds to the sample solution. The
precision and accuracy of the analysis are within 5 %
(evaluated through repeated analyses of standards and
samples) (Singh et al. 2015). In the present study, we did
not analyze any lake sediment and water for the metal
analysis due to financial constraints which will be our
future scope of research.
Water Quality Index estimation
WQI provides an unambiguous picture about the
usability of water for different purposes such as drinking,
irrigation and industrial usage (Singh et al. 2015).
However, it is difficult to simplify surface and ground-
water quality to a specific index because of its sensitive
nature to inputs received from sources such as geogenic
contribution, water–rock reactions, agricultural runoff,
domestic and industrial wastes (Singh et al. 2012).
However, the modified WQI by Tiwari and Mishra
(1985) is useful and efficient method for assessing the
quality of water and presently used by many scientists
and water managers. To determine the suitability of the
water for drinking purposes (Srivastava et al. 2012;
Singh et al. 2015), WQI can be estimated by using the
following methodology:
WQI ¼ Anti log
Xn
i¼1
Wi log10 qi
" #
ð1Þ
where Wi is the weighting factor computed using equation
Wi ¼ K=Si ð2Þ
K is proportionality constant derived from Eq. 3
K ¼
1
Pn
i¼1
1=Si
 
2
6
6
4
3
7
7
5 ð3Þ
where Si is the World Health Organization (WHO) standard
values of the water quality parameter.
Quality rating (qi) is calculated using the formula,
qi ¼ Vactual À Videalð Þ= Vstandard À Videalð Þ½ Š Â 100 ð4Þ
where qi is quality rating of ith parameter for a total of n
water quality parameters, Vactual is the value of the water
quality parameter obtained from laboratory analysis, Videal
is zero except for pH and D.O. and Vstandard is WHO
standard of the water quality parameters (Table 1). The
rating and category chart for WQI is represented through
Table 2.
Multivariate statistical method
The application of multivariate statistical techniques is
very useful for classification, modeling and interpretation
of large data sets which allow the reduction in dimen-
sionality of the large data sets (Singh et al. 2009, 2015).
FA/PCA techniques are applied for multivariate analysis of
data sets of lake water quality. PCA is applied after stan-
dardizing the data sets through the z-scale transformation
to avoid any misclassification (Singh et al. 2015). The
principal component (PC) is expressed as:
zij ¼ ai1x1j þ ai2x2j þ ai3x3j þ Á Á Á þ aimxmj ð5Þ
where a is the component loading, z the component
score, x the measured value of a variable, i the component
number, j the sample number, and m the total number of
variables. The FA analysis attempts to reduce the
contribution to less significant variables obtained from
PCA and the new group of variables known as varifactors
(VFs). VFs are extracted through rotating the axis defined
by PCA. In FA, the basic concept is expressed in Eq. (6),
zji ¼ af1f1i þ af2f2i þ af3f3i þ Á Á Á þ afmfmi þ efi ð6Þ
where z is the measured value of a variable, a the factor
loading, f the factor score, e the residual term accounting
Table 2 Rating and category chart of WQI
Sr. no. WQI level Water quality rating
1 25 Excellent
2 26–50 Good
3 51–75 Poor
4 76–100 Very Poor
5 [100 Unfit for drinking purposes
Int. J. Environ. Sci. Technol. (2016) 13:445–456 449
123
for errors or other sources of variation, i the sample num-
ber, j the variable number and m the total number of
factors.
Results and discussion
Hydrochemistry of lake water
The descriptive statistics of 12 physicochemical parameters
at the 15 locations are summarized in Table 3. The average
value of total alkalinity 78.67, 60.07 and 57.20 was
observed during the pre-monsoon, monsoon and post-
monsoon seasons. Carbonate alkalinity average value was
13.19, 11.80 and 6.80, and bicarbonate alkalinity was
65.49, 49.43 and 50.96; total hardness average value was
85.25, 94.77 and 89.84, calcium hardness was 60.12, 67.10
and 68.58 and magnesium hardness was 25.14, 27.67 and
21.27 in the pre-monsoon, monsoon and post-monsoon
seasons, respectively. Calcium and magnesium are an
essential nutrient that is required by all living organisms.
Calcium and magnesium are entirely derived from rock
weathering. The sources of Ca mainly are carbonate rocks
containing calcite (CaCO3) and dolomite [(CaMg(CO3)2],
with a lesser proportion derived from Ca-silicate minerals.
Calcium is usually one of the most important contributors
to hardness. The average value of Ca was 25.25, 28.18 and
28.80, magnesium 6.11, 6.72 and 5.17 in the pre-monsoon,
monsoon and post-monsoon seasons, respectively.
Chloride is extremely mobile and very much soluble in
surface water. The main geogenic sources of chloride are
sea salt and dissolution of halite (NaCl) in bedded evap-
orites or dispersed in shales, and anthropogenic sources are
domestic and industrial sewage, mining, and road salt
runoff. The average value of chloride was 6.13, 21.03 and
19.35 in the all three seasons, respectively.
Phosphorus is a vital and often limiting nutrient. The
most common minerals are apatite, which is calcium
phosphate with variable amounts of hydroxyl-, chloro-, or
fluoro-apatite and various impurities. Some other phos-
phate minerals contain aluminum or iron. The anthro-
pogenic sources of phosphorus are domestic sewage, as the
element is essential in metabolism, industrial sewage and
household detergents. Phosphates and nitrates are the major
cause of eutrophication problem in lakes. The average
values of phosphate were 1.05, 0.76 and 0.62, total phos-
phorous was 1.62, 1.91, and 1.80, organic phosphorous was
1.13, 1.16 and 1.18 and nitrate was 0.73, 0.73 and 0.64 in
the pre-monsoon, monsoon and post-monsoon season,
respectively. Aqueous geochemistry behavior of nitrogen is
strongly influenced by the vital importance of the element
in plants and animal nutrition. The anthropogenic sources
of nitrate in surface water are runoff from the agriculture
field, and leachates from the landfill sites. The BOD was
3.83, 4.83 and 4.42, and COD was 29.60, 21.06 and 15.73
in the pre-monsoon, monsoon and post-monsoon season,
respectively. The development activity and expansion of
the city leading to discharge of waste water in the upper
Table 3 Physicochemical properties of lake water samples during the three seasons (all the parameters units are in mg/l)
Parameters Pre-monsoon Monsoon Post-monsoon
Max Min Avg Std Max Min Avg Std Max Min Avg Std
Total alkalinity 129.60 61.60 78.67 18.55 98.00 49.00 60.07 12.03 78.67 46.67 57.20 7.50
Carbonate alkalinity 17.60 7.00 13.19 2.95 16.67 7.00 11.80 2.78 11.33 4.00 6.80 2.30
Bicarbonate alkalinity 118.40 46.00 65.49 19.84 94.50 36.50 49.43 13.99 76.00 42.67 50.96 8.06
Total hardness 146.00 74.80 85.25 17.53 155.50 79.50 94.77 18.13 116.67 62.67 89.84 17.23
Ca hardness 105.00 51.66 60.12 13.26 122.85 55.65 67.10 16.66 104.30 55.30 68.58 12.99
Mg hardness 41.00 18.56 25.14 5.90 33.73 19.48 27.67 5.27 42.07 7.37 21.27 10.38
Calcium content 44.10 21.70 25.25 5.57 51.60 23.37 28.18 7.00 43.81 23.23 28.80 5.46
Magnesium content 9.96 4.51 6.11 1.43 8.20 4.73 6.72 1.28 10.22 1.79 5.17 2.52
Chloride 31.17 12.99 16.13 4.27 35.21 16.23 21.03 4.54 27.64 15.65 19.35 2.83
Phosphate 3.19 0.49 1.05 0.68 3.14 0.18 0.76 0.74 3.06 0.12 0.62 0.72
Total phosphorus 3.56 0.94 1.62 0.71 4.05 1.15 1.91 0.8 3.93 1.03 1.80 0.80
Organic phosphorus 2.31 0.43 1.13 0.47 2.33 0.45 1.16 0.47 2.66 0.55 1.18 0.51
Nitrate 1.88 0.11 0.73 0.46 1.86 0.09 0.73 0.45 1.77 0.07 0.64 0.46
BOD 4.88 3.08 3.83 0.56 11.60 3.40 4.83 1.94 10.00 2.00 4.42 2.60
COD 44.80 23.20 29.60 4.70 35.00 16.06 21 4.75 30.67 12.00 15.73 4.37
450 Int. J. Environ. Sci. Technol. (2016) 13:445–456
123
Research proposal amity university

More Related Content

What's hot

Gis powerpoint
Gis powerpointGis powerpoint
Gis powerpointkaushdave
 
Spatial vs non spatial
Spatial vs non spatialSpatial vs non spatial
Spatial vs non spatialSumant Diwakar
 
Surface Analysis in GIS
Surface Analysis in GISSurface Analysis in GIS
Surface Analysis in GISRituSaha3
 
Introduction to remote sensing and gis
Introduction to remote sensing and gisIntroduction to remote sensing and gis
Introduction to remote sensing and gisMohsin Siddique
 
Application of GIS in Modelling Landuse Changes Of Gurupavanapuri, Kerala, India
Application of GIS in Modelling Landuse Changes Of Gurupavanapuri, Kerala, IndiaApplication of GIS in Modelling Landuse Changes Of Gurupavanapuri, Kerala, India
Application of GIS in Modelling Landuse Changes Of Gurupavanapuri, Kerala, IndiaSharik Shamsudhien
 
Geographic information system (gis)
Geographic information system (gis)Geographic information system (gis)
Geographic information system (gis)Vandana Verma
 
Geographic coordinate system & map projection
Geographic coordinate system & map projectionGeographic coordinate system & map projection
Geographic coordinate system & map projectionvishalkedia119
 
Geographical Information System (GIS) Georeferencing and Digitization, Bihar ...
Geographical Information System (GIS) Georeferencing and Digitization, Bihar ...Geographical Information System (GIS) Georeferencing and Digitization, Bihar ...
Geographical Information System (GIS) Georeferencing and Digitization, Bihar ...Kamlesh Kumar
 
Change detection process and techniques
Change detection process and techniquesChange detection process and techniques
Change detection process and techniquesAlexander Decker
 
Remote sensing concept, history and principles
Remote sensing  concept, history and principlesRemote sensing  concept, history and principles
Remote sensing concept, history and principlesAjay Singh Lodhi
 
Assessment of accessibility to healthcare facilities using GIS (Review of Two...
Assessment of accessibility to healthcare facilities using GIS (Review of Two...Assessment of accessibility to healthcare facilities using GIS (Review of Two...
Assessment of accessibility to healthcare facilities using GIS (Review of Two...Mohammad Az-Zahrani
 
Geo referencing by Mashhood Arif
Geo referencing by Mashhood ArifGeo referencing by Mashhood Arif
Geo referencing by Mashhood ArifKU Leuven
 
Components of Spatial Data Quality in GIS
Components of Spatial Data Quality in GISComponents of Spatial Data Quality in GIS
Components of Spatial Data Quality in GISKaium Chowdhury
 
Chapter 1 (Introduction to remote sensing)
Chapter 1 (Introduction to remote sensing)Chapter 1 (Introduction to remote sensing)
Chapter 1 (Introduction to remote sensing)Shankar Gangaju
 

What's hot (20)

Gis powerpoint
Gis powerpointGis powerpoint
Gis powerpoint
 
Spatial vs non spatial
Spatial vs non spatialSpatial vs non spatial
Spatial vs non spatial
 
Surface Analysis in GIS
Surface Analysis in GISSurface Analysis in GIS
Surface Analysis in GIS
 
GIS data analysis
GIS data analysisGIS data analysis
GIS data analysis
 
Introduction to remote sensing and gis
Introduction to remote sensing and gisIntroduction to remote sensing and gis
Introduction to remote sensing and gis
 
Application of GIS in Modelling Landuse Changes Of Gurupavanapuri, Kerala, India
Application of GIS in Modelling Landuse Changes Of Gurupavanapuri, Kerala, IndiaApplication of GIS in Modelling Landuse Changes Of Gurupavanapuri, Kerala, India
Application of GIS in Modelling Landuse Changes Of Gurupavanapuri, Kerala, India
 
Geographic information system (gis)
Geographic information system (gis)Geographic information system (gis)
Geographic information system (gis)
 
Geographic coordinate system & map projection
Geographic coordinate system & map projectionGeographic coordinate system & map projection
Geographic coordinate system & map projection
 
Geographical Information System (GIS) Georeferencing and Digitization, Bihar ...
Geographical Information System (GIS) Georeferencing and Digitization, Bihar ...Geographical Information System (GIS) Georeferencing and Digitization, Bihar ...
Geographical Information System (GIS) Georeferencing and Digitization, Bihar ...
 
GIS Data Types
GIS Data TypesGIS Data Types
GIS Data Types
 
Research in geography
Research in geographyResearch in geography
Research in geography
 
Change detection process and techniques
Change detection process and techniquesChange detection process and techniques
Change detection process and techniques
 
Remote sensing concept, history and principles
Remote sensing  concept, history and principlesRemote sensing  concept, history and principles
Remote sensing concept, history and principles
 
Assessment of accessibility to healthcare facilities using GIS (Review of Two...
Assessment of accessibility to healthcare facilities using GIS (Review of Two...Assessment of accessibility to healthcare facilities using GIS (Review of Two...
Assessment of accessibility to healthcare facilities using GIS (Review of Two...
 
Geo referencing by Mashhood Arif
Geo referencing by Mashhood ArifGeo referencing by Mashhood Arif
Geo referencing by Mashhood Arif
 
Components of Spatial Data Quality in GIS
Components of Spatial Data Quality in GISComponents of Spatial Data Quality in GIS
Components of Spatial Data Quality in GIS
 
Lecture 1 precise levelling
Lecture 1 precise levellingLecture 1 precise levelling
Lecture 1 precise levelling
 
Chapter 1 (Introduction to remote sensing)
Chapter 1 (Introduction to remote sensing)Chapter 1 (Introduction to remote sensing)
Chapter 1 (Introduction to remote sensing)
 
Data sources and input in GIS
Data  sources and input in GISData  sources and input in GIS
Data sources and input in GIS
 
Basics in Cartography
Basics in Cartography Basics in Cartography
Basics in Cartography
 

Similar to Research proposal amity university

(Ipm) in cotton production in sindh pakistan
(Ipm) in cotton production in sindh pakistan(Ipm) in cotton production in sindh pakistan
(Ipm) in cotton production in sindh pakistansanaullah noonari
 
Economic evaluation of rice ipm practices in mada, malaysia
Economic evaluation of rice ipm practices in mada, malaysiaEconomic evaluation of rice ipm practices in mada, malaysia
Economic evaluation of rice ipm practices in mada, malaysiaAlexander Decker
 
Using AI to Recommend Pesticides for Effective Management of Multiple Plant D...
Using AI to Recommend Pesticides for Effective Management of Multiple Plant D...Using AI to Recommend Pesticides for Effective Management of Multiple Plant D...
Using AI to Recommend Pesticides for Effective Management of Multiple Plant D...IRJET Journal
 
Importance of Data Analysis in Indian Agriculture
Importance of Data Analysis in Indian AgricultureImportance of Data Analysis in Indian Agriculture
Importance of Data Analysis in Indian AgricultureVipulKumarPathak1
 
Monitoring of Autumn crop 16 March, 2016
Monitoring of Autumn crop 16 March, 2016Monitoring of Autumn crop 16 March, 2016
Monitoring of Autumn crop 16 March, 2016DEVENDRA PAL SINGH
 
Selection of crop varieties and yield prediction based on phenotype applying ...
Selection of crop varieties and yield prediction based on phenotype applying ...Selection of crop varieties and yield prediction based on phenotype applying ...
Selection of crop varieties and yield prediction based on phenotype applying ...IJECEIAES
 
Pesticide recommendation system for cotton crop diseases due to the climatic ...
Pesticide recommendation system for cotton crop diseases due to the climatic ...Pesticide recommendation system for cotton crop diseases due to the climatic ...
Pesticide recommendation system for cotton crop diseases due to the climatic ...IJMREMJournal
 
Application of DATA SCIENCE in Agricultural Industry.pptx
Application of DATA SCIENCE in Agricultural Industry.pptxApplication of DATA SCIENCE in Agricultural Industry.pptx
Application of DATA SCIENCE in Agricultural Industry.pptxShreyaBose29
 
Impact of Frontline Demonstration (Fld’s) On Adoption Behavior of Soybean Gro...
Impact of Frontline Demonstration (Fld’s) On Adoption Behavior of Soybean Gro...Impact of Frontline Demonstration (Fld’s) On Adoption Behavior of Soybean Gro...
Impact of Frontline Demonstration (Fld’s) On Adoption Behavior of Soybean Gro...iosrjce
 
JAAR, Vol 11 N0.1 August 2023.
JAAR, Vol 11 N0.1 August 2023.JAAR, Vol 11 N0.1 August 2023.
JAAR, Vol 11 N0.1 August 2023.ARCN
 
Sustainability of scientific maize cultivation practices in uttar pradesh, india
Sustainability of scientific maize cultivation practices in uttar pradesh, indiaSustainability of scientific maize cultivation practices in uttar pradesh, india
Sustainability of scientific maize cultivation practices in uttar pradesh, indiaAlexander Decker
 
Agriculture in Indian Economy and Contribution of Science and Technology
Agriculture in Indian Economy and Contribution of Science and Technology  Agriculture in Indian Economy and Contribution of Science and Technology
Agriculture in Indian Economy and Contribution of Science and Technology IIJSRJournal
 
Role of Knowledge among Yemeni Agricultural Specialists in Applying the Proce...
Role of Knowledge among Yemeni Agricultural Specialists in Applying the Proce...Role of Knowledge among Yemeni Agricultural Specialists in Applying the Proce...
Role of Knowledge among Yemeni Agricultural Specialists in Applying the Proce...ijtsrd
 
Presentation at the 95th Governing Board meeting (Program Committee) By Resea...
Presentation at the 95th Governing Board meeting (Program Committee) By Resea...Presentation at the 95th Governing Board meeting (Program Committee) By Resea...
Presentation at the 95th Governing Board meeting (Program Committee) By Resea...ICRISAT
 
A study on real time plant disease diagonsis system
A study on real time plant disease diagonsis systemA study on real time plant disease diagonsis system
A study on real time plant disease diagonsis systemIJARIIT
 
Towards Indian Agricultural Information: A Need Based Information Flow Model
Towards Indian Agricultural Information: A Need Based Information Flow ModelTowards Indian Agricultural Information: A Need Based Information Flow Model
Towards Indian Agricultural Information: A Need Based Information Flow Modelinventionjournals
 
106951 291159-1-pb
106951 291159-1-pb106951 291159-1-pb
106951 291159-1-pbcrazyleo74
 

Similar to Research proposal amity university (20)

Career Guidance Hand Book
Career Guidance Hand BookCareer Guidance Hand Book
Career Guidance Hand Book
 
(Ipm) in cotton production in sindh pakistan
(Ipm) in cotton production in sindh pakistan(Ipm) in cotton production in sindh pakistan
(Ipm) in cotton production in sindh pakistan
 
Minor Project Report.pdf
Minor Project Report.pdfMinor Project Report.pdf
Minor Project Report.pdf
 
Economic evaluation of rice ipm practices in mada, malaysia
Economic evaluation of rice ipm practices in mada, malaysiaEconomic evaluation of rice ipm practices in mada, malaysia
Economic evaluation of rice ipm practices in mada, malaysia
 
Using AI to Recommend Pesticides for Effective Management of Multiple Plant D...
Using AI to Recommend Pesticides for Effective Management of Multiple Plant D...Using AI to Recommend Pesticides for Effective Management of Multiple Plant D...
Using AI to Recommend Pesticides for Effective Management of Multiple Plant D...
 
Importance of Data Analysis in Indian Agriculture
Importance of Data Analysis in Indian AgricultureImportance of Data Analysis in Indian Agriculture
Importance of Data Analysis in Indian Agriculture
 
Monitoring of Autumn crop 16 March, 2016
Monitoring of Autumn crop 16 March, 2016Monitoring of Autumn crop 16 March, 2016
Monitoring of Autumn crop 16 March, 2016
 
Selection of crop varieties and yield prediction based on phenotype applying ...
Selection of crop varieties and yield prediction based on phenotype applying ...Selection of crop varieties and yield prediction based on phenotype applying ...
Selection of crop varieties and yield prediction based on phenotype applying ...
 
Pesticide recommendation system for cotton crop diseases due to the climatic ...
Pesticide recommendation system for cotton crop diseases due to the climatic ...Pesticide recommendation system for cotton crop diseases due to the climatic ...
Pesticide recommendation system for cotton crop diseases due to the climatic ...
 
Application of DATA SCIENCE in Agricultural Industry.pptx
Application of DATA SCIENCE in Agricultural Industry.pptxApplication of DATA SCIENCE in Agricultural Industry.pptx
Application of DATA SCIENCE in Agricultural Industry.pptx
 
Impact of Frontline Demonstration (Fld’s) On Adoption Behavior of Soybean Gro...
Impact of Frontline Demonstration (Fld’s) On Adoption Behavior of Soybean Gro...Impact of Frontline Demonstration (Fld’s) On Adoption Behavior of Soybean Gro...
Impact of Frontline Demonstration (Fld’s) On Adoption Behavior of Soybean Gro...
 
JAAR, Vol 11 N0.1 August 2023.
JAAR, Vol 11 N0.1 August 2023.JAAR, Vol 11 N0.1 August 2023.
JAAR, Vol 11 N0.1 August 2023.
 
Sustainability of scientific maize cultivation practices in uttar pradesh, india
Sustainability of scientific maize cultivation practices in uttar pradesh, indiaSustainability of scientific maize cultivation practices in uttar pradesh, india
Sustainability of scientific maize cultivation practices in uttar pradesh, india
 
Agriculture in Indian Economy and Contribution of Science and Technology
Agriculture in Indian Economy and Contribution of Science and Technology  Agriculture in Indian Economy and Contribution of Science and Technology
Agriculture in Indian Economy and Contribution of Science and Technology
 
Role of Knowledge among Yemeni Agricultural Specialists in Applying the Proce...
Role of Knowledge among Yemeni Agricultural Specialists in Applying the Proce...Role of Knowledge among Yemeni Agricultural Specialists in Applying the Proce...
Role of Knowledge among Yemeni Agricultural Specialists in Applying the Proce...
 
Presentation at the 95th Governing Board meeting (Program Committee) By Resea...
Presentation at the 95th Governing Board meeting (Program Committee) By Resea...Presentation at the 95th Governing Board meeting (Program Committee) By Resea...
Presentation at the 95th Governing Board meeting (Program Committee) By Resea...
 
A study on real time plant disease diagonsis system
A study on real time plant disease diagonsis systemA study on real time plant disease diagonsis system
A study on real time plant disease diagonsis system
 
Informs 2017 ag session cgiar
Informs 2017 ag session cgiarInforms 2017 ag session cgiar
Informs 2017 ag session cgiar
 
Towards Indian Agricultural Information: A Need Based Information Flow Model
Towards Indian Agricultural Information: A Need Based Information Flow ModelTowards Indian Agricultural Information: A Need Based Information Flow Model
Towards Indian Agricultural Information: A Need Based Information Flow Model
 
106951 291159-1-pb
106951 291159-1-pb106951 291159-1-pb
106951 291159-1-pb
 

More from Mahesh Kadam

Output based agro based
Output based agro basedOutput based agro based
Output based agro basedMahesh Kadam
 
Marketing strategy of coca cola
Marketing strategy of  coca colaMarketing strategy of  coca cola
Marketing strategy of coca colaMahesh Kadam
 
Assigment on rural banking and infrastructure
Assigment on rural banking and infrastructureAssigment on rural banking and infrastructure
Assigment on rural banking and infrastructureMahesh Kadam
 
Agribusiness firm global agriculture rural advisories
Agribusiness firm global agriculture rural advisoriesAgribusiness firm global agriculture rural advisories
Agribusiness firm global agriculture rural advisoriesMahesh Kadam
 
Agribusiness firms coffee
Agribusiness firms coffeeAgribusiness firms coffee
Agribusiness firms coffeeMahesh Kadam
 
Agribusiness firm global agriculture rural advisories
Agribusiness firm global agriculture rural advisoriesAgribusiness firm global agriculture rural advisories
Agribusiness firm global agriculture rural advisoriesMahesh Kadam
 
Agribusiness dairy milk cadbury
Agribusiness dairy milk cadburyAgribusiness dairy milk cadbury
Agribusiness dairy milk cadburyMahesh Kadam
 
Devnadi basin_NASHIK_IMPACT AND ASSESSMENT-technical &amp; financial proposal
Devnadi basin_NASHIK_IMPACT AND ASSESSMENT-technical &amp; financial proposalDevnadi basin_NASHIK_IMPACT AND ASSESSMENT-technical &amp; financial proposal
Devnadi basin_NASHIK_IMPACT AND ASSESSMENT-technical &amp; financial proposalMahesh Kadam
 
Agribusiness parle
Agribusiness parleAgribusiness parle
Agribusiness parleMahesh Kadam
 
Agribusiness pepsi
Agribusiness pepsiAgribusiness pepsi
Agribusiness pepsiMahesh Kadam
 
Agribusiness monsanto
Agribusiness monsantoAgribusiness monsanto
Agribusiness monsantoMahesh Kadam
 
Agribusiness firm appy fizzz
Agribusiness firm appy fizzzAgribusiness firm appy fizzz
Agribusiness firm appy fizzzMahesh Kadam
 
Agribusiness firm mother dairy
Agribusiness firm mother dairyAgribusiness firm mother dairy
Agribusiness firm mother dairyMahesh Kadam
 
Agribusiness Firm_Amul the Taste of india
Agribusiness Firm_Amul  the Taste of indiaAgribusiness Firm_Amul  the Taste of india
Agribusiness Firm_Amul the Taste of indiaMahesh Kadam
 
Agribuisness Management
Agribuisness ManagementAgribuisness Management
Agribuisness ManagementMahesh Kadam
 
Economics experimental learning modules
Economics experimental  learning modulesEconomics experimental  learning modules
Economics experimental learning modulesMahesh Kadam
 
Nationalised of social banks
Nationalised of social banksNationalised of social banks
Nationalised of social banksMahesh Kadam
 

More from Mahesh Kadam (20)

Output based agro based
Output based agro basedOutput based agro based
Output based agro based
 
Marketing strategy of coca cola
Marketing strategy of  coca colaMarketing strategy of  coca cola
Marketing strategy of coca cola
 
Assigment on rural banking and infrastructure
Assigment on rural banking and infrastructureAssigment on rural banking and infrastructure
Assigment on rural banking and infrastructure
 
Agribusiness firm global agriculture rural advisories
Agribusiness firm global agriculture rural advisoriesAgribusiness firm global agriculture rural advisories
Agribusiness firm global agriculture rural advisories
 
Agribusiness firms coffee
Agribusiness firms coffeeAgribusiness firms coffee
Agribusiness firms coffee
 
Agribusiness firm global agriculture rural advisories
Agribusiness firm global agriculture rural advisoriesAgribusiness firm global agriculture rural advisories
Agribusiness firm global agriculture rural advisories
 
Agribusiness dairy milk cadbury
Agribusiness dairy milk cadburyAgribusiness dairy milk cadbury
Agribusiness dairy milk cadbury
 
Agribusiness amul
Agribusiness amulAgribusiness amul
Agribusiness amul
 
Devnadi basin_NASHIK_IMPACT AND ASSESSMENT-technical &amp; financial proposal
Devnadi basin_NASHIK_IMPACT AND ASSESSMENT-technical &amp; financial proposalDevnadi basin_NASHIK_IMPACT AND ASSESSMENT-technical &amp; financial proposal
Devnadi basin_NASHIK_IMPACT AND ASSESSMENT-technical &amp; financial proposal
 
Agribusiness parle
Agribusiness parleAgribusiness parle
Agribusiness parle
 
Agribusiness pepsi
Agribusiness pepsiAgribusiness pepsi
Agribusiness pepsi
 
Agribusiness monsanto
Agribusiness monsantoAgribusiness monsanto
Agribusiness monsanto
 
Agribusiness firm appy fizzz
Agribusiness firm appy fizzzAgribusiness firm appy fizzz
Agribusiness firm appy fizzz
 
Agribusiness firm mother dairy
Agribusiness firm mother dairyAgribusiness firm mother dairy
Agribusiness firm mother dairy
 
Agribusiness Firm_Amul the Taste of india
Agribusiness Firm_Amul  the Taste of indiaAgribusiness Firm_Amul  the Taste of india
Agribusiness Firm_Amul the Taste of india
 
Economics int.1
Economics int.1Economics int.1
Economics int.1
 
Taxes
TaxesTaxes
Taxes
 
Agribuisness Management
Agribuisness ManagementAgribuisness Management
Agribuisness Management
 
Economics experimental learning modules
Economics experimental  learning modulesEconomics experimental  learning modules
Economics experimental learning modules
 
Nationalised of social banks
Nationalised of social banksNationalised of social banks
Nationalised of social banks
 

Recently uploaded

What is 3 Way Matching Process in Odoo 17.pptx
What is 3 Way Matching Process in Odoo 17.pptxWhat is 3 Way Matching Process in Odoo 17.pptx
What is 3 Way Matching Process in Odoo 17.pptxCeline George
 
On National Teacher Day, meet the 2024-25 Kenan Fellows
On National Teacher Day, meet the 2024-25 Kenan FellowsOn National Teacher Day, meet the 2024-25 Kenan Fellows
On National Teacher Day, meet the 2024-25 Kenan FellowsMebane Rash
 
Economic Importance Of Fungi In Food Additives
Economic Importance Of Fungi In Food AdditivesEconomic Importance Of Fungi In Food Additives
Economic Importance Of Fungi In Food AdditivesSHIVANANDaRV
 
Accessible Digital Futures project (20/03/2024)
Accessible Digital Futures project (20/03/2024)Accessible Digital Futures project (20/03/2024)
Accessible Digital Futures project (20/03/2024)Jisc
 
Model Attribute _rec_name in the Odoo 17
Model Attribute _rec_name in the Odoo 17Model Attribute _rec_name in the Odoo 17
Model Attribute _rec_name in the Odoo 17Celine George
 
Beyond_Borders_Understanding_Anime_and_Manga_Fandom_A_Comprehensive_Audience_...
Beyond_Borders_Understanding_Anime_and_Manga_Fandom_A_Comprehensive_Audience_...Beyond_Borders_Understanding_Anime_and_Manga_Fandom_A_Comprehensive_Audience_...
Beyond_Borders_Understanding_Anime_and_Manga_Fandom_A_Comprehensive_Audience_...Pooja Bhuva
 
Details on CBSE Compartment Exam.pptx1111
Details on CBSE Compartment Exam.pptx1111Details on CBSE Compartment Exam.pptx1111
Details on CBSE Compartment Exam.pptx1111GangaMaiya1
 
Play hard learn harder: The Serious Business of Play
Play hard learn harder:  The Serious Business of PlayPlay hard learn harder:  The Serious Business of Play
Play hard learn harder: The Serious Business of PlayPooky Knightsmith
 
How to Add New Custom Addons Path in Odoo 17
How to Add New Custom Addons Path in Odoo 17How to Add New Custom Addons Path in Odoo 17
How to Add New Custom Addons Path in Odoo 17Celine George
 
80 ĐỀ THI THỬ TUYỂN SINH TIẾNG ANH VÀO 10 SỞ GD – ĐT THÀNH PHỐ HỒ CHÍ MINH NĂ...
80 ĐỀ THI THỬ TUYỂN SINH TIẾNG ANH VÀO 10 SỞ GD – ĐT THÀNH PHỐ HỒ CHÍ MINH NĂ...80 ĐỀ THI THỬ TUYỂN SINH TIẾNG ANH VÀO 10 SỞ GD – ĐT THÀNH PHỐ HỒ CHÍ MINH NĂ...
80 ĐỀ THI THỬ TUYỂN SINH TIẾNG ANH VÀO 10 SỞ GD – ĐT THÀNH PHỐ HỒ CHÍ MINH NĂ...Nguyen Thanh Tu Collection
 
Transparency, Recognition and the role of eSealing - Ildiko Mazar and Koen No...
Transparency, Recognition and the role of eSealing - Ildiko Mazar and Koen No...Transparency, Recognition and the role of eSealing - Ildiko Mazar and Koen No...
Transparency, Recognition and the role of eSealing - Ildiko Mazar and Koen No...EADTU
 
UGC NET Paper 1 Unit 7 DATA INTERPRETATION.pdf
UGC NET Paper 1 Unit 7 DATA INTERPRETATION.pdfUGC NET Paper 1 Unit 7 DATA INTERPRETATION.pdf
UGC NET Paper 1 Unit 7 DATA INTERPRETATION.pdfNirmal Dwivedi
 
Interdisciplinary_Insights_Data_Collection_Methods.pptx
Interdisciplinary_Insights_Data_Collection_Methods.pptxInterdisciplinary_Insights_Data_Collection_Methods.pptx
Interdisciplinary_Insights_Data_Collection_Methods.pptxPooja Bhuva
 
Spellings Wk 4 and Wk 5 for Grade 4 at CAPS
Spellings Wk 4 and Wk 5 for Grade 4 at CAPSSpellings Wk 4 and Wk 5 for Grade 4 at CAPS
Spellings Wk 4 and Wk 5 for Grade 4 at CAPSAnaAcapella
 
NO1 Top Black Magic Specialist In Lahore Black magic In Pakistan Kala Ilam Ex...
NO1 Top Black Magic Specialist In Lahore Black magic In Pakistan Kala Ilam Ex...NO1 Top Black Magic Specialist In Lahore Black magic In Pakistan Kala Ilam Ex...
NO1 Top Black Magic Specialist In Lahore Black magic In Pakistan Kala Ilam Ex...Amil baba
 
QUATER-1-PE-HEALTH-LC2- this is just a sample of unpacked lesson
QUATER-1-PE-HEALTH-LC2- this is just a sample of unpacked lessonQUATER-1-PE-HEALTH-LC2- this is just a sample of unpacked lesson
QUATER-1-PE-HEALTH-LC2- this is just a sample of unpacked lessonhttgc7rh9c
 
Tatlong Kwento ni Lola basyang-1.pdf arts
Tatlong Kwento ni Lola basyang-1.pdf artsTatlong Kwento ni Lola basyang-1.pdf arts
Tatlong Kwento ni Lola basyang-1.pdf artsNbelano25
 
Wellbeing inclusion and digital dystopias.pptx
Wellbeing inclusion and digital dystopias.pptxWellbeing inclusion and digital dystopias.pptx
Wellbeing inclusion and digital dystopias.pptxJisc
 

Recently uploaded (20)

What is 3 Way Matching Process in Odoo 17.pptx
What is 3 Way Matching Process in Odoo 17.pptxWhat is 3 Way Matching Process in Odoo 17.pptx
What is 3 Way Matching Process in Odoo 17.pptx
 
On National Teacher Day, meet the 2024-25 Kenan Fellows
On National Teacher Day, meet the 2024-25 Kenan FellowsOn National Teacher Day, meet the 2024-25 Kenan Fellows
On National Teacher Day, meet the 2024-25 Kenan Fellows
 
Economic Importance Of Fungi In Food Additives
Economic Importance Of Fungi In Food AdditivesEconomic Importance Of Fungi In Food Additives
Economic Importance Of Fungi In Food Additives
 
Accessible Digital Futures project (20/03/2024)
Accessible Digital Futures project (20/03/2024)Accessible Digital Futures project (20/03/2024)
Accessible Digital Futures project (20/03/2024)
 
Model Attribute _rec_name in the Odoo 17
Model Attribute _rec_name in the Odoo 17Model Attribute _rec_name in the Odoo 17
Model Attribute _rec_name in the Odoo 17
 
Beyond_Borders_Understanding_Anime_and_Manga_Fandom_A_Comprehensive_Audience_...
Beyond_Borders_Understanding_Anime_and_Manga_Fandom_A_Comprehensive_Audience_...Beyond_Borders_Understanding_Anime_and_Manga_Fandom_A_Comprehensive_Audience_...
Beyond_Borders_Understanding_Anime_and_Manga_Fandom_A_Comprehensive_Audience_...
 
Details on CBSE Compartment Exam.pptx1111
Details on CBSE Compartment Exam.pptx1111Details on CBSE Compartment Exam.pptx1111
Details on CBSE Compartment Exam.pptx1111
 
Play hard learn harder: The Serious Business of Play
Play hard learn harder:  The Serious Business of PlayPlay hard learn harder:  The Serious Business of Play
Play hard learn harder: The Serious Business of Play
 
How to Add New Custom Addons Path in Odoo 17
How to Add New Custom Addons Path in Odoo 17How to Add New Custom Addons Path in Odoo 17
How to Add New Custom Addons Path in Odoo 17
 
80 ĐỀ THI THỬ TUYỂN SINH TIẾNG ANH VÀO 10 SỞ GD – ĐT THÀNH PHỐ HỒ CHÍ MINH NĂ...
80 ĐỀ THI THỬ TUYỂN SINH TIẾNG ANH VÀO 10 SỞ GD – ĐT THÀNH PHỐ HỒ CHÍ MINH NĂ...80 ĐỀ THI THỬ TUYỂN SINH TIẾNG ANH VÀO 10 SỞ GD – ĐT THÀNH PHỐ HỒ CHÍ MINH NĂ...
80 ĐỀ THI THỬ TUYỂN SINH TIẾNG ANH VÀO 10 SỞ GD – ĐT THÀNH PHỐ HỒ CHÍ MINH NĂ...
 
Our Environment Class 10 Science Notes pdf
Our Environment Class 10 Science Notes pdfOur Environment Class 10 Science Notes pdf
Our Environment Class 10 Science Notes pdf
 
Transparency, Recognition and the role of eSealing - Ildiko Mazar and Koen No...
Transparency, Recognition and the role of eSealing - Ildiko Mazar and Koen No...Transparency, Recognition and the role of eSealing - Ildiko Mazar and Koen No...
Transparency, Recognition and the role of eSealing - Ildiko Mazar and Koen No...
 
UGC NET Paper 1 Unit 7 DATA INTERPRETATION.pdf
UGC NET Paper 1 Unit 7 DATA INTERPRETATION.pdfUGC NET Paper 1 Unit 7 DATA INTERPRETATION.pdf
UGC NET Paper 1 Unit 7 DATA INTERPRETATION.pdf
 
Interdisciplinary_Insights_Data_Collection_Methods.pptx
Interdisciplinary_Insights_Data_Collection_Methods.pptxInterdisciplinary_Insights_Data_Collection_Methods.pptx
Interdisciplinary_Insights_Data_Collection_Methods.pptx
 
Spellings Wk 4 and Wk 5 for Grade 4 at CAPS
Spellings Wk 4 and Wk 5 for Grade 4 at CAPSSpellings Wk 4 and Wk 5 for Grade 4 at CAPS
Spellings Wk 4 and Wk 5 for Grade 4 at CAPS
 
NO1 Top Black Magic Specialist In Lahore Black magic In Pakistan Kala Ilam Ex...
NO1 Top Black Magic Specialist In Lahore Black magic In Pakistan Kala Ilam Ex...NO1 Top Black Magic Specialist In Lahore Black magic In Pakistan Kala Ilam Ex...
NO1 Top Black Magic Specialist In Lahore Black magic In Pakistan Kala Ilam Ex...
 
QUATER-1-PE-HEALTH-LC2- this is just a sample of unpacked lesson
QUATER-1-PE-HEALTH-LC2- this is just a sample of unpacked lessonQUATER-1-PE-HEALTH-LC2- this is just a sample of unpacked lesson
QUATER-1-PE-HEALTH-LC2- this is just a sample of unpacked lesson
 
Tatlong Kwento ni Lola basyang-1.pdf arts
Tatlong Kwento ni Lola basyang-1.pdf artsTatlong Kwento ni Lola basyang-1.pdf arts
Tatlong Kwento ni Lola basyang-1.pdf arts
 
OS-operating systems- ch05 (CPU Scheduling) ...
OS-operating systems- ch05 (CPU Scheduling) ...OS-operating systems- ch05 (CPU Scheduling) ...
OS-operating systems- ch05 (CPU Scheduling) ...
 
Wellbeing inclusion and digital dystopias.pptx
Wellbeing inclusion and digital dystopias.pptxWellbeing inclusion and digital dystopias.pptx
Wellbeing inclusion and digital dystopias.pptx
 

Research proposal amity university

  • 1. 1 | P a g e Government of India Ministry of Agriculture & Farmers’ Welfare Department of Agriculture, Cooperation & Farmers’ Welfare Mahalanobis National Crop Forecast Centre Near Krishi Vistar Sadan Pusa Campus, New Delhi-110012 Invitation for Expression of Interest for GP (Gram Panchayat) level Crop Yield Estimation Using Technology File No. 6/7(2)/PMFBY/2017-MNCFC (May 2019)
  • 2. 2 | P a g e i. Introduction Crop yield monitoring and estimation have proved to be of vital importance for planning and for taking various policy decisions. The early prediction or forecasting of crop yield well before harvest is crucial especially in regions characterized by climatic uncertainties. This enables planners and policy makers to determine the amount of crop insurance to be paid to farmers in case of famine or a natural calamity. It also enables decision makers to predict how much to import in case of shortfalls or export in case of surplus. Remote sensing has proved to be one of the important technologies for the agricultural sector, as it is one of the backbones for precise agricultural resource mapping and monitoring. The availability of satellite borne multispectral, multi- resolution and multi-temporal data play an important role in crop management; their ability to represent crop growth and yield estimation on the spatial and temporal scale is remarkable. Precision agriculture (PA) is the application of geospatial techniques and remote sensors to identify variations in the field and to deal with them using alternative strategies. Precision agriculture is a way of addressing production variability and optimising management decisions. Precision agriculture accounts for production variability and uncertainties, optimises resource use and protects the environment (Gebbers and Adamchuk, 2010; Mulla, 2013).By definition, a complete precision agriculture system consists of four aspects: ■ Field variability sensing and information extraction, ■ Decision making, ■ Precision field control, and ■ Operation and result assessment (Yao et al., 2011). Precision agriculture adapts management practices within an agricultural field, according to variability in site conditions (Seelan et al., 2003). Variability is well known to exist within many of agricultural fields. The causes of variability of crop growth in an agricultural field might be due to tillage operations, influence of natural soil fertility and physical structure, topography, crop stress, irrigation practices, incidence of pest and disease etc. Effective management of the crop variability within the field can enhance financial returns, by improving yields and farm production and reducing cost of production. Various inputs to the farm such as fertilizers, irrigation, pesticides, seeding, etc. can be adjusted and applied precisely according to the variability in soil properties and crop growth (Atherton et al., 1999). Aerial images have been widely used for crop yield prediction before harvest. These images can provide high spatial cloud free information of the crop’s spectral characteristics. Analysis of vegetation and detection of changes in vegetation patterns are important for natural resource management and monitoring, such as crop vigour analysis. Healthy crops are characterized by strong absorption of red energy and strong reflectance of NIR energy. The strong contrast of absorption and scattering of the red and near-infrared bands can be combined into different
  • 3. 3 | P a g e quantitative indices of vegetation conditions. The potential application of aerial images is limitless in agriculture; some of them are as under: ■ Identifying and monitoring the spread of crop destroying weeds/pests ■ Monitoring the crop health ■ Nitrogen content mapping, soil brightness mapping ■ Crop cover, Biomass estimation, yield prediction. Biophysical parameters such as plant height and biomass are monitored to describe crop growth and serve as an indicator for the final crop yield. Multi-temporal Crop Surface Models (CSMs) provide spatial information on plant height and plant growth. ii. About the Organisation Name of the Organization Amity University Uttar Pradesh , Noida Location of the Principal Office Sector- 125, Gautam Buddha Nagar, Noida - 201 313 (India) Telephone: 0120-4392359 Fax: 0120-2431870 Email: nkaushik5@amity.edu Website: www.amity.edu Date of Establishment 24 March, 2005 Copy of Gazzette Notification No. 404/VII-V-1-1(Ka)-1/2005 Dated Lucknow,March 24,2005. PAN Card No. : AAATR7314Q GST No. : 09AAATR7314Q1ZW Professional strength No. of full time manpower available: 4200 plus (a) Agriculture & Allied: 80 (b) Other Sector: 4100 plus Financial capacity of Amity University 2017-18: 953.72 Crores 2016-17: INR 844.75 Crores. 2015-16 : INR 717.37 Crores.
  • 4. 4 | P a g e Institutes and Centres at AAUP: Various institutes and centers at Amity University which are performing academic and research activities in food, agriculture and allied sciences. Some of them are listed below: 1. Amity Institute of Organic Agriculture 2. Amity Institute of Horticulture Studies & Research 3. Amity International Centre for Post Harvest Technology & Cold Chain Management 4. Centre for Agricultural Biotechnology 5. Amity Centre for Extension Services 6. Amity Centre for Bio Control & Plant Disease Management 7. Amity Institute for Herbal Research and Studies 8. Amity Institute of Phytochemistry & Phytomedicine 9. Amity Institute of Food Security Management 10. Amity Institute of Food Technology 11. Amity Institute of Biotechnology 12. Amity Institute of Microbial Biotechnology 13. Amity Institute of Microbial Technology 14. Amity Institute of Seabuckthorn Research 15. Amity Centre for Carbohydrate Research 16. Centre for Plant Cell Culture Technology 17. Amity Institute of Marine Science & Technology 18. Amity Institute of Environmental Toxicology, Safety and Management 19. Amity Institute of Environmental Sciences 20. Amity School of Natural Resources and Sustainable Development 21. Amity Institute of Geo-Informatics and Remote-Sensing 22. Amity Institute of Global Warming and Ecological Studies 23. Amity Institute of Water Technology and Educating Youth for Sustainable Development Details of Project Coordinator Name: DR.NUTAN KAUSHIK Designation: Director General, Amity Food and Agriculture Foundation Amity University Uttar Pradesh was established under RBEF vide The Amity University Uttar Pradesh Act, 2005 (U.P. Act No.11 of 2005) in the State of Uttar Pradesh through state legislature. The University has a rich resource of expertise in the field of social sciences, economics, political science, agriculture, microbiology, biotechnology, anthropology, natural resources, Organic Agriculture, Plan Protection, environment, education, psychology, Finance
  • 5. 5 | P a g e Experts, Management Experts, Legal Experts, travel, Tourism and Hospitality experts etc. Amity also has in-house training department which on the continuous basis is running trainings and workshops from various government banks, other institutions, and other Central as well as State Government Departments. Description of Institutes There are a number of institutes at AUUP but for the said project we have chosen a few. 1. Amity Institute of Organic Agriculture: Amity Institute of Organic Agriculture (AIOA) is an unique Institute, the first of its kind in the country and among the few in the world. Amity University known for academic excellence, quality research, international linkages and strong industry interface. Visualizing the need for sustainable food security and food safety management systems, the Institute consistently has set standards for excellence towards human resource development in long-term sustainable agricultural technologies manifested in the most viable option of Organic Agriculture in contrast with the chemical-intensive conventional agriculture integrated and strongly supported with a comprehensive and multifaceted management focused education. The Institute has also a mandate in carrying out basic and applied research in organic production management systems, an innovative farmer’s knowledge management apart from training, advisory, and consultancy services. Institution is working on continuous development of the society and has also implemented various projects. 2. Amity Institute of Geo-Informatics and Remote Sensin, Noida Amity Institute of Geo-Informatics and Remote Sensing (AIGIRS) is an interdisciplinary center, established as a part of Amity University Uttar Pradesh, NOIDA. These Programmes in Geoinformatics combines technical, mathematical, computational and visual knowledge and offers the students the possibility to not only use geoinformatics technology but also develop and create new computational methods and applications. In addition to gaining an overall perspective, students can further focus their skills on one of the subjects within geoinformatics, such as geodesy, photogrammetry, laser scanning, remote sensing, geographic information technologies or cartography. The programs have a long tradition as a technically and mathematically oriented curriculum. This is why, for example, programming skills, basic courses in mathematics and statistics as well as an interest in GeoIT are required. The programme provides both theoretical and practical skills, and develops academic capabilities, problem-solving skills and analytical thinking, just to name a few. Teaching is tightly connected to ongoing cutting-edge research. The Institute conducts interdisciplinary research in the following areas of Remote Sensing & GIS Applications:  Groundwater Resource Management  Groundwater Modeling
  • 6. 6 | P a g e  Watershed management and Modeling  Geophysics based Groundwater Survey  Groundwater Pollution and Prediction Modeling  GIS based decision support System for Solid Waste Management  River dynamics and Mapping  Web GIS based application in Resource Mapping  Geological / Mineralogical Studies  Urban Planning and Management  Glaciology  Landscape Evaluation  Flood Mapping and Monitoring  Drought Mapping and Monitoring  Climate Change Studies 3. Amity Institute of Information technology (AIIT), Noida Amity Institute of Information technology (AIIT), Noida, integral part of Amity University Uttar Pradesh, is a centre of excellence for quality education in Information Technology with special focus on emerging trends. AIIT is a CISCO Regional Networking Academy since March 2001, now known as CISCO Instruction Training Center (ITC) and Network Academy. AIIT is providing this course as a Value Addition Course to external students as well as the students of MCA, M.Sc.(NT&M), Ph.D(IT), BCA, B.Sc. (IT), BCA+MCA (dual) and BCA (Evening). AIIT also has a tie-up with CISCO and Intersystems Pvt. Ltd. and it is the first Institute in India to offer InterSystems CacheCampus Program to foster knowledge about Cache among the student community. Amity University has collaboration with EMC2, Sun MicroSystems, Oracle , SAP, Infosys, etc. Being a part of the University, the students of AIIT have the opportunity to avail access to the courses offered by these organizations. iii. List of Technical persons with their qualification. Seri al No. Name Qualification Expertise Experience 1. Dr. Nutan Kaushik, Ph.D. Agriculture 28 years 2. Dr. Neelani Ramawat Ph.D. Agronomy 18 years 3. Dr. Renu Yadav Ph.D. Botany 12 years 4. Dr. Prafull Singh Ph.D. Remote Sensing 10 years 5. Dr. Neel Mani Ph.D. Machine Learning 12 years 6. Dr. Mahesh M. Kadam Ph.D. Agril. Economics 6 years 7. Dr. Rachna Rana Ph.D. Agronomy 02 years 8. Dr. Saurabh Agarwal M.Tech, Ph.D. Machine Learning 12 years 9. Dr. Vandana Bhatia M.Tech, Ph.D. Machine Learning 02 years 10. Dr. Deepak Sharma M.Tech,Ph.D. Machine Learning 10 years
  • 7. 7 | P a g e iv. Details of the previous study carried out: Name of the Study Efficient Pattern Mining of Big Data using Graphs (Dr. Vandana Bhatia) Geographical location Not Applicable Description Big data has great amount of hidden knowledge and many insights which have raised remarkable challenges in knowledge discovery and data mining. For certain types of data, the relationships among the entities is of much more importance than the information itself. Big data has many such connections which can be mined efficiently using graphs. However, it is very challenging to obtain ample profits from this complex data. To overcome these challenges, graph mining approaches such as clustering and subgraph mining are used. In recent times, these approaches have become an indispensable tool for analyzing graphs in various domains. The research work undertaken in the field of pattern mining approaches for large graphs. The main objective of this research is to investigate the benefits of using scalable approaches for mining large graphs. Two fuzzy clustering algorithms namely “PGFC” and “PFCA” are proposed for large graphs using different concepts of graph analysis. Furthermore, a scalable deep learning based fuzzy clustering model named “DFuzzy” is proposed that leverages the idea from stacked autoencoder pipelines to identify overlapping and non-overlapping clusters in large graphs efficiently. Our proposed clustering approaches are proved to be effective for small and large graph dataset, and generate high quality clusters. For mining frequent subgraphs, a scalable frequent subgraph mining algorithm named “PaGro” is proposed for a single large graph using pattern-growth based approach. In PaGro, a two-step hybrid approach is developed for optimization of subgraph isomorphism and subgraph pruning task at both local and global levels to avoid the excess communication overhead. Additionally, an approximate frequent subgraph mining algorithm named “Ap-FSM” is proposed which exploits PaGro using sampling for faster processing. The results of PaGro and Ap-FSM show that both outperform the competent algorithms in various aspects of processing Time, no. of iterations and memory overhead. It is suggested that the utilization of graph clustering and frequent subgraph mining generate discriminate and significant patterns, which can help in many tasks such as classification and indexing of big data. The proposed algorithms can be used in many applications like Social networks, Biological networks, etc. The work can also be used for finding similar patterns in business and agriculture.
  • 8. 8 | P a g e Name of the Study (Dr. Praful Singh) Application of Thermal Imaging and Hyperspectral Remote Sensing for Crop Water Deficit Stress Monitoring Geographical location Not applicable Description Water deficit in crops induces a stress that may ultimately result in low production. Identification of response of genotypes towards water deficit stress is very crucial for plant phenotyping. The study was carried out with the objective to identify the response of different rice genotypes to water deficit stress. Ten rice genotypes were grown each under water deficit stress and well watered or non-stress conditions. Thermal images coupled with visible images were recorded to quantify the stress and response of genotypes towards stress, and relative water content (RWC) synchronized with image acquisition was also measured in the lab for rice leaves. Synced with thermal imaging, Canopy reflectance spectra from same genotype fields were also recorded. For quantification of water deficit stress, Crop Water Stress Index (CWSI) was computed and its mode values were extracted from processed thermal imageries. It was ascertained from observations that APO and Pusa Sugandha-5 genotypes exhibited the highest resistance to the water deficit stress or drought whereas CR-143, MTU-1010 and Pusa Basmati-1 genotypes ascertained the highest sensitiveness to the drought. The study reveals that there is an effectual relationship (R² = 0.63) between RWC and CWSI. The relationship between canopy reflectance spectra and CWSI was also established through partial least square regression technique. A very efficient relationship (Calibration R²= 0.94 and Cross-Validation R²= 0.71) was ascertained and 10 most optimal wavebands related to water deficit stress were evoked from hyperspectral data resampled at 5nm wavelength gap. The identified ten most optimum wavebands can contribute in the quick detection of water deficit stress in crops. This study positively contributes towards the identification of drought tolerant and drought resistant genotypes of rice and may provide valuable input for the development of drought-tolerant rice genotypes in future. .
  • 9. 9 | P a g e Comparison of Various Modelling Approaches for Water Deficit Stress Monitoring in Rice Crop through Hyperspectral Remote Sensing. Agriculture Water Management This study was conducted to understand the behaviour of ten rice genotypes for different water deficit stress levels. The spectroscopic hyperspectral reflectance data in the range of 350–2500 nm was recorded and relative water content (RWC) of plants was measured at different stress levels. The optimal wavebands were identified through spectral indices, multivariate techniques and neural network technique, and prediction models were developed. The new water sensitive spectral indices were developed and existing water band spectral indices were also evaluated with respect to RWC. These indices based models were efficient in predicting RWC with R2 values ranging from 0.73 to 0.94. The contour plotting using the ratio spectral indices (RSI) and normalized difference spectral indices (NDSI) was done in all possible combinations within 350–2500 nm and their correlations with RWC were quantified to identify the best index. Spectral reflectance data was also used to develop partial least squares regression (PLSR) followed by multiple linear regression (MLR) and Artificial Neural Networks (ANN), support vector machine regression (SVR) and random forest (RF) models to calculate plant RWC. Among these multivariate models, PLSR-MLR was found to be the best model for prediction of RWC with R2 as 0.98 and 0.97 for calibration and validation respectively and Root mean square error of prediction (RMSEP) as 5.06. The results indicate that PLSR is a robust technique for identification of water deficit stress in the crop. Although the PLSR is robust technique, if PLSR extracted optimum wavebands are fed into MLR, the results are found to be improved significantly. The ANN model was developed with all spectral reflectance bands. The 43 developed model didn’t produce satisfactory results. Therefore, the model was developed 44 with PLSR selected optimum wavebands as independent x variables and PLSR-ANN model 45 was found better than the ANN model alone. The study successfully conducts a comparative 46 analysis among various modelling approaches to quantify water deficit stress. The methodology developed would help to identify water deficit stress more accurately by predicting RWC in the crops.
  • 10. 10 | P a g e Name of study Morphometric analysis of Morar River Basin, Madhya Pradesh, India, using remote sensing and GIS techniques Hydrogeological mapping and drainage analysis can form an important tool for groundwater development. Assessment of drainage and their relative parameters have been quantitatively carried out for the Morar River Basin, which has made positive scientific contribution for the local people of area for the sustainable water resource development and management. Geographical Information System has been used for the calculation and delineation of the morphometric characteristics of the basin. The dendritic type drainage network of the basin exhibits the homogeneity in texture and lack of structural control. The stream order ranges from first to sixth order. The drainage density in the area has been found to be low which indicates that the area possesses highly permeable soils and low relief. The bifurcation ratio varies from 2.00 to 5.50 and the elongation ratio (0.327) reveals that the basin belongs to the elongated shaped basin category. The results of this analysis would be useful in determining the effect of catchment characteristics such as size, shape, slope of the catchment and distribution of stream net work within the catchment. Name of study Monitoring spatial LULC changes and its growth prediction based on statistical models and earth observation datasets of Gautam Budh Nagar, Uttar Pradesh, India Description It is well known and witnessed the fact that in recent years the growth of urbanization and increasing urban population in the cities, particularly in developing countries, are the primary concern for urban planners and other environmental professionals. The present study deals with multi-temporal satellite data along with statistical models to map and monitor the LULC change patterns and prediction of urban expansion in the upcoming years for one of the important cities of Ganga alluvial Plain. With the help of our study, we also
  • 11. 11 | P a g e tried to portray the impact of urban sprawl on the natural environment. The long-term LULC and urban spatial change modelling was carried out using Landsat satellite data from 2001 to 2016. The assessment of the outcome showed that increase in urban built-up areas favoured a substantial decline in the agricultural land and rural built-up areas, from 2001 to 2016. Shannon’s entropy index was also used to measure the spatial growth patterns over the period of time in the study area based on the land-use change statistics. Prediction of the future land-use growth of the study area for 2019, 2022 and 2031 was carried out using artificial neural network method through Quantum GIS software. Results of the simulation model revealed that 14.7% of urban built-up areas will increase by 2019, 15.7% by 2022 and 18.68% by 2031. The observation received from the present study based on the long-term classification of satellite data, statistical methods and field survey indicates that the predicted LULC map of the area will be precious information for policy and decision-makers for sustainable urban development and natural resource management in the area for food and water security. Name of the Study (Dr. Renu Yadav) Physiological and Biochemical studies on the essentiality and toxicity of Nickle and cobalt on certain plant species Geographical location Udaipur , Rajasthan Description This thesis work entitled Title:” Physiological and Biochemical studies on the essentiality and toxicity of Nickle and cobalt on certain plant species” was carried at Udaipur district of Rajasthan. Experiments was conducted to evaluate response of Triticum aestivum L and Vigna sinensis L to the basal applications of nickel and cobalt. Significant increase in the growth was observed at 5 & 25 µg g-1 nickel and cobalt doses. Addition of metals above this level reduced the leaf area, plant growth, root length and yield of the plants. Fruiting stage showed more severe toxicity symptoms in comparison to the vegetative stages. Chlorophyll contents, protein contents and the nitrate reductase activity increased significantly at the lower nickel doses. Peroxidase and superoxide - dismutase activity increased in a concomitant manner by increasing the nickel concentrations. Accumulations of nickel and cobalt in different parts of the plants were studied. Increased concentrations of the soil applied nickel and cobalt demonstrated an increase in the content of metals in roots as well as shoots. The information obtained from this study should be useful for studying the essentiality and toxicity of Nickle and cobalt on certain plant species.
  • 12. 12 | P a g e Name of the study (Dr. Mahesh M. Kadam) Comparative Analysis of Public and Private Warehousing in Vidarbha region of Maharashtra It reveals from the study that the investment in land and building was a major share of total investments in both Maharashtra State Warehousing Corporation and Private Warehouses. The policies could be diverted towards investment on mechanizing the warehouses, whereby cost of maintenance could be reduced to a larger extent. The average occupancy of warehouses was found to be less than 40 per cent by different categories of users. The occupancy rate can be increased by providing the customers with good facilities and less procedural system in warehousing operation. The profile of commodities also could be diversified by providing special structures for storage for different type of commodities as demanded by the customers. The composition of user groups shows that the government sector occupying a larger section of the capacity utilization compared to other user groups. The operations of Maharashtra State Warehousing Corporation could be made more competitive through various measures and policies to attract diverse composition of user groups. It reveals from the study that generally the farmers do not get adequate space especially during the peak seasons, which may deny the farmers from utilizing the advantages of temporal price variations in agricultural commodities. The policies of the Maharashtra State Warehousing Corporation may focus to provide adequate space to farmers during the peak months of harvest by keeping a kind of reserved occupancy for the benefit of farmers at large.The development of optimum sized structures to suit the location looking to the season and crops grown. The warehouses may be managed to have a year round occupancy, thus achieving efficiency and reduction in the operational costs.
  • 13. 13 | P a g e Name of the Study (Dr.Naleeni Ramawat) Simulation, validation and application of CERES-Maize model for yield maximization of maize in North Western Himalayas Geographical location Palampur, Himachal Pradesh Description Maize (Zea mays L.) is one of the most important cereal crops of the world. Investigations were carried out for determination of genotypic coefficients of important varieties of maize by using CERES-Maize model in the Decision Support System for Agrotechnology Transfer (DSSAT v 3.5). The CERES-Maize model was evaluated with experimental data collected during two field experiments conducted in Palampur, India. Field experiments comprising of four dates of sowing (June 1, June 10, June 20 and June 30) and four varieties(KH 9451, KH 5991, early composite and local) of maize were conducted during Summer 2003 and 2004 in split plot design. Observations on development stages, dry matter accumulation at 15 days interval, yield attributes, yield (grains, stover and biological), nitrogen content and uptake were recorded. Genotypic coefficients of important varieties of maize were worked out. CERES-Maize model successfully simulated phenological stages, yield attributes (except single grain weight), yield and also N uptake with coefficient of variation (CV) nearly equal to 10 %. CERES-Maize model was validated with fair degree of accuracy. Simulation guided management practices were worked out under potential production and resource limiting situations. Best time of sowing of both hybrids (KH 9451, KH 5991) was worked out to be last week of April. While for early composite (EC), first week of May proved advantageous and for local variety second fortnight of April was the best time of sowing. The best schedule of N application was 60 kg ha-1 at sowing time and 30 kg ha-1 at knee high stage for all varieties except for local where it was 60 kg ha-1 at sowing and 30 kg ha-1 each at knee high and silking stages.
  • 14. 14 | P a g e Name of Study Name of study Methods of LeafArea for Stevia rebaudiana (Bert.) Bertoni Leaf area is a valuable index for evaluating growth and development of sweet herb Stevia [Stevia rebaudiana (Bert.) Bertoni]. A simple methodology was developed during 2006 to estimate the leaf area through Leaf Area Distribution Pattern (LADP) and regression equations. Plant height, leaf height as well as the length and breadth of all the measurable leaves were measured and their area was measured through Area meter (AM 300) for a six month old crop of Stevia. A leaf area coefficient of 0.548 was found to fit for the linear equation without intercept. LADP was prepared with relative leaf height and relative leaf area. Based on the adjusted second order polynomial equation of LADP, the relative leaf height of plants representing the mean leaf area was ascertained and a regression equation was obtained to calculate the total leaf area of the plant. The results were validated with 3, 4 and 5 months old crops as well as with another accession. Different combinations of prediction equations were obtained from length and breadth of all leaves and a simplest equation i.e, linear equation was used to predict the leaf area. A non-destructive methodology for estimating leaf area of Stevia based on linear measurement was developed in this study. SIMULATION AND VALIDATION OF CERES-MAIZE AND CERES- BARLEY MODELS Investigations were carried out for determination of genotypic co-efficients of important varieties of maize and barley, simulation and validation of CERES-Maize and CERES- Barley crop models for growth, yield and yield attributes, and working out simulation-guided management practices for yield maximization of both the crops. Field experiments comprising of four dates of sowing (June 1, June 10, June 20 and June 30) and four varieties (KH 9451, KH 5991, early composite and local) of maize and four dates of sowing (October 10, November 1, November 20 and December 10) and three varieties (Dolma, Sonu and HBL-113) of barley were conducted during Kharif 2002 to Rabi 2004-05 in split plot design. Observations on development stages, dry matter accumulation (leaves, stem and grains) at 15 days interval, yield attributes, yield (grains, stover/straw and biological), nitrogen content and uptake were recorded. Genotypic coefficients of important recommended varieties of maize and barley were worked out. CERES-Maize model successfully simulated phenological stages, yield attributes (except test weight), yield and also N uptake, but failed to simulate accurately dry matter accumulation in different plant parts at different growth periods. CERES-Barley model also successfully simulated phenological stages, yield attributes and grain yield, but failed to simulate straw yield, dry matter accumulation in different plant parts at different growth periods and N content and uptake. Both the models were validated with fair degree of accuracy. Simulation guided management practices were worked out under potential production and resource limiting situations. In case of maize, best time of sowing of both hybrids(KH 9451, KH 5991) was worked out to be last week of April. While for early composite, first week of May proved advantageous and for local second fortnight of April. The best schedule of N application was 60 kg /ha at sowing time and 30 kg/ha at knee high stage for all varieties except for local where it was 60 kg /ha at sowing and 30kg/ha at knee high stage and 30 kg/ha at silking. In case of barley, best time of sowing for Dolma and
  • 15. 15 | P a g e Sonu was last week of October to first week of November but for HBL-113 earlier sowing from 20th to 27th October were best. Best N schedule was 60 kg/ha at sowing time followed by 20 kg/ha top dressing at 30 DAS for Dolma and Sonu and 50 kg/ ha at sowing time and 50kg/ha as top dressing at 30DAS for HBL-113. Study Area (Dr. Rachna Rana) Effect of integrated nutrient management on productivity, profitability and seed quality in okra-pea cropping system The experiment was carried out at the Experimental Farm of Department of Seed Science and Technology, Chaudhary Sarwan Kumar Himachal Pradesh Krishi Vishvavidyalaya, Palampur during kharif, 2012 to rabi, 2013-14 to study the effect of integrated nutrient management on productivity, profitability and seed quality in okra-pea cropping system. Experiment consisted of seven integrated nitrogen treatments in okra viz; 25% nitrogen through FYM + 75% nitrogen through fertilizer; 25% nitrogen through fortified vermicompost + 75% nitrogen through fertilizer; 25% nitrogen through vermicompost + 75% nitrogen through fertilizer; 50% nitrogen through FYM + 50% nitrogen through fertilizer; 50% nitrogen through fortified vermicompost + 50% nitrogen through fertilizer; 50% nitrogen through vermicompost + 50% nitrogen through fertilizer and recommended dose of fertilizer. These seven treatments were tested in randomized block design with 3 replications in okra crop during kharif and three treatments viz; 50% RDF, 75% RDF and 100% RDF constituting 21 treatment combinations, following pea crop in rabi were evaluated in split plot design with 3 replications. Growth, yield attributes, seed yields of okra and pea increased significantly and consistently with combined application of 50% nitrogen through fortified vermicompost + 50% nitrogen through fertilizer as main effects in okra and residual effects in peas. Significantly, higher seed yield of okra (694.4 kg ha-1 and 745.4 kg ha-1) was obtained with the application of 50% nitrogen through fortified vermicompost + 50% nitrogen through fertilizer during both the years (2012 and 2013), respectively. Residual effect of 50% nitrogen applied through fortified vermicompost + 50% nitrogen through fertilizer applied in okra also resulted in significantly higher seed yield of peas (1550 kg ha-1 and 1584 kg ha-1) during both the years of experimentation. N, P, K uptake and available N, P, K was found significantly higher with the application of 50% N through fortified vermicompost + 50% N through fertilizer in both okra and pea crops. Further it was observed that application of 50% nitrogen through fortified vermicompost + 50% nitrogen through fertilizer resulted in significantly higher germination percentage, seedling length, seedling dry weight, field emergence, seedling vigour and lowest electrical conductivity in okra and pea seeds after harvest indicating better seed quality. Among direct effects (fertility levels), 100% RDF also resulted in increased growth, development, yield attributes, seed yield and quality of peas. The okra equivalent yield (1112 kg ha-1 annum-1), net returns (₹ 263853 ha-1 annum-1) and net returns per rupee invested (₹ 3.79) were recorded significantly higher with the application of 50% N through fortified vermicompost + 50% N through fertilizers in okra-pea cropping system.
  • 16. 16 | P a g e Name of the Study Designing Algorithms for Trends Analysis in Research Geographical location Netaji Subhas Institute of Technology, University of Delhi, Sector-3, Dwarka, New Delhi-110078 Description My research is mainly focussed on identifying Trends in Research. We have identified and analyse trends in Machine Learning Research. The name of Machine Learning firstly devised by Arthur Samuel, who was acknowledged for the checkers-playing program to improve game by game and studying which moves makeup winning strategies and incorporating those moves into the program. It is a subset of artificial intelligence area, and its methodology has unconventional in
  • 17. 17 | P a g e performance with the primary concerns of the field. The machine learning field has reincarnated many times in past and is known for its existence for many decades. For decades, there have always been challenges to researchers in artificial intelligence to build machines that can mimic the human intellect. The machine learning algorithms have motivated the researchers to empower a computer to autonomously drive cars, write and publish sport match reports, communicate with human beings and find the suspected terrorist. These algorithms are used unconventionally to obtain knowledge from the data. In machine learning, the computers don’t require to be explicitly programmed, but they can improve and change their algorithms by themselves. The machine learning systems automatically learn the program from data, which is a challenging task to make them manually. In the last couple of decades, the use of machine learning has spread rapidly in various disciplines. Therefore, the algorithms in machine learning field are also known as algorithm about algorithms. In particular, the popularity of machine learning motivates us to understand the research trends in this field since the existing machine learning techniques have been applied to large-scale data processing environments or have extended to various application areas such as fraud detection, the stock market, weather forecasting, etc. Also, the algorithms changed according to newly emerged technology. So understanding the machine learning research themes of the past five decades will help to study the current machine learning trends and applies it to practical applications. We have prepared a dataset of machine learning research articles from 1968~2017. In our thesis, we adopted various methodologies to analyze trend in machine learning research which are given below:  Trend Analysis in Machine Learning Research Using Text Mining.  A Trend Analysis of Machine Learning Research with Topic Models and Mann-Kendall Test.  Trend Analysis of Machine Learning Research Using Topic Network Analysis.  A Trend Analysis of Significant Topics over Time in Machine Learning Research.  Identify and Recommending Researchers in Machine Learning Based on Author-Topic Model.  Uncovering Research Trends and Topics of Communities in Machine Learning. List of Publications: 1. Sharma, Deepak, Kumar, Bijendra, & Chand, Satish (2018). A Trend Analysis of Machine Learning Research with Topic
  • 18. 18 | P a g e Models and Mann-Kendall Test. International Journal of Intelligent Systems and Applications(IJISA), Vol.11, No.2, pp.70-82, 2019. DOI: 10.5815/ijisa.2019.02.08 2. Kumar, Rajneesh, & Sharma, Deepak. A Survey on Sentiment Analysis of Speech. Journal on Multimodal User Interfaces. (May 2019)(Submitted) 3. Kumar, Manoj, Sharma, Deepak, Agarwal, Jyoti, Rani, Anuj, & Singh, Gurpreet. A DE-ANN Inspired Skin Cancer Detection Approach using Fuzzy C-Means Clustering. Journal of Digital Imaging. (May 2019)(Submitted) 4. Sharma, Deepak, Kumar, Bijendra, Chand, Satish, & Shah, Rajiv Ratn (2018). Research Topics over Time: A Trend Analysis using Topic Coherence Model with LDA. ACM Transactions on Data Science. (Nov 2018)(Submitted) 5. Sharma, Deepak, Kumar, Bijendra, Chand, Satish, & Shah, Rajiv Ratn (2018). Uncovering Research Trends and Topics of Communities in Machine Learning. ACM Transactions on Knowledge Discovery from Data. (Oct 2018) (Submitted) 6. Sharma, Deepak, Kumar, Bijendra, & Chand, Satish (2017). A Survey on Journey of Topic Modelling Techniques from SVD to Deep Learning. International Journal of Modern Education and Computer Science(IJMECS), Vol.9, No.7, pp.50-62, 2017. DOI: 10.5815/ijmecs.2017.07.06 7. Sharma, Deepak, Kumar, Bijendra, & Chand, Satish (2018). Trend Analysis in Machine Learning Research Using Text Mining. International Conference on Advances in Computing Communication Control and Networking (ICACCCN-2018) on 12th−13th October 2018. 8. Sharma, Deepak, Kumar, Bijendra, & Chand, Satish (2018). Trend Analysis of Machine Learning Research Using Topic Network Analysis. In: Panda B., Sharma S., Roy N. (eds) Data Science and Analytics. REDSET 2017. Communications in Computer and Information Science, vol 799. Springer, Singapore. 9. Singh, Yash Veer, Kumar, Bijendra, & Chand, Satish, Sharma, Deepak (2018). A Hybrid Approach for Requirements Prioritization Using Logarithmic Fuzzy Trapezoidal Approach (LFTA) and Artificial Neural Network (ANN). In International Conference on Futuristic Trends in Network and Communication Technologies (pp. 350-364). Springer, Singapore. 10. Sharma, Deepak, Kumar, Bijendra, & Chand, Satish (2017). Identify and Recommending Researchers in Machine Learning Based on Author-Topic Model. International Conference on Pattern Recognition (ICPR-2017) on 22nd − 23rd December 2017.
  • 19. 19 | P a g e Name of the Study Design & Analysis of Image Forensic Techniques Geographical location NSIT, University of Delhi, Delhi Description My research is mainly focussed on forensic analysis of digital images. Digital images directly or indirectly affect every aspect of human life like medical, traffic management, agriculture, journalism, etc. So credibility of digital content should be assured. There are many operations that can be performed on the images. Out of which some are for good purpose and some are for wrong purpose. Generally, image enhancement operations like contrast enhancement, histogram equalization, etc. are performed to enhance the image visual quality. These operations are harmless. However, investigation of these operations
  • 20. 20 | P a g e helpful in image forensic analysis. Fake images are created with wrong intentions using one or more pristine images. The editing softwares are so precise that tampering cannot be detected easily. There have been discussed many methods for image forgery detection. They have their own limitations as most method relies on: hardware (camera) dependent image parameters, images lighting conditions, and image compression, etc. The image forgery detection techniques can be divided to the following two categories: active and passive (blind). In active forgery detection techniques authentication is achieved via analysis of some predefined content- like digital watermark or signature. In case of passive forgery detection, no prior knowledge about the images is made available for authentication. Image forgery can be detected using camera artifacts, compression artifacts, lighting/illumination disturbance, internal statistical properties, etc. Most of these methods directly or indirectly based on internal statistical features of the image and can classify pristine and fake images. This classification broadly comes in to the category of machine learning. I have also applied techniques for image segmentation. Publications in International Journals: 1. Saurabh Agarwal and Satish Chand, “A Content-Adaptive Median Filtering Detection Using Markov Transition Probability Matrix of Pixel Intensity Residuals,” Journal of Applied Security Research, Taylor & Francis (Accepted) 2. Saurabh Agarwal and Satish Chand, “Blind Forensics of Images Using Higher OrderLocal Binary Pattern,” Journal of Applied Security Research, Taylor & Francis, vol. 13(2), January 2018, pp. 209-222 3. Saurabh Agarwal, Satish Chand and S. Nikolay, “SPAM Revisited for Median Filtering Detection Using Higher-Order Difference,” Security and communication networks, Wiley publications, vol. 9(17), November, 2016, pp. 4089-4102 4. Saurabh Agarwal and Satish Chand, “Anti-forensics of JPEG images using interpolation,” International journal of image, graphics and signal processing, vol. 7(12), November, 2015, pp. 10-17. 5. Saurabh Agarwal and Satish Chand, “Image forgery detection using multi scale entropy filter and local phase quantization,” International journal of image, graphics and signal processing, vol. 7(10), September 2015, pp. 78-85. Publications in International Conferences: 1. Saurabh Agarwal and Satish Chand, “Median filtering detection using Markov Process in Digital Images,” International conference on Biomedical Engineering Science & Technology, NIT, Raipur, 20-21 December, 2019 (Accepted)
  • 21. 21 | P a g e 2. Saurabh Agarwal and Satish Chand, “Image Forgery Detection Using Co-occurrence Based Texture Operator in Frequency Domain,” 4th ICACNI, Advances in Intelligent Systems and Computing series Springer, 22-24 September, 2016 3. Saurabh Agarwal and Satish Chand, “Image Forgery Detection Using Markov Features in Undecimated Wavelet Transform,” Ninth International Conference on Contemporary Computing, JP, Noida, 11- 13 August, 2016, pp. 178-183. 4. Saurabh Agarwal and Satish Chand, “Image Tampering Detection using Local Phase based Operator,” International Conference on Emerging Trends in Electrical, Electronics & Sustainable Energy Systems, KNIT, Sultanpur, 11-12 March, 2016, pp. 355-360. 5. Saurabh Agarwal and Satish Chand, “Texture operator based image splicing detection hybrid technique,” International Conference on Computational Intelligence & Communication Technology (CICT), ABES, Ghaziabad, 12-13 February, 2016, pp. 116-120. 6. Saurabh Agarwal and Satish Chand, “Image Forgery Detection using Texture Descriptors,” International Conference on Modern Mathematical Methods and High Performance Computing in Science and Technology, RKGIT, Ghaziabad, 27-29 December, 2015, pp. 44.
  • 22. 22 | P a g e v. Study Area intended to be taken up. States District Gram Panchayat Crops Uttar Pradesh Bulendshaer, Meerut 10 Wheat, Rice Maharashtra Nagpur 10 Cotton Madhya Pradesh Bhopal, Indore 10 Soybean, Chickpea vi. Crops to be taken 1. Wheat, 2. Rice 3. Cotton 4. Soybean 5. Chickpea vii. Methodology/Technology to be used: Methodology regarding Remote Sensing approach Many models are available for crop health and acreage estimation from the satellite data by developing various indices from processing of multi set satellite images such as leaf area index (LAI), Normalized Difference Vegetation Index (NDVI), Enhanced Vegetation Index (ENDVI) and many other models. The methodology applied in most of the models is based on indices based and crop type. The overall methodology will be selection of appropriate set of multi- temporal satellite images and image processing techniques to extract the information from the
  • 23. 23 | P a g e data and their quality assessment. The overall steps shall be followed in the entire process for crop yield estimation and monitoring has given in the flow chart. Standard methodology shall be followed for Crop Yield Estimation and monitoring. Methodology regarding Machine Learning approach
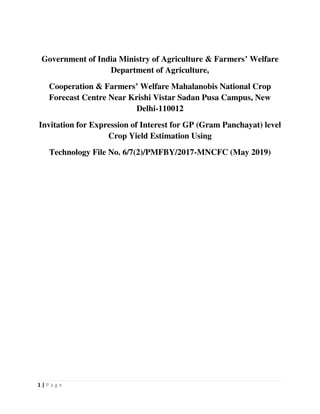
  • 24. 24 | P a g e Satellite data & Field based digital photograph Field Data Labeled Data Crop growth Characteristics Machine Learning Algorithms Data Cleaning Feature Engineering and Feature Selction Model Selection and Training Prediction and Evalauation Satellite data & Field based digital photograph Field Data Labeled Data Crop growth Characteristics Machine Learning Algorithms Data Cleaning Feature Engineering and Feature Selction Model Selection and Training Prediction and Evalauation The steps which will be carried out in order to fulfill Machine Learning Algorithms are as follows 1. Data Cleaning Provided the satellite imagery and received crop growth characteristics, data cleaning will be performed by removing duplicates, filling missing values. Data normalization and type conversion will also be used. 2. Feature Engineering and Feature Selection In machine learning, the process of selecting a subset of relevant features (variables, predictors) for use in model construction. It enables the machine learning algorithm to train faster, reduces
  • 25. 25 | P a g e the complexity and makes it easier to interpret. The appropriate features of the provided data will be selected. The features can be among following:  Crop type  Timestamp  Temperature  Rainfall amount  Crop production Amount  Geographic Area  Soil Type 3. Model selection and Training The literature review shows that the most popular models in agriculture are Artificial and Deep Neural Networks (ANNs and DL) and Support Vector Machines (SVMs). ANNs are inspired by the human brain functionality and represent a simplified model of the structure of the biological neural network emulating complex functions such as pattern generation, cognition, learning, and decision making. Such models are typically used for regression and classification tasks which prove their usefulness in crop management and detection of weeds, diseases, or specific characteristics. The recent development of ANNs into deep learning that has expanded the scope of ANN application in all domains, including agriculture. ANN and Deep Learning can be implemented by using Tenserflow, H2o, etc. SVMs are binary classifiers that construct a linear separating hyperplane to classify data instances. SVMs are used for classification, regression, and clustering. In farming, they are used to predict yield and quality of crops as well as livestock production. Scalable models will be designed by using advanced technologies and environments. 4. Prediction and Evaluation After getting output from the machine learning models, final prediction will be performed. Here, the value of machine learning is realized. The valuable patterns are analyzed and final results based on the analysis will be provided. It may include the best time of harvesting crops, yield prediction and crop quality.
  • 26. 26 | P a g e Field Survey and Validation Use The study will comprise of three states, namely, U.P., Maharashtra and M.P. respectively. The study will lead with selection of 5 districts from above states by random sampling method. Further from each district, 10 Gram panchayats will be selected on the basis of crop area, production and productivity. The crops selected for study purpose are Wheat, Rice, Cotton, Pigeon pea and chick pea. States District Gram Panchayat Crops Uttar Pradesh Bulendshaer, Meerut 10 Wheat, Rice Maharashtra Nagpur 10 Cotton Madhya Pradesh Bhopal, Indore 10 Soybean, Chickpea The following parameters for crop data collection are discussed below Crop Growth Parameters Yield Parameters Wheat a. Plant height (cm) b. Dry matter accumulation (g/m2 ) c. Chlorophyll content d. Leaf area index a. Effective tillers/m2 b. Spike length c. Grains/spike d. 1000 grain weight e. Grain yield f. Straw yield g. Harvest index Rice a. Plant height (cm) b. Dry matter accumulation (g/m2 ) c. Chlorophyll content d. Leaf area index a. Effective tillers/hill b. panicle length c. no. of filled gains/plant d. no. of unfilled grains/plant e. 1000 grain weight f. Grain yield g. Straw yield h. Harvest index Cotton a. Plant height (cm) b. Dry matter accumulation (g/m2 ) c. Chlorophyll content d. Sympodial length e. Sympodial number/plant f. Monopodial length g. Monopodial number/plant a. No. of bolls/plant b. Boll weight c. Seed cotton yield/plant d. Ginning percentage e. Seed index f. Lint index
  • 27. 27 | P a g e Soybean a. Plant height (cm) b. Dry matter accumulation (g/m2 ) c. Chlorophyll content d. Number and dry weight of nodules a. Number of branches b. Pods per plant c. No. of seeds per pod d. 100 seed weight e. Seed yield f. Biological yield g. Harvest index Chick Pea a. Plant height (cm) b. Drymatter accumulation (g/m2 ) c. Chlorophyll content d. Number and dry weight of nodules h. Number of branches i. Pods per plant j. No. of seeds per pod k. 100 seed weight l. Seed yield m. Biological yield n. Harvest index Other Parameters 1. Weather parameter studies 2. Crop quality studies such as protein content 3. Moisture content Field Selection and Conduction of Crop Cutting Experiments (CCE) 1. Each CCE plot will be of minimum 5x5 sq m size or as defined by the Revenue Department of the concerned state. 2. The plots for CCE will be selected based on the vegetation condition map (NDVI and NDWI) derived from high resolution satellite data 3. The Field, where CCE will be conducted, should be at least of 1 acre area. 4. The CCE plot within the field will be representative of the whole field, not affected by site specific external factors. 5. The selected field will be sole-cropped (no mixed cropping) with the concerned crop. 6. The CCE should be conducted in the field, which is ready for harvest. 7. The CCE plot will be at least 3 m away from the field borders. 8. The CCE data will be collected through Smartphones using the Android App. It will be checked that the GPS accuracy is <5 m. 9. The smartphone will have Navigation App, for showing GPS reading and North Direction.
  • 28. 28 | P a g e 10. Each CCE information will come along with latitude - longitude and 2 photographs (of crop cutting and grain weighing) 11. Additionally, 2 photographs i) of the field and ii) of the CCE plot (taken from 1 m above nadir viewing) will also be provided. 12. For Cotton crop CCE will be conducted for at least 3 pickings. 13. The accuracy of Biomass weighing will be 2 decimal levels in kg and grain yield in 3 decimal levels. 14. The Biomass and Grain yield should be weighed using high precision digital balance. Different digital balances should be used for weighing different items (Biomass, Grain Weight, 1000 Seed Weight) 15. Apart from the information coming through smart phones, the hardcopy form to be filled up and signed by the Observer, farmer and a third party not related to above two, along with their name and phone numbers will also be provided to the Centre. 16.The moisture percentage of Biomass will be obtained, at least in 5% cases, through drying method. The Grain moisture percentage will be obtained using portable grain moisture meter
  • 29. 29 | P a g e viii. Experimental Setup  Identification of Villages, Gram Panchayats.  The data will be recorded in four stages of crop growth i.e, Early, Mid growth, Pre- harvest, Harvest. In all this stages the data will be recorded two times. The data will be recorded as per the agronomical parameters which are shown in methodology.  Data will be analyzed for the estimation of yield of concern crop. Generation of Vegetation Index(NDVI) Geo-Referencing SATTELLITE IMAGES(At Different Vintages) District wise Individual Crop estimation Change detection between normal and current year Identification of loaction under stress Hybrid Classification Identification of Signatures Delineation of Total Agriculural Land
  • 30. 30 | P a g e Field Validation and Survey Growth parameters Yield parameters Machine Learning Model selection Prediction and evaluation Machine Learning Data cleaning Feature engineering and selection CROP YIELD ESTIMATION Field Validation and Survey Integration of all approaches Remote sensing Machine Learnig
  • 31. 31 | P a g e ix. Time line: 24 months x. Expected Results:  The data obtained from the project will be helpful to estimate the yield of the crops  It help the farmers to overcome the risk and uncertainties  Benefit cost Analysis  Help farmers time, cost and energy  Government can frame policies regarding crop insurance  Collaboration of I.T. ,Remote Sensing and Agriculture to overcome the risk and uncertainties  Low income and marginal farmers can benefit with technology applied attributes. xi. Tentative Cost/Budget Tentative Budget Manpower (2 Research Associates, 6 J.R.F, 4 Field Staff) Rs.37,20,000/- (Thirty Seven Lakh Twenty Thousand) Multi-temporal Satellite Data information Rs. 7,00,000/- (Seven lakh) Hard ware/ Software (Graphical Processing Unit (GPU) enabled Server with 512GB RAM, Client machine with Intel i7 processor, 64GB RAM, 1 TB SSD, External Hard Disk 10 TB Rs. 10,00,000/- (Ten lakh) Field verification and Data Collection Rs. 8,00,000/- (Eight Lakh) Consumables Rs.6,00,000/- (Six Lakh) Total Rs. 68,20,000/- (Sixty Eight Lakh Twenty Thousand)
  • 32. 32 | P a g e xii. Lists of Patents/publications in the similar works:  Prafull Singh (2019) Application of Thermal Imaging and Hyperspectral Remote Sensing for Crop Water Deficit Stress Monitoring.Geocarto International. DOI: 10.1080/10106049.2019.1618922 (Impact Factor 1.759).  Prafull Singh (2019) Comparison of Various Modelling Approaches for Water Deficit Stress Monitoring in Rice Crop through Hyperspectral Remote Sensing. Agriculture Water Management. 213, 231–244. (Impact Factor 3.182).  Prafull Singh (2019) Probabilistic Landslide Hazard Assessment using Statistical Information Value (SIV) and GIS Techniques: a case study of Himachal Pradesh, India. 1-12, American Geophysical Union. John Wiley & Sons,  Prafull Singh (2019) A Comparative Study of Spatial Interpolation Technique (IDW and Kriging) for Determining the Ground Water Quality.GIS and Geostatistical Techniques for Groundwater Science, 1-15, doi.org/10.1016/B978-0-12-815413-7.00005-5 .Elsevier (USA).  Prafull Singh (2018) Monitoring spatial LULC changes and its growth prediction based on Statistical Models and Earth Observation Datasets of Gautam Buddha Nagar, Uttar Pradesh, India. Environment, Development and Sustainability. 1-19 (Impact Factor 1.379).  Prafull Singh (2018) Morphotectonic Analysis of Sheer Khadd River Basin Using Geo- spatial Tools. Spatial Information Research. 26, 4 , 405–414.  Prafull Singh (2018) Modeling LULC Change Dynamics and its Impact on Environment and Water Security: Geospatial Technology Based Assessment. Journal of Ecology, Environment and conservation .24, 300-306.  Prafull Singh (2018) Hydrological inferences through morphometric analysis of lower Kosi river basin of India for water resource management based on remote sensing data . Applied Water Science, DOI: 10.1007/s13201-018-0660-7.
  • 33. 33 | P a g e  Prafull Singh (2017) Geoinformatics for assessing the inferences of quantitative drainage morphometry of the Narmada Basin in India. Applied Geomatics. 9. 167–189.  Prafull Singh (2017) Assessment of impervious surface growth in urban environment through remote sensing estimates. Environmental Earth Science, 76:541-554. (Impact Factor 1.435).  Prafull Singh (2017) Impact of Land use Change and Urbanization on Urban Heat Islands in Lucknow City, Central India. A Remote Sensing Based Estimate. Sustainable Cities and Society. 32: 100-114. (Impact Factor 3.072).  Pafull Singh (2016) Hydrogeological Component Assessment for Water Resources Management of Semi-Arid Region: A Case Study of Gwalior, M.P., India. Aabian Journal of Geoscience. DOI: 10.1007/s12517-016-2736-8.(Impact Factor 0.860).  Prafull Singh (2016) Appraisal of Urban Lake Water Quality through Numerical Index, Multivariate Statistics and Earth Observation Datasets. International Journal of Environmental Science and Technology. 445-456. (Impact Factor 2.037).  Prafull Singh (2016) Assessment of Urban Heat Islands (UHI) of Noida City, India using multi-temporal satellite data. Sustainable Cities and Society, 19–28. (Impact Factor 3.072).  Prafull Singh (2016) Appraisal of surface and groundwater of the Suburnarekha River Basin, Jharkhand, India: Using remote sensing, Irrigation Indices and statistical techniques. Geospatial technology for Water Resource Application. CRC Press, Taylor Francis. ISBN: 978-1-4987-1968-1.  Prafull Singh (2015) Morphometric evaluation of Swarnrekha watershed, Madhya Pradesh, India: an integrated GIS-based approach. Applied Water Science. DOI: 10.1007/s13201-015-0354-3.  Prafull Singh (2014) Hydrological Inferences from Watershed Analysis for Water Resource Management using Remote Sensing and GIS Techniques. The Egyptian Journal of Remote Sensing and Space Sciences. 17, 111–121.
  • 34. 34 | P a g e  Prafull Singh (2015) Water Reuse Product in Urban Area. Urban Water Reuse Handbook. CRC Press, Taylor Francis. ISBN: 9781482229141.  Prafull Singh (2013) Assessment of Groundwater Prospect zones of a hard rock terrain using Geospatial tool. Hydrological Science Journal (58: 213-223). (Impact Factor 2.546).  Prafull Singh (2013) Morphometric analysis of Morar River Basin, Madhya Pradesh, India, using remote sensing and GIS techniques. Environmental Earth Science (68:1967– 1977). (Impact Factor 1.435).  Prafull Singh (2013) Geochemical modelling of fluoride concentration of hard rock terrain of Madhya Pradesh, India. Acta Geologica Sinica. (87: 1421-1433). (Impact Factor 2.506).  Prafull Singh (2012) Groundwater resource evaluation in the Gwalior area, India, using satellite data: an integrated geomorphologic and geophysical approach. Hydrogeology Journal(19: 1421–1429). (Impact Factor2.071).  Naleeni Ramawat, H.L. Sharma, and Rakesh Kumar 2012. Simulation and validation of CERES-Maize model in North Western Himalayas. Applied Ecology and Environment Research. 10(3):301-318.  Ramawat Naleeni, Sharma Hira Lal and Kumar Rakesh 2009 Simulating sowing date effect on barley varieties using CERES-Barley model in North Western Himalayas. Indian Journal of Plant Physiology14 (2):147-155.  K. Ramesh, Naleeni Ramawat and Virendra Singh. 2007. Leaf Area Distribution Pattern and Non-Destructive Estimation Methods of Leaf Area for Stevia rebaudiana (Bert.) Bertoni .Asian Journal of Plant Sciences 6 (7): 1037-1043.  Ramawat Naleeni, Sharma Hira Lal and Kumar Rakesh 2009 Simulating sowing date effect on barley varieties using CERES-Barley model in North Western Himalayas. Indian Journal of Plant Physiology14 (2):147-155.  Monika Choudhary and Renu Yadav (2013). Antagonistic potential of bacillus species against plant pathogenic fungi. Progressive. Agriculture. 13(1): 49–54.  Monika Choudhary, D.C. Sharma and Renu Yadav (2013). Antagonistic activities of bacillus spp. strains isolated from the different soil samples. Progressive. Agriculture. 13(2): 223-227.  Soi, Sangita; Chauhan, U.S.; Yadav, Renu; Kumar, J.; Yadav, S.S.; Yadav, Hemant and Kumar, Rajendra(2014). STMS based diversity analysis in chickpea(Cicer arietinum L.),
  • 35. 35 | P a g e New Agriculturist, New Agriculturist, 25(2) : 243–250. NAAS ISSN-0971-0647, NAAS I.F.-4.17.  Yadav, Yashwant K; Singh, Rajesh K.; Yadav, Manju; Kumar, Pushpendra Yadav, M.K.; Kumar , Sujit ; Yadav, Renu; Upadhyaya, H.D. ; Yadav, Hemant and, Kumar, Rajendra .(2014).Molecular characterization of a subset of minicore germplasm of pigeonpea (Cajanus cajan ). BIOG-An International Journal, 1(1):39-46.  Renu Yadav and Archana yadav (2015) Organic Farming management for Vegetable Production in rural areas. Indian Journal of applied Research, 5(2): 40-42. (Impact factor: 2.1652).  Renu Yadav and Archana yadav (2015) Low Cost Agricultural Practices to reduce heavy metals..4(4) 70-71Global journal of research Analysis 2277-8160 Impact factor3.1218  Archana Yadav and Renu Yadav(2015). Role of Stress Tolerant Microbes in Sustainable Agriculture. Indian journal of Research, 4(1):30-31. (Impact factor : 1.6714)  Yadav Renu, Nainwal Navin Chandra (2015) Micropropagation of walnut (Juglans regia L) trees Annals of Horticulture Year : Volume : 8, Issue : 1: ( 16) Last page : ( 21) Print ISSN : 0974-8784. Online ISSN : 0976-4623.  Yadav A.,Kumar A., Yadav Renu &Kumar R (2016) In-Vitro regeneration through organogenesis in pigeonpea (Cajanus cajan(L.) Journal of Cell and Tissue Research Vol. 16(1) ISSN: 0973-0028; E-ISSN: 0974-0910  Naleeni Ramawat & Renu Yadav (2015) Organic Management practices to enhance nitrogen use efficiency in rice. Global journal of Research Analysis.volume 4 Issue 8 ISSN NO 2277-8160 (2015)  Sangeeta Mehrotra, Narendra K. Jawali, U.K.Chauhan and Renu Yadav (2016)Transferability of Sequence tagged Microsattelite site (STMS)markers from Vigna unguiculata (L). Progressive Agriculture 16 (1) pp36-40.  Katoch Omika, Chauhan U.S., Yadav Renu & Kumar Rajendra (2016) Nitrate Reductase based phylogenetic analysis in chickpea Research Journal of Chemistry and Environment Vol. 20 (7) ISSN2249-555X
  • 36. 36 | P a g e  Sashi prabha, Renu Yadav & Archana Yadav (2016) Isolation & Optimization of culture conditions for polyBeta Hydroxybutrate (biopolymer)producing bacteria pp1926- 1929Journal of Global BiosciencesISSN 2320-1355 PEER Reviewed1.115.  Renu Yadav, Syam Prasad, Sumeet Kumar Singh, Vishnu Vijay, Twinkle Sabu, Sonam Lama, Pawan Kumar, Jadhav Sandesh, Anjali Thakur and Naleeni Ramawat. (2016). Bio- management of sugarcane aphid Melanaphis Sacchari (z.) In sorghum. Plant Archives Vol. 16 No. 2, 2016 pp. 559-562.Scopus Indexed journal  Monica Chaudhary, Anjali. Malik, Archana Yadav, Naleeni Ramawat and Renu Yadav (2016).evaluation of microbial antibiotic and commercial antibiotics. Journal of Global Biosciences.volume5,No.5, pp 4145-4148.ISSN 2320-1355  J.P. Misra, Gyan Manjary Rao, Ashwani Kumar, Ashwani Yadav,Sujit Kumar, Renu Yadav, R. Kumar and Seweta Srivastava1Molecular Assisted Breeding for Ascochyta Blight Resistance in Chickpea (Cicer arietinum L.) - A Review JOURNAL OF PURE AND APPLIED MICROBIOLOGY, June 2016. Vol. 10(2), p. 1469-1475.  Yadav Ashwani , Sharma Anubhuti , Kumar Ashwani , Yadav Renu , Misra J.P., Kumar P., Singh D. and Kumar R. Expression Analysis of DREB2A Transcriptional Factor under drought stresses in rice (Oryza sativa L.) Research Journal of BiotechnologyVol. 11 (8) August (2016).  Misra J.P, Yadav Ashwani , Kumar Ashwani1,, Yadav Renu, Vaishali1 and Kumar R. Bio-chemical characterization of chickpea genotypes with special reference to protein. Research Journal of Chemistry and EnvironmentVol. 20 (8) August (2016).  Naleeni Ramawat and Renu Yadav (2017) Influence of Bio-Fertilizers on growth attributes of Gaur (Cymopsis Tetraagonoloba) Plant Archives Vol. 17 No. 2, 2017 pp. 869-870ISSN 0972-521  Beila Sehdev Krishnan, Shivam, Naleeni Ramawat and Renu Yadav Investing in the health of Soil: Paramount to Future of Organic Farming Plant Archives Vol. 17 No. 1, 2017 pp. 69-74 ISSN 0972-5210  Rana R Badiyala D and Gunjan G. 2018. Effect of variable nitrogen sources on seed yield, seed quality and nutrient uptake of okra (Abelmoschus esculentus (L.) Moench).
  • 37. 37 | P a g e Indian Journal of Agricultural sciences 88 (6): 910–915, June {NAAS-6.22}/I028/0019- 5022  Rana R and Badiyala D. 2014. Effect of integrated nutrient management on seed yield, quality and nutrient uptake of soybean (Glycine max) under mid hill conditions of Himachal Pradesh. Indian Journal of Agronomy 59(4): 641-645 {NAAS- 5.46}/I030/0537-197X  Rana R and Badiyala D. 2014. Influence of organic manures, fertility levels and method of storage on storability of soybean (Glycine max (L.) Merr.). Journal of Environment and Bio-sciences 28(2): 145-150{NAAS- 4.43}J175/0973-6913  Rana R and Badiyala D. 2014. Physiological parameters, nodulation and yield in soybean as influenced by organic manures and fertility levels. Himachal Journal of Agricultural Research 40(2): 110-117 /H011/0970-0595  Gautam P, Sharma GD, Rana R and Lal B. 2013. Effect of integrated nutrient management and spacing on growth parameters, nutrient content and productivity of rice under system of rice intensification. International Journal of Research in Bio-sciences 2(3): 53-59  Gautam P, Sharma GD, Rana R and Joshi E. 2013. Evaluation of integrated nutrient management and plant density on productivity and profitability of rice (Oryza sativa) under system of rice intensification in mid-hills of Himachal Pradesh. Indian Journal of Agronomy 58 (3): 421-423  Manoj R. Mane, Nilesh P. Tayade And Mahesh M. Kadam, Impact of adoption startup scenario of recommended potato production technology by the potato growers in Gujarat, Agriculture Update, Volume : 1, Issue : 12 , Feburary : 2017, Pg. no. 344-350.  MANOJ R. MANE, NILESH P. TAYADE AND MAHESH M. KADAM, Extent of adoption of potato production technology by the potato growers in Sabarkantha district of Gujarat, Agriculture Update, Volume : 1, Issue : 12 , Feburary : 2017, Pg. no. 101-109.  Kadam M.M., Sharad Sachan and R.G.Deshmukh (2016): Economic Analysis of Public and Private Warehouses in Maharashtra- A Stochastic frontier Approach, Indian Journal of Applied Research, Volume : 6 , Issue : 12 , December : 2016, Pg. no. 731-733.  Kadam M.M., Sharad Sachan and R.G.Deshmukh (2016): Comparative Analysis of Public and Private Food grain Warehousing in Vidarbha region of Maharashtra, Indian Journal of Applied Research Volume : 6 , Issue : 12 , December : 2016, Pg. no. 727- 730.  J. A. Lamtule, R. G. Deshmukh, V. K. Khobarkar And M. M. Kadam, Growth in Export and Import of Cotton Under WTO Regime in India, Advances in Life Sciences 5(11), 2016. Pg. No. 4651-4657.
  • 38. 38 | P a g e  J. A. Lamtule, R. G. Deshmukh, V. K. Khobarkar And M. M. Kadam, Growth and Instability in Cotton Production Under WTO Regime, Advances in Life Sciences 5(11), 2016. Pg. No. 4338-4394.  Gebbers and Adamchuk, 2010, Precision agriculture and food security, National Center for Biotechnology Information, Science. 2010 Feb 12;327(5967):828-31. doi: 10.1126/science.1183899.  David J. Mulla, 2012-13, Twenty five years of remote sensing in precision agriculture: Key advances and remaining knowledge gaps, Elsevier Ltd. All rights reserved. http://dx.doi.org/10.1016/j.biosystemseng.2012.08.009  Vandana Bhatia 2019, A distributed overlapping community detection model for large graphs using autoencoder, Elsevier-Future Generation Computer Systems( IF4.639), vol. 94, pp-16-26.  Vandana Bhatia 2018, PFCA: An influence based parallel fuzzy clustering algorithm for large complex networks, Wiley- Expert Systems, vol. 35, no. 6.  Vandana Bhatia , 2018 Ap-FSM: A parallel algorithm for approximate frequent subgraph mining using Pregel, Elsevier-Expert Systems with Applications (IF-3.768), 106, 217-232.  Vandana Bhatia, 2018 DFuzzy: A Deep Learning Based Fuzzy Clustering Model for Large Graphs, Springer-Knowledge and Information System, vol. 57, no. 1, pp159-181.  Vandana Bhatia , 2017 A Parallel Fuzzy Clustering Algorithm for Large Graphs using Pregel, Elsevier-Expert Systems with Applications (IF-3.768), 78, 135-144.  Vandana Bhatia , 2017 An Efficient Influence based Label Propagation Algorithm for Clustering large Graphs, presented in International Conference on Infocom Technologies and Unmanned Systems (ICTUS'2017) held in Dubai during Dec 18-20.  Vandana Bhatia , 2017 An Efficient Algorithm for Sampling of a Single Large Graph, presented in IEEE Tenth International Conference on Contemporary Computing held at JIIT, Noida on 10-12 August 2017.
  • 39. 39 | P a g e  Vandana Bhatia ,2015 An Efficient Storage framework design for Cloud Computing: Deploying Compression on De-duplicated No-SQL DB using Hadoop Distributed File System, In IEEE 1st International Conference on Next Generation Computing Technologies (NGCT), pp 1-6.  Vandana Bhatia ,2014 SETiNS: Storage Efficiency Techniques in No-SQL database for cloud based design, In IEEE International Conference on Advances in Engineering and Technology Research (ICAETR), held on 1st and 2nd August 2014 at Dr. Virendra Swarup Group of Institutions, Unnao, Uttar Pradesh, India.  Vandana Bhatia ,2014 A review on Cloud Computing and Data Management in Cloud, In 2nd International Conference on Futuristic Trends in Engineering and Management held on 3rd and 4th May 2014, Ambala, Haryana, India. 2013 A Study on Swarm Artificial Intelligence, International Journal of Advanced Research in Computer Science and Software Engineering, Volume 3, Issue 8, August 2013.  Mehta, Akriti, &Sharma, Deepak(2014). Towards SolvingtheGoogleCAPTCHA.. International Journal of Computer Applications, 89.20 , 32–35.  Sharma, Deepak, & Devale, R. Prakash (2012). Approach for Transforming Monolingual Text Corpus into XML Corpus. International Journal of Applied Information Systems, 1.9, 1–5.  Sharma, Deepak, Kumar, Bijendra, & Chand, Satish (2017). A Survey on Journey of Topic Modelling Techniques from SVD to Deep Learning. International Journal of Modern Education and Computer Science(IJMECS), Vol.9, No.7, pp.50-62, 2017. DOI: 10.5815/ijmecs.2017.07.06.  Sharma, Deepak, Kumar, Bijendra, & Chand, Satish (2018). A Trend Analysis of Machine Learning Research with Topic Models and Mann-Kendall Test. International Journal of Intelligent Systems and Applications(IJISA), Vol.11, No.2, pp.70-82, 2019. DOI: 10.5815/ijisa.2019.02.08.  Saurabh Agarwal, Satish Chand and S. Nikolay, “SPAM Revisited for Median Filtering Detection Using Higher-Order Difference,” Security and communication networks, Wiley publications, vol. 9(17), November, 2016, pp. 4089-4102.
  • 40. 40 | P a g e  Saurabh Agarwal and Satish Chand, “Anti-forensics of JPEG images using interpolation,” International journal of image, graphics and signal processing, vol. 7(12), November, 2015, pp. 10-17.  Saurabh Agarwal and Satish Chand, “Image forgery detection using multi scale entropy filter and local phase quantization,” International journal of image, graphics and signal processing, vol. 7(10), September 2015, pp. 78-85.  Mani, Neel, Helfert, Markus and Pahl, Claus (2016), Business Process Model Customisation using Domain-driven Controlled Variability Management and Rule Generation, International Journal on Advances in Software, vol. 9, pp. 179 - 190, 2016.  Mani, Neel, Helfert, Markus, Pahl, Claus, Nimmagadda, Shastri L and Vasant, Pandian (2017), Domain Models Definition for Rule Generation Using Controlled Variability Management, Computational Intelligence, Innovative Computing, Optimization and Its Applications.  Mani, Neel, Helfert, Markus and Pahl, Claus (2017), A Framework for Generating Domain-specific Rule for Process Model Customisation, In, International Conference on Computer-Human Interaction Research and Applications (CHIRA), 31 Oct, 1-2 Nov 2017, Funchal, Maderia- Portugal.  Mani, Neel, Helfert, Markus and Pahl, Claus (2017), Domain-specific Generation Using Variability for Business Process Model Constraint, In, 21st International Conference on Knowledge-Based and Intelligent Information & Engineering Systems, 06-08 Sep 2017, Marseille, France.  Sanjay Kumar, Mani, Neel and Singh, Bharat (2016) A framework for extracting reliable information from unstructured uncertain big data In: 8th International KES Conference on INTELLIGENT DECISION TECHNOLOGIES IDT 2016,15-17 June 2016 in Teneri
  • 41.
  • 42.
  • 43.
  • 44. ORIGINAL PAPER Appraisal of urban lake water quality through numerical index, multivariate statistics and earth observation data sets S. K. Singh1 • Prafull Singh2 • S. K. Gautam3 Received: 6 January 2015 / Revised: 23 May 2015 / Accepted: 5 July 2015 / Published online: 7 August 2015 Ó Islamic Azad University (IAU) 2015 Abstract The earth observation data sets were employed to study the land use/land cover change in study area from year 2000–2010. Vegetation, built-up area and agriculture classes had shown maximum changes. The lake water samples were analyzed, and further, Water Quality Index (WQI) was computed to categorize the lake water. The average value of WQI is 64.52, 52.23 and 42.45 in pre- monsoon, monsoon and post-monsoon seasons, respec- tively. Generally, pre-monsoon samples have higher num- ber of polluted samples. Moreover, we applied the multivariate statistical techniques for handling large and complex data sets in order to get better information about the lake water quality. Factor analysis and principal com- ponent analysis are applied to understand the latent struc- ture of the data sets, and we have identified a total of four factors in pre-monsoon, three factors in monsoon and three factors in post-monsoon season, which are responsible for the whole data structure. These factors have explained that 90.908, 89.078 and 85.456 % of the cumulative percentage variance of the pre-monsoon, monsoon and post-monsoon data sets. Overall analysis reveals that the agricultural runoff, waste disposal, leaching and irrigation with wastewater, land transformation in the surrounding areas are the main causes of lake water pollution followed by some degree of pollution from geogenic sources such as rock weathering. Hence, there is an urgent need of proper attention and management of resources. Keywords Lake Á Land use/land cover change Á Pollution Á Earth observation data sets Introduction There are very limited studies on lake in India. In recent decades, the developing countries are witnessed of water pollution after industrialization, and unprecedented popu- lation growth (Singh et al. 2013a, b, c, d; Ois¸te 2014; Thakur et al. 2015; Gautam et al. 2015). The increasing population around the urban lake has continuously encroached lake area due to demand of land and water (Singh et al. 2010) and acts as waste dumping sites which have many adverse effects on humans (Rast ; Mishra and Garg 2011). The direct discharge of sewage from the households into the urban lake and the surface runoff brings sediment, nutrients and chemicals from catchment area into lake, and hence, they get polluted. These exces- sive nutrients mainly nitrate and phosphates promote excessive growth of aquatic plants in the lake and make them anaerobic (Gautam et al. 2013) and destroy the aquatic flora and fauna. Such undesirable change in water chemistry (Akoto and Adiyiah 2007) brings deterioration of lake water quality. With rapid urban development since 1956, when Bhopal became the state capital of Madhya Pradesh, the lake has simultaneously been affected by increased inflows of silt, untreated sewage, nutrients and pesticides from urban and rural areas, and growing domestic water demand and treatment costs for the municipal water supply. Therefore, & Prafull Singh singhgeoscience@rediffmail.com 1 K. Banerjee Centre of Atmospheric and Ocean Studies, IIDS, Nehru Science Centre, University of Allahabad, Allahabad 211002, India 2 Amity Institute of Geo-Informatics and Remote Sensing, Amity University, Sector 125, Noida 201303, India 3 School of Environmental Sciences, Jawaharlal Nehru University, New Delhi 110067, India 123 Int. J. Environ. Sci. Technol. (2016) 13:445–456 DOI 10.1007/s13762-015-0850-x
  • 45. the regular monitoring and assessment are a prerequisite to understand the water quality. Many governments are now seeing other approaches in response to increasing aware- ness of degrading lake water resources and growing con- cern over the significant fiscal burden of agricultural subsidies. Earth observation data sets, e.g., satellite images, are quite useful, which could be used for synoptic representa- tion of any area (Srivastava et al. 2010). Land use/land cover change (LULCC) quantification is one of the major application of earth observation data sets, and it is impor- tant for assessing global environmental change processes and helps in making new policies and optimizing the maximum use of natural resources in sustainable manners (Srivastava et al. 2012). The land use/land cover (LULC) types, such as agricultural land and urban area, are associated with human activities that often affect the water quality and change the aquatic ecological environment; hence, monitoring spatial–temporal changes is essential to understand the driving factors which influence the water quality of any area. Amin et al. (2014) and Mishra and Garg (2011) has did research on lake of India by implying the satellite data. According to Singh et al. (2015), the concept of water quality to categorize water according to its degree of purity or pollution dated back to year 1848. Around the same time, the importance of water quality to public health was recognized in the UK (Snow 1856). Water Quality Index (WQI) methodologies have been developed to provide single number that expresses the overall water quality at a certain location and time, based on several water quality parameters (Parmar and Bhardwaj 2013; Vasanthavigar et al. 2010; Avvannavar and Shrihari 2008; Singh et al. 2015) and can be used to provide the overall summaries of water quality on a scientific basis. Parmer and Bhardwaj (2013) have applied WQI and fractal dimension approach to study the water of Harike lake on the confluence of Beas and Sutlej rivers of Punjab (India). Many researchers have discussed the importance and applicability of WQI for water characterization (Couillard and Lefebvre 1985; House and Newsome 1989; Bordalo et al. 2001; Smith 1989; Swamee Tyagi 2000; Sanchez et al. 2007). In combination with remote sensing water quality, the use of multivariate statistical techniques offers a detailed understanding of water quality parameters and possible factors that influence the water quality behavior (Srivastava et al. 2012). Principal component analysis (PCA) and factor analysis (FA) offer a valuable tool for consistent, reliable, effective management of water resources (Srivastava et al. 2012; Singh et al. 2009, 2013d, 2015). Many authors in past have used multivariate statistical techniques to characterize and evaluate surface and groundwater quality and have found it interesting for studying the variations caused by geogenic and anthropogenic factors (Shrestha and Kazama 2007; Singh et al. 2005). For understanding the lake water quality, multivariate statistical techniques integrated with remote sensing, and WQI (Srivastava et al. 2012) could be used for identification of the possible factor/sources that influences urban lake water quality. As the study area occupied by hard basaltic terrain and groundwater resource are limited. Hence, largely the water supply in urban areas setteled at hard rock terrain depends on lake water too for drinking and small scale industrial purposes. The water supply of bhopal urban area mainly depends on the Bhopal lake for drinking, irrigation and small scale industries. The specific objective of this research was focused on to quantify the historical changes in LULC using satellite data sets and its probable impact on the lake water quality with integration of statistical techniques to know the pollution status of Bhopal lake and to categorize lake water by WQI method. The findings of the study will be useful for the restoration of Bhopal lake. Materials and methods Description of study area District Bhopal [latitudes 20°100 –23°200 N and longitudes 77°150 –77°250 E (Fig. 1)] is the capital city of the state of Madhya Pradesh, India. Upper lake commonly known as Bhoj wetland is the main lake of the city and provides water to the dwellers. The lake surrounded by natural landscape, settlements and agricultural fields. The average annual rainfall is 1270 mm. The southern part of the city receives more rainfall than northern part of the city. The maximum rainfall takes place during the month of July. The area is drained by small drains which are lastly contributing water to the river Betwa in the downstream. Bhopal has been growing at a fast rate due to urban development and industrialization, in search of better facilities and for educational purposes. The major part of the city is covered by Vindhyan hills and by basaltic Deccan trap. The Deccan trap covers almost one-third of the area followed by Vindhyan sandstone (Singh and Singh 2012). In Deccan trap basalts, aquifer is encountered at shallow depth and in Vindhyan sandstone depth ranges more than 150 meter below ground level (mbgl). The water supply to Bhopal city mainly comes from surface water bodies and small amount by groundwater. Nowadays, a number of boreholes/tube wells are drilled in the area without consideration of hydrological status of the aquifer formation to meet the water requirement, and this unaware drilling has also led to the declining trend of water level and also failure of well in successive years. Upper lake is a 446 Int. J. Environ. Sci. Technol. (2016) 13:445–456 123
  • 46. major source of drinking water for the urban residents, serving around 40 % of the residents with nearly 140,000 m3 of water per day. Bada talaab, along with the nearby Chhota talaab, constitutes Bhoj wetland, which is now a Ramsar site. The two lakes support flora and fauna. White stork, blacknecked stork, barheaded goose, spoonbill, etc., which have been rare sightings in the past, have started appearing. A recent phenomenon is the gath- ering of 100–120 sarus cranes in the lake. The largest bird of India, sarus crane (Grusantigone), is known for its size, majestic flight and lifetime pairing. Flora 106 species of Macrophytes (belonging to 87 genera of 46 families), Fig. 1 Location map of Bhopal Lake, MP, India Int. J. Environ. Sci. Technol. (2016) 13:445–456 447 123
  • 47. which includes 14 rare species and 208 species of Phyto- plankton comprising 106 species of Chlorophyceae, 37 species of Cyano phyceae, 34 species of Euglenophyceae, 27 species of Bacilariophyceae and 4 species of Dino- phyceae. Fauna 105 species of zooplanktons, which includes (rotifera 41, Protozoa 10, Cladocera 14, Copepoda 5, Ostracoda 9, Coleoptera 11, and Diptera 25). Fish fauna consist of 43 species (natural and cultured species), and 27 species of avifauna, 98 species of insects and more than 10 species of reptiles and amphibians (including 5 species of tortoise) have been recorded. Geology and geomorphology of the study area The Deccan trap sequence consists of multiple layers of solidified lava flows. It is more than 2000 m thick on its western margin and decreases in thickness eastward and occupies *5, 00,000 km2 area spread over parts of Mad- hya Pradesh, Maharashtra, Gujarat, Andhra Pradesh and Karnataka (Singh et al. 2011, 2013a, b, c). The basaltic lava flows vary in color from dark gray to purple and pink. Each lava flow consists of an upper vesicular unit and a lower massive unit which may or may not be fractured/ jointed. Two lava flows at some places are separated by intertrappean sedimentary beds. Therefore, unlike other hard rocks, the Deccan trap behaves as a multiaquifer system, somewhat similar to a sedimentary rock sequence. Bhopal is occupied by the rocks of Vindhyan and Deccan trap basalt and alluvial formations. Hydrogeologically, area is divided into three major type’s alluvium, Deccan trap and Vindhyan sandstones with small patches of shale which makes the major aquifers of the city. In the study area, Deccan trap is sporadically distributed mainly in the form of linear patches. On the satellite image, this rock type is seen with distinct gray color with rough texture. The derivatives of Deccan trap rock are the black soils, which are seen on the satellite image as dark gray tone with smooth texture. The major geomorphic landforms within the catchment of Bhopal lake are pediplain, shallow weathered/shallow buried pediplain and pediplain weath- ered/buried with varying thickness. On the basis of thick- ness and composition of weathered material, the pediplain has been classified into shallow weathered pediplain and moderate weathered pediplain (Singh et al. 2013a, b, c). Most of the area covers under shallow pediplain; hence, this landform classified as good zone of groundwater and agri- cultural activity within the lake catchment. Data and Methodology The study is mainly based on laboratory based data, sup- plemented by primary information especially of social and economic characteristics. Land use/land cover The earth observation data sets used for the preparation of LULC maps of year 2000 and 2010 using Landsat satellite images. The multispectral satellite image from the Landsat data was geometrically rectified and regis- tered with Survey of India (SOI) topographical sheets used as a reference for taking ground control points (GCP) by using UTM projection and WGS 84 datum. Further, all geocoded images were mosaic using ERDAS Imagine 9.1. Further, for assistance in the process of interpretation, SOI (55 E/7 and 55 E/8) at 1:50,000 scales was used as the reference map for interpretation of the basic information of the lake catchment (Table 1). Field and laboratory analysis Water samples were collected during month of January 2010–December 2010 on monthly time intervals in 1 L plastic bottles. Total of 15 sample collection sites were monitored for chemical pollutant analyses during pre- monsoon, monsoon and post-monsoon seasons. The col- lected samples were separated into three aliquots. All samples were stored at 4 °C for further analysis. Col- lection and analysis were performed as specified standard international methods (APHA, 1999). Total alkalinity (as HCO3 - ), total hardness, calcium, magnesium, chloride, phosphate, nitrate, biological oxygen demand (BOD) and chemical oxygen demand (COD) were measured from the collected samples on the monthly basis. Alkalinity is measured using a Hath field titration kit (through titration with 0.1 M HCl). The major cations are (Mg2? and Ca2? ) analyzed using an atomic absorption spectropho- tometer. Major anions (Cl- , NO3–N and PO4 3- ) for samples are undertaken by ion chromatography. The Table 1 Different standard given by World Health Organization Sr. no. Parameters Standard (Si) Wi 1 Total alkalinity 120 0.0084 2 Total hardness 500 0.002 3 Calcium content 75 0.0134 4 Magnesium content 75 0.0134 5 Chloride 250 0.004 6 Phosphate 1.5 0.6689 7 Nitrate 50 0.0201 8 BOD 5 0.2007 9 COD 14.5 0.0692 P Wi = 1 Vi = 0 for the parameters except for pH and dissolved oxygen (D.O) (Sinha and Saxena 2006) 448 Int. J. Environ. Sci. Technol. (2016) 13:445–456 123
  • 48. methodological limitations starts from collection of samples, transportation, sample analysis in laboratory, instrumentation limitation in terms of sensitivity and precision, and interpretation of results. The sampling and analysis were performed according to APHA (1999). Methodological limitation of ion chromatography is equivalency, and a high concentration of any one ion also interferes with the resolution, and sometimes retention, of others. Sample dilution or gradient elution overcomes much interference. To resolve uncertainties of identification or quantitation, use the method of known additions. The most troublesome type of interference is termed ‘‘chemical’’ and results from the lack of absorp- tion by atoms bound in molecular combination in the flame. This can occur when the flame is not hot enough to dissociate the molecules or when the dissociated atom is oxidized immediately to a compound that will not dissociate further at the flame temperature. Such inter- ferences may be reduced or eliminated by adding specific elements or compounds to the sample solution. The precision and accuracy of the analysis are within 5 % (evaluated through repeated analyses of standards and samples) (Singh et al. 2015). In the present study, we did not analyze any lake sediment and water for the metal analysis due to financial constraints which will be our future scope of research. Water Quality Index estimation WQI provides an unambiguous picture about the usability of water for different purposes such as drinking, irrigation and industrial usage (Singh et al. 2015). However, it is difficult to simplify surface and ground- water quality to a specific index because of its sensitive nature to inputs received from sources such as geogenic contribution, water–rock reactions, agricultural runoff, domestic and industrial wastes (Singh et al. 2012). However, the modified WQI by Tiwari and Mishra (1985) is useful and efficient method for assessing the quality of water and presently used by many scientists and water managers. To determine the suitability of the water for drinking purposes (Srivastava et al. 2012; Singh et al. 2015), WQI can be estimated by using the following methodology: WQI ¼ Anti log Xn i¼1 Wi log10 qi " # ð1Þ where Wi is the weighting factor computed using equation Wi ¼ K=Si ð2Þ K is proportionality constant derived from Eq. 3 K ¼ 1 Pn i¼1 1=Si 2 6 6 4 3 7 7 5 ð3Þ where Si is the World Health Organization (WHO) standard values of the water quality parameter. Quality rating (qi) is calculated using the formula, qi ¼ Vactual À Videalð Þ= Vstandard À Videalð Þ½ Š Â 100 ð4Þ where qi is quality rating of ith parameter for a total of n water quality parameters, Vactual is the value of the water quality parameter obtained from laboratory analysis, Videal is zero except for pH and D.O. and Vstandard is WHO standard of the water quality parameters (Table 1). The rating and category chart for WQI is represented through Table 2. Multivariate statistical method The application of multivariate statistical techniques is very useful for classification, modeling and interpretation of large data sets which allow the reduction in dimen- sionality of the large data sets (Singh et al. 2009, 2015). FA/PCA techniques are applied for multivariate analysis of data sets of lake water quality. PCA is applied after stan- dardizing the data sets through the z-scale transformation to avoid any misclassification (Singh et al. 2015). The principal component (PC) is expressed as: zij ¼ ai1x1j þ ai2x2j þ ai3x3j þ Á Á Á þ aimxmj ð5Þ where a is the component loading, z the component score, x the measured value of a variable, i the component number, j the sample number, and m the total number of variables. The FA analysis attempts to reduce the contribution to less significant variables obtained from PCA and the new group of variables known as varifactors (VFs). VFs are extracted through rotating the axis defined by PCA. In FA, the basic concept is expressed in Eq. (6), zji ¼ af1f1i þ af2f2i þ af3f3i þ Á Á Á þ afmfmi þ efi ð6Þ where z is the measured value of a variable, a the factor loading, f the factor score, e the residual term accounting Table 2 Rating and category chart of WQI Sr. no. WQI level Water quality rating 1 25 Excellent 2 26–50 Good 3 51–75 Poor 4 76–100 Very Poor 5 [100 Unfit for drinking purposes Int. J. Environ. Sci. Technol. (2016) 13:445–456 449 123
  • 49. for errors or other sources of variation, i the sample num- ber, j the variable number and m the total number of factors. Results and discussion Hydrochemistry of lake water The descriptive statistics of 12 physicochemical parameters at the 15 locations are summarized in Table 3. The average value of total alkalinity 78.67, 60.07 and 57.20 was observed during the pre-monsoon, monsoon and post- monsoon seasons. Carbonate alkalinity average value was 13.19, 11.80 and 6.80, and bicarbonate alkalinity was 65.49, 49.43 and 50.96; total hardness average value was 85.25, 94.77 and 89.84, calcium hardness was 60.12, 67.10 and 68.58 and magnesium hardness was 25.14, 27.67 and 21.27 in the pre-monsoon, monsoon and post-monsoon seasons, respectively. Calcium and magnesium are an essential nutrient that is required by all living organisms. Calcium and magnesium are entirely derived from rock weathering. The sources of Ca mainly are carbonate rocks containing calcite (CaCO3) and dolomite [(CaMg(CO3)2], with a lesser proportion derived from Ca-silicate minerals. Calcium is usually one of the most important contributors to hardness. The average value of Ca was 25.25, 28.18 and 28.80, magnesium 6.11, 6.72 and 5.17 in the pre-monsoon, monsoon and post-monsoon seasons, respectively. Chloride is extremely mobile and very much soluble in surface water. The main geogenic sources of chloride are sea salt and dissolution of halite (NaCl) in bedded evap- orites or dispersed in shales, and anthropogenic sources are domestic and industrial sewage, mining, and road salt runoff. The average value of chloride was 6.13, 21.03 and 19.35 in the all three seasons, respectively. Phosphorus is a vital and often limiting nutrient. The most common minerals are apatite, which is calcium phosphate with variable amounts of hydroxyl-, chloro-, or fluoro-apatite and various impurities. Some other phos- phate minerals contain aluminum or iron. The anthro- pogenic sources of phosphorus are domestic sewage, as the element is essential in metabolism, industrial sewage and household detergents. Phosphates and nitrates are the major cause of eutrophication problem in lakes. The average values of phosphate were 1.05, 0.76 and 0.62, total phos- phorous was 1.62, 1.91, and 1.80, organic phosphorous was 1.13, 1.16 and 1.18 and nitrate was 0.73, 0.73 and 0.64 in the pre-monsoon, monsoon and post-monsoon season, respectively. Aqueous geochemistry behavior of nitrogen is strongly influenced by the vital importance of the element in plants and animal nutrition. The anthropogenic sources of nitrate in surface water are runoff from the agriculture field, and leachates from the landfill sites. The BOD was 3.83, 4.83 and 4.42, and COD was 29.60, 21.06 and 15.73 in the pre-monsoon, monsoon and post-monsoon season, respectively. The development activity and expansion of the city leading to discharge of waste water in the upper Table 3 Physicochemical properties of lake water samples during the three seasons (all the parameters units are in mg/l) Parameters Pre-monsoon Monsoon Post-monsoon Max Min Avg Std Max Min Avg Std Max Min Avg Std Total alkalinity 129.60 61.60 78.67 18.55 98.00 49.00 60.07 12.03 78.67 46.67 57.20 7.50 Carbonate alkalinity 17.60 7.00 13.19 2.95 16.67 7.00 11.80 2.78 11.33 4.00 6.80 2.30 Bicarbonate alkalinity 118.40 46.00 65.49 19.84 94.50 36.50 49.43 13.99 76.00 42.67 50.96 8.06 Total hardness 146.00 74.80 85.25 17.53 155.50 79.50 94.77 18.13 116.67 62.67 89.84 17.23 Ca hardness 105.00 51.66 60.12 13.26 122.85 55.65 67.10 16.66 104.30 55.30 68.58 12.99 Mg hardness 41.00 18.56 25.14 5.90 33.73 19.48 27.67 5.27 42.07 7.37 21.27 10.38 Calcium content 44.10 21.70 25.25 5.57 51.60 23.37 28.18 7.00 43.81 23.23 28.80 5.46 Magnesium content 9.96 4.51 6.11 1.43 8.20 4.73 6.72 1.28 10.22 1.79 5.17 2.52 Chloride 31.17 12.99 16.13 4.27 35.21 16.23 21.03 4.54 27.64 15.65 19.35 2.83 Phosphate 3.19 0.49 1.05 0.68 3.14 0.18 0.76 0.74 3.06 0.12 0.62 0.72 Total phosphorus 3.56 0.94 1.62 0.71 4.05 1.15 1.91 0.8 3.93 1.03 1.80 0.80 Organic phosphorus 2.31 0.43 1.13 0.47 2.33 0.45 1.16 0.47 2.66 0.55 1.18 0.51 Nitrate 1.88 0.11 0.73 0.46 1.86 0.09 0.73 0.45 1.77 0.07 0.64 0.46 BOD 4.88 3.08 3.83 0.56 11.60 3.40 4.83 1.94 10.00 2.00 4.42 2.60 COD 44.80 23.20 29.60 4.70 35.00 16.06 21 4.75 30.67 12.00 15.73 4.37 450 Int. J. Environ. Sci. Technol. (2016) 13:445–456 123