Download as PDF, PPTX


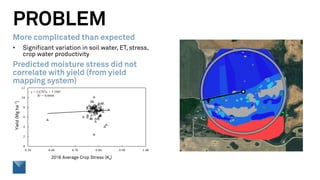
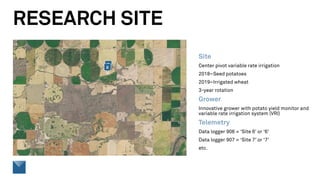
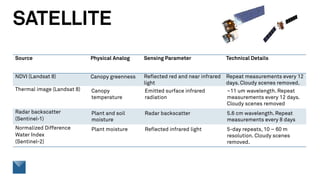
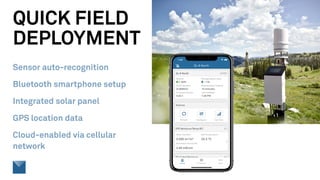
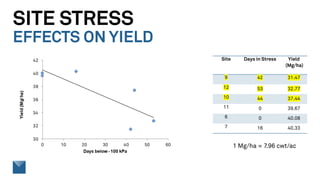
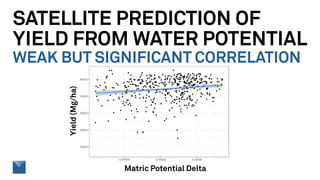
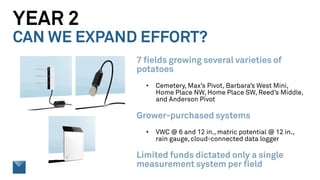
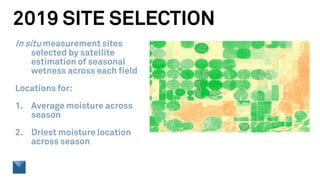
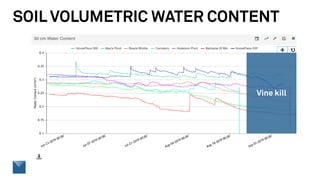
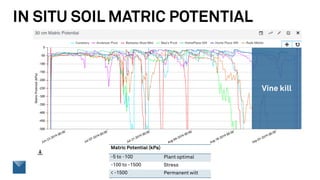
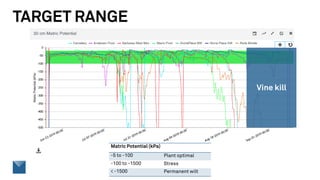
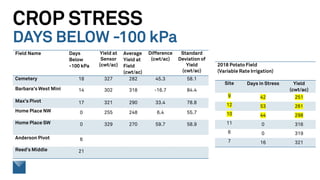
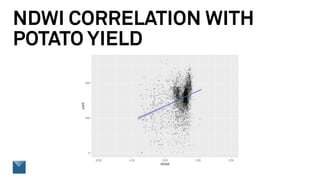
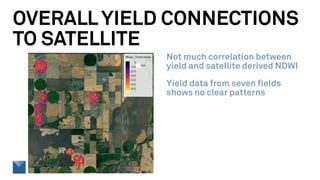


The document discusses the integration of remote sensing and field monitoring techniques to optimize irrigation management and improve crop yield, particularly for potatoes. A case study outlines the challenges faced in predicting yield and managing water stress, revealing limited correlation between satellite data and actual yield. Future efforts aim to expand measurement capabilities and refine data collection methods to enhance the predictive accuracy of irrigation practices.


