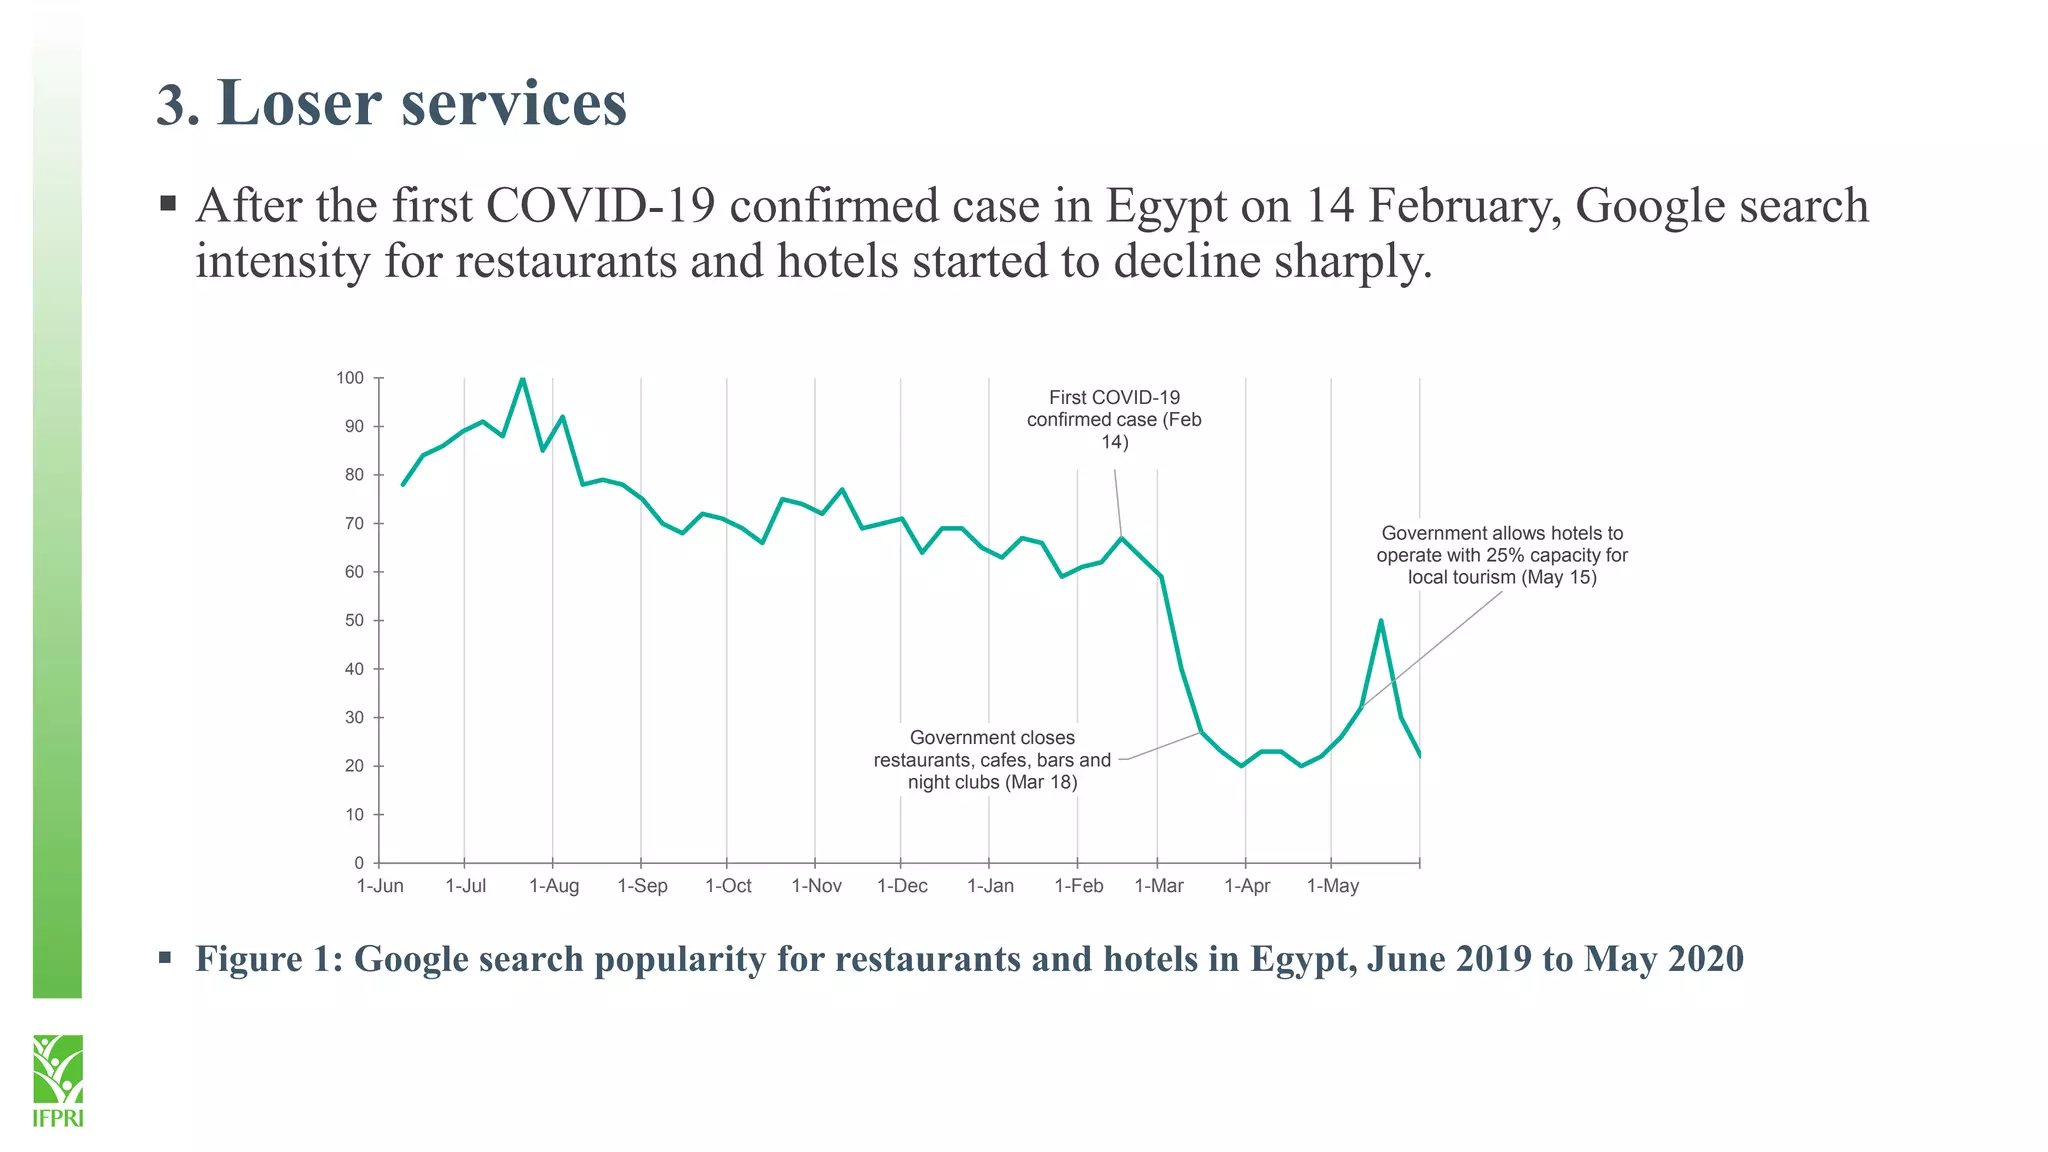
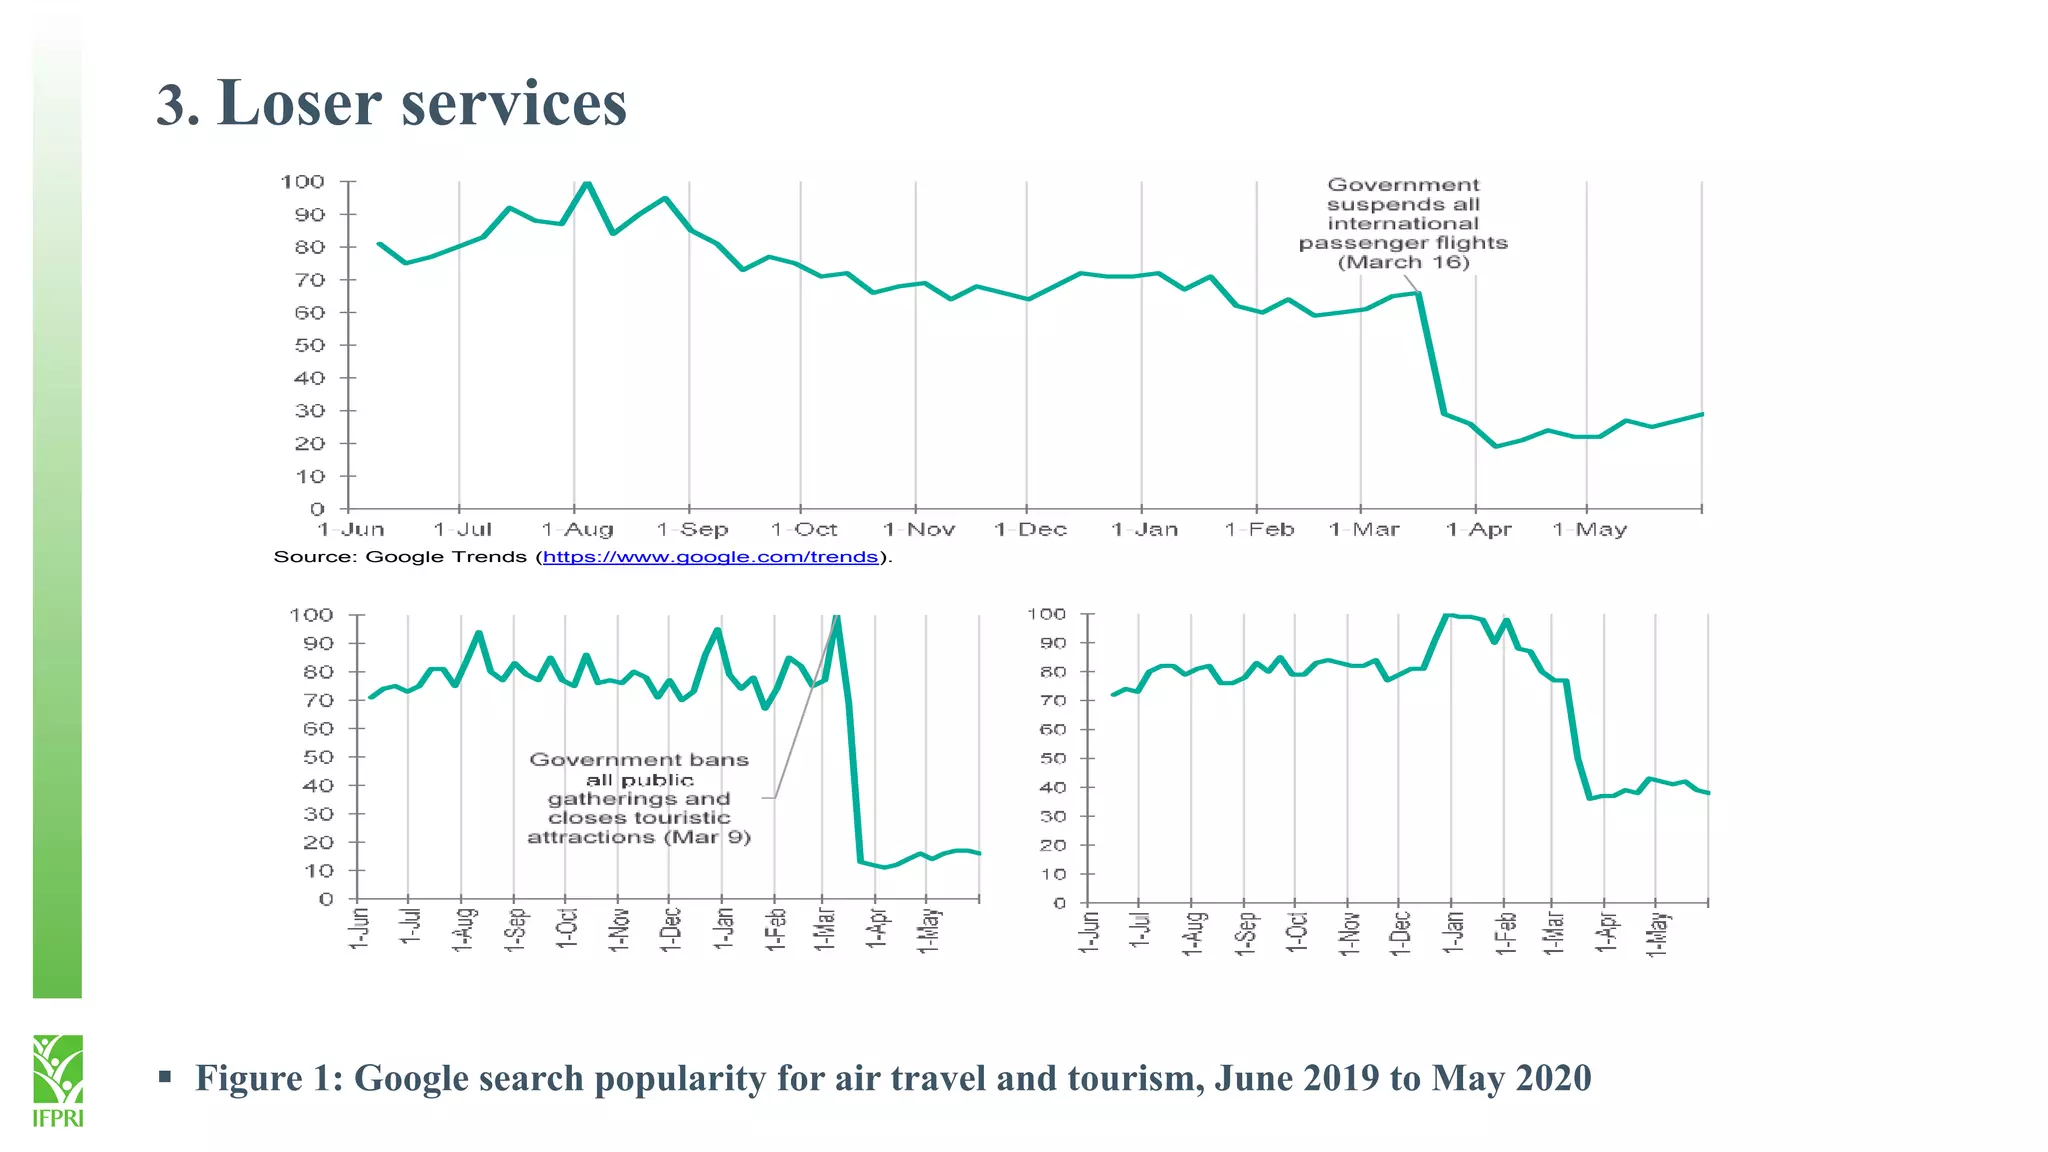
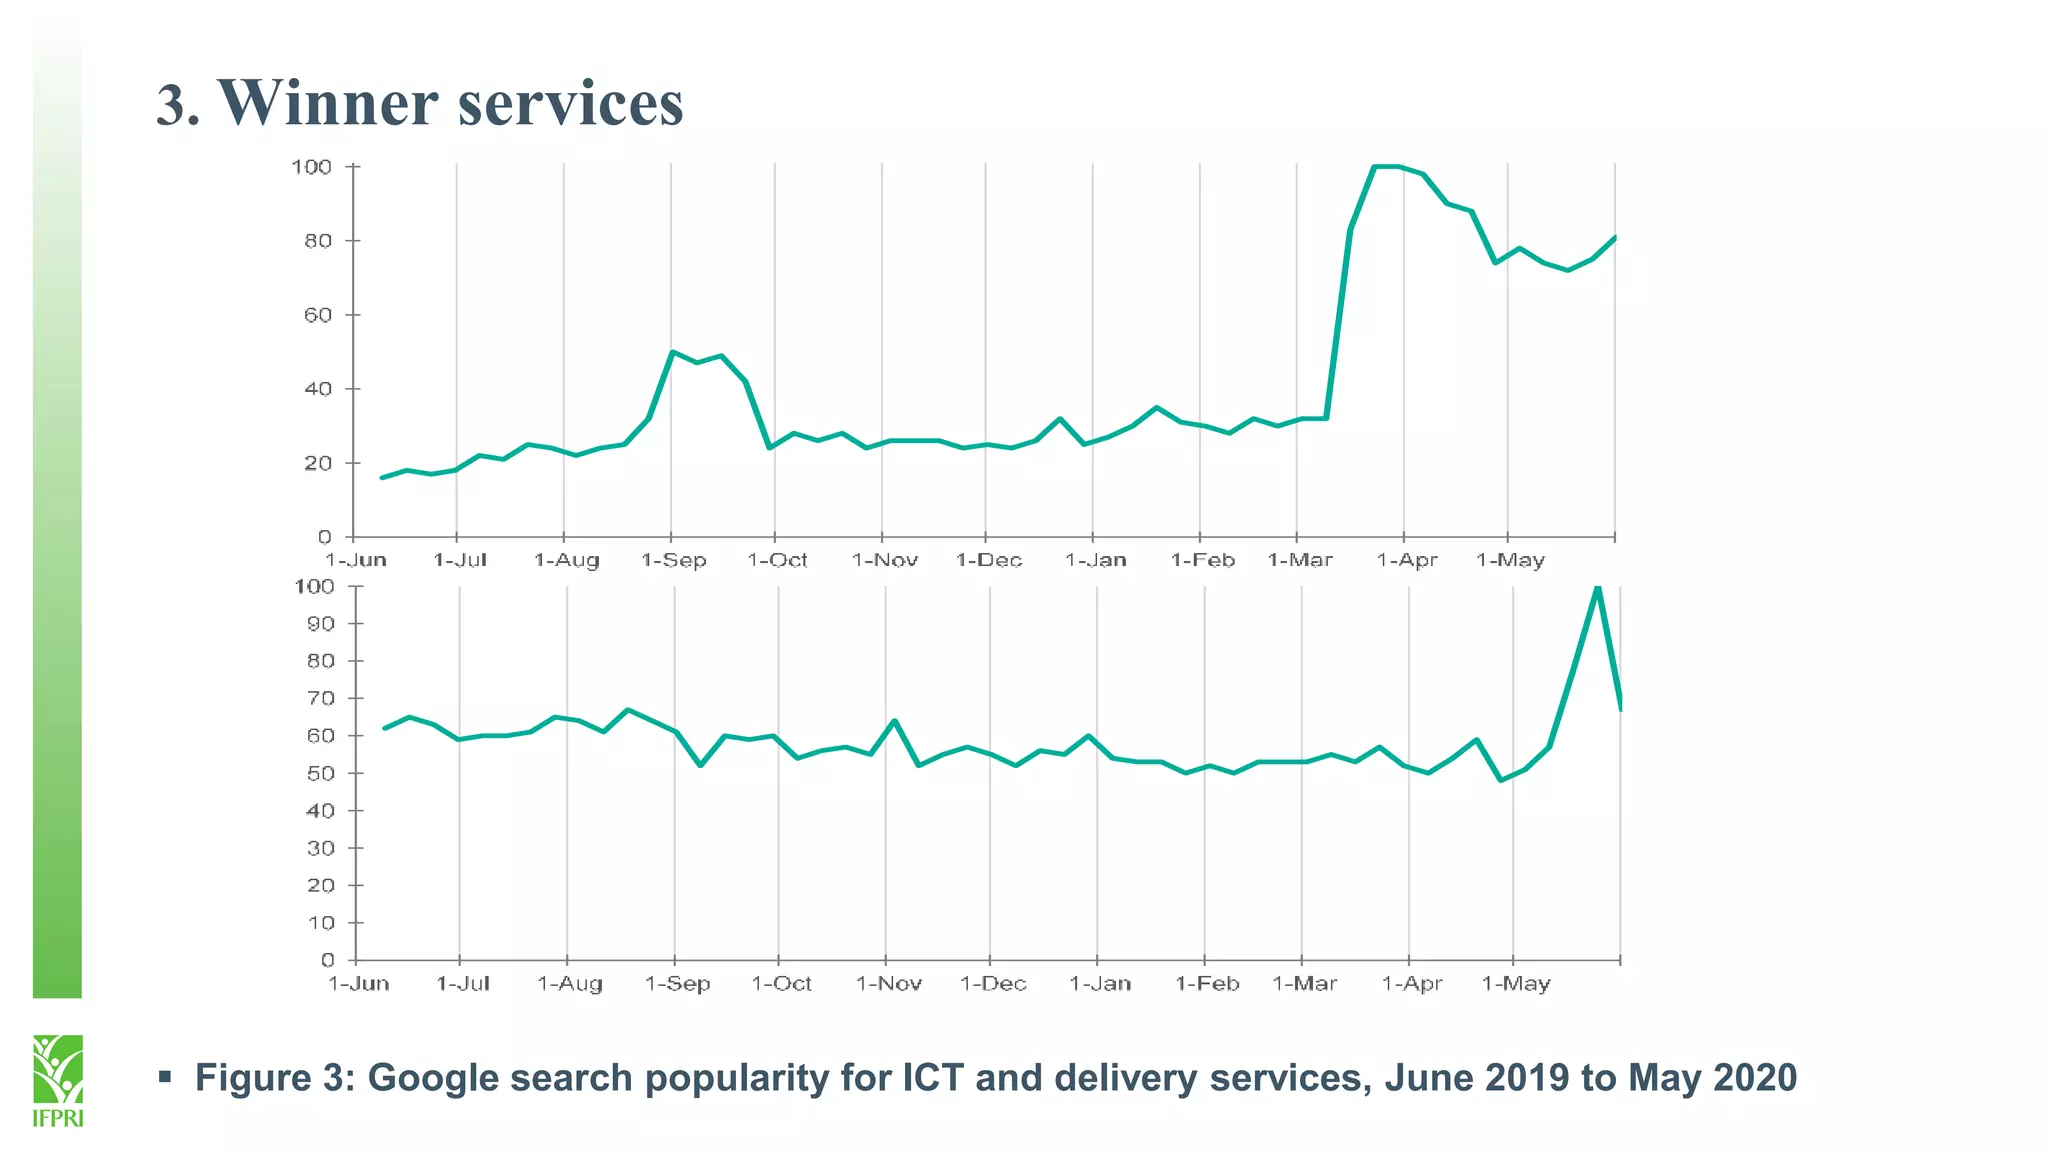
Winners and losers from COVID-19:
Evidence from Google search data for Egypt
Kibrom Abay, Research Fellow, IFPRI
IFPRI-Egypt Seminar| March 02, 2021
1. Introduction
 COVID-19 is disrupting the livelihoods of billions of people across the globe.
 Besides the obvious health impacts, there have been severe damages to national
economies
 These economic consequences are expected to vary across sectors and value
chains.
 The consequences and damages are also expected to depend on governments’
responses.
 These responses can only be effective if they are informed by evidence on who
loses (benefits) and by how much.
 Empirical evidence on the size and breadth of damages across various sectors and
value chains remain scant.
 In these contexts, we propose using unconventional sources of high-frequency
data, Google search
2. Google search data for measuring demand for services
 The Google search index measures the extent to which a particular term or service
is searched using the Google search engine.
 The relevance of these data for understanding human behavior and human
activities is increasing with the penetration of internet across the world.
 Recent studies are using these data for understanding and quantifying the impact
of COVID-19 on mental health (Brodeur et al. 2020), economic anxiety (Fetzer et
al. 2020).
 Using these historical and near real-time time Google search data, we carefully
examine the evolution of demand for various services before and after the pandemic.
3. Loser services
 After the first COVID-19 confirmed case in Egypt on 14 February, Google search
intensity for restaurants and hotels started to decline sharply.
 Figure 1: Google search popularity for restaurants and hotels in Egypt, June 2019 to May 2020
First COVID-19
confirmed case (Feb
14)
Government closes
restaurants, cafes, bars and
night clubs (Mar 18)
Government allows hotels to
operate with 25% capacity for
local tourism (May 15)
0
10
20
30
40
50
60
70
80
90
100
1-Jun 1-Jul 1-Aug 1-Sep 1-Oct 1-Nov 1-Dec 1-Jan 1-Feb 1-Mar 1-Apr 1-May
3. Loser services
 Figure 1: Google search popularity for air travel and tourism, June 2019 to May 2020
Source: Google Trends (https://www.google.com/trends).
3. Winner services
 Figure 3: Google search popularity for ICT and delivery services, June 2019 to May 2020
4. Concluding Remarks
 We find that demand for those services that require face-to-face interaction,
significantly dipped after Egypt detected the first COVID-19 case
 Demand for services that substitute or reduce personal interactions, such as ICT
and delivery services, have enjoyed a significant boost.
 These results suggest that individuals and enterprises operating in these sectors
are experiencing heterogenous impacts
 Our analysis highlights the potential of near real-time "big data" to substitute
and complement conventional data sources inform immediate and medium-term
policy responses.

Kibrom Abay (IFPRI) • 2021 IFPRI Egypt Seminar Series: "COVID-19 lessons for rebuilding resilient value chains and agri-food system"

  • 1.
    Winners and losersfrom COVID-19: Evidence from Google search data for Egypt Kibrom Abay, Research Fellow, IFPRI IFPRI-Egypt Seminar| March 02, 2021
  • 2.
    1. Introduction  COVID-19is disrupting the livelihoods of billions of people across the globe.  Besides the obvious health impacts, there have been severe damages to national economies  These economic consequences are expected to vary across sectors and value chains.  The consequences and damages are also expected to depend on governments’ responses.  These responses can only be effective if they are informed by evidence on who loses (benefits) and by how much.  Empirical evidence on the size and breadth of damages across various sectors and value chains remain scant.  In these contexts, we propose using unconventional sources of high-frequency data, Google search
  • 3.
    2. Google searchdata for measuring demand for services  The Google search index measures the extent to which a particular term or service is searched using the Google search engine.  The relevance of these data for understanding human behavior and human activities is increasing with the penetration of internet across the world.  Recent studies are using these data for understanding and quantifying the impact of COVID-19 on mental health (Brodeur et al. 2020), economic anxiety (Fetzer et al. 2020).  Using these historical and near real-time time Google search data, we carefully examine the evolution of demand for various services before and after the pandemic.
  • 4.
    3. Loser services After the first COVID-19 confirmed case in Egypt on 14 February, Google search intensity for restaurants and hotels started to decline sharply.  Figure 1: Google search popularity for restaurants and hotels in Egypt, June 2019 to May 2020 First COVID-19 confirmed case (Feb 14) Government closes restaurants, cafes, bars and night clubs (Mar 18) Government allows hotels to operate with 25% capacity for local tourism (May 15) 0 10 20 30 40 50 60 70 80 90 100 1-Jun 1-Jul 1-Aug 1-Sep 1-Oct 1-Nov 1-Dec 1-Jan 1-Feb 1-Mar 1-Apr 1-May
  • 5.
    3. Loser services Figure 1: Google search popularity for air travel and tourism, June 2019 to May 2020 Source: Google Trends (https://www.google.com/trends).
  • 6.
    3. Winner services Figure 3: Google search popularity for ICT and delivery services, June 2019 to May 2020
  • 7.
    4. Concluding Remarks We find that demand for those services that require face-to-face interaction, significantly dipped after Egypt detected the first COVID-19 case  Demand for services that substitute or reduce personal interactions, such as ICT and delivery services, have enjoyed a significant boost.  These results suggest that individuals and enterprises operating in these sectors are experiencing heterogenous impacts  Our analysis highlights the potential of near real-time "big data" to substitute and complement conventional data sources inform immediate and medium-term policy responses.