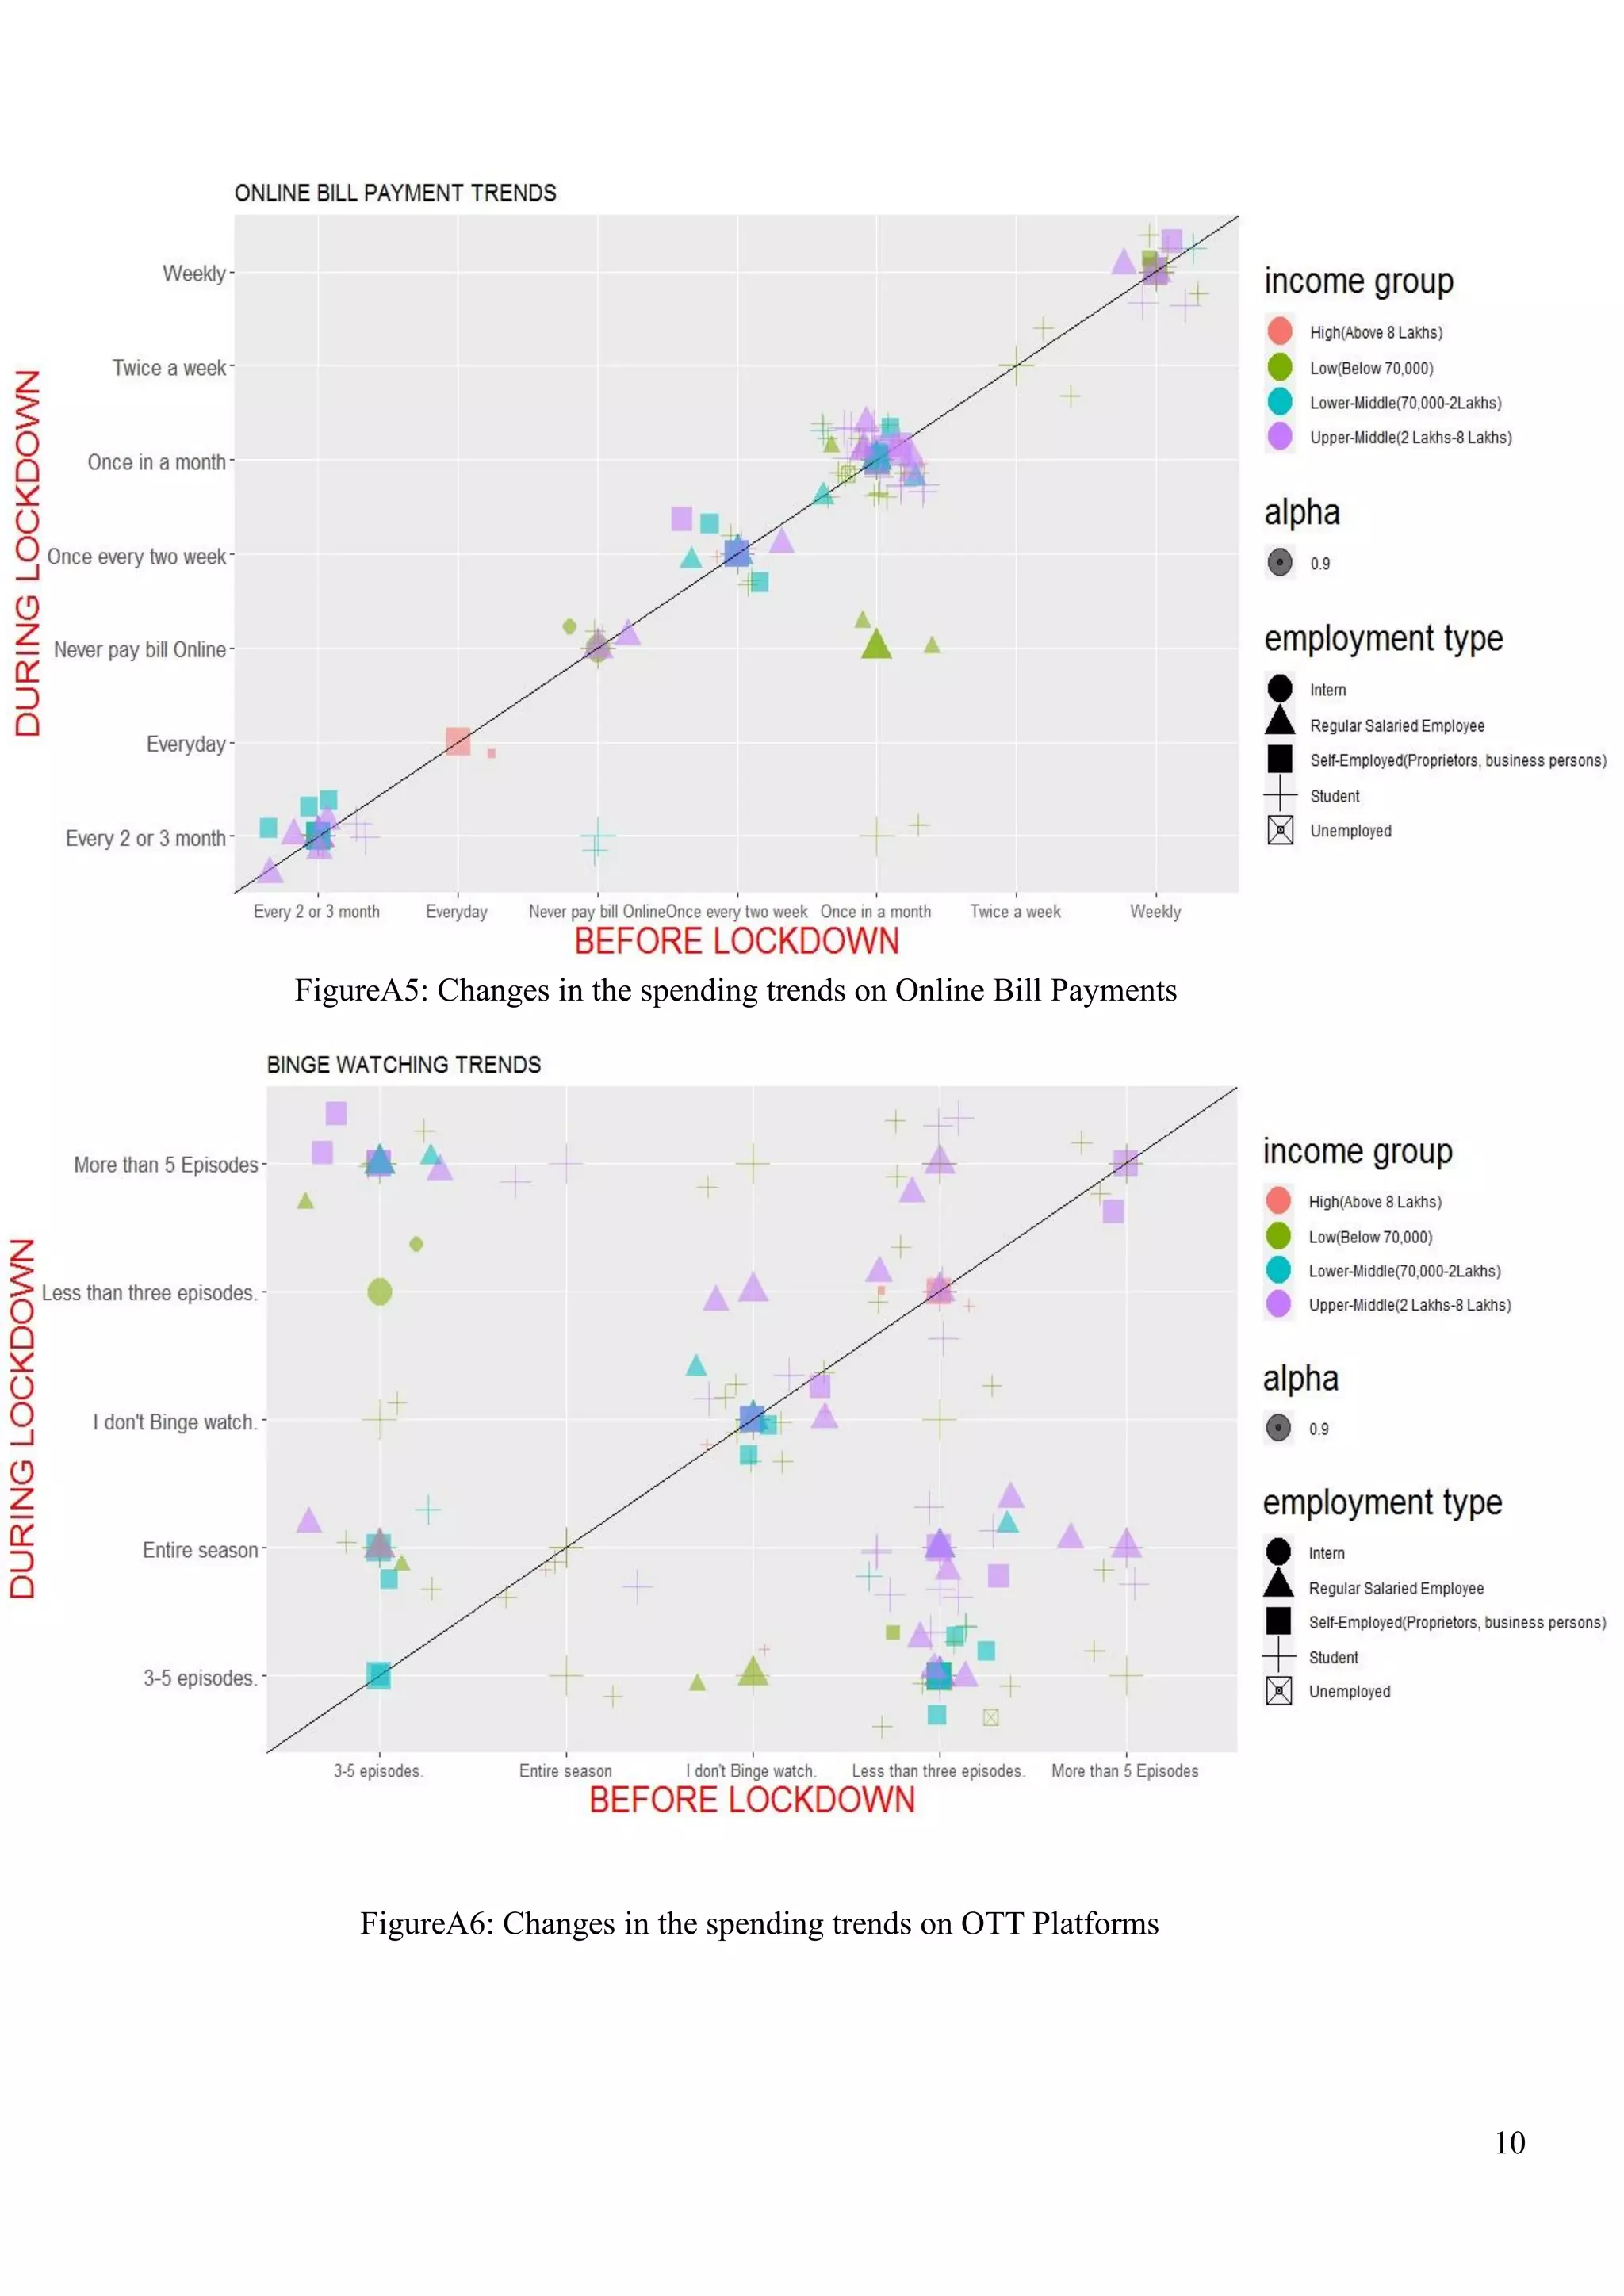
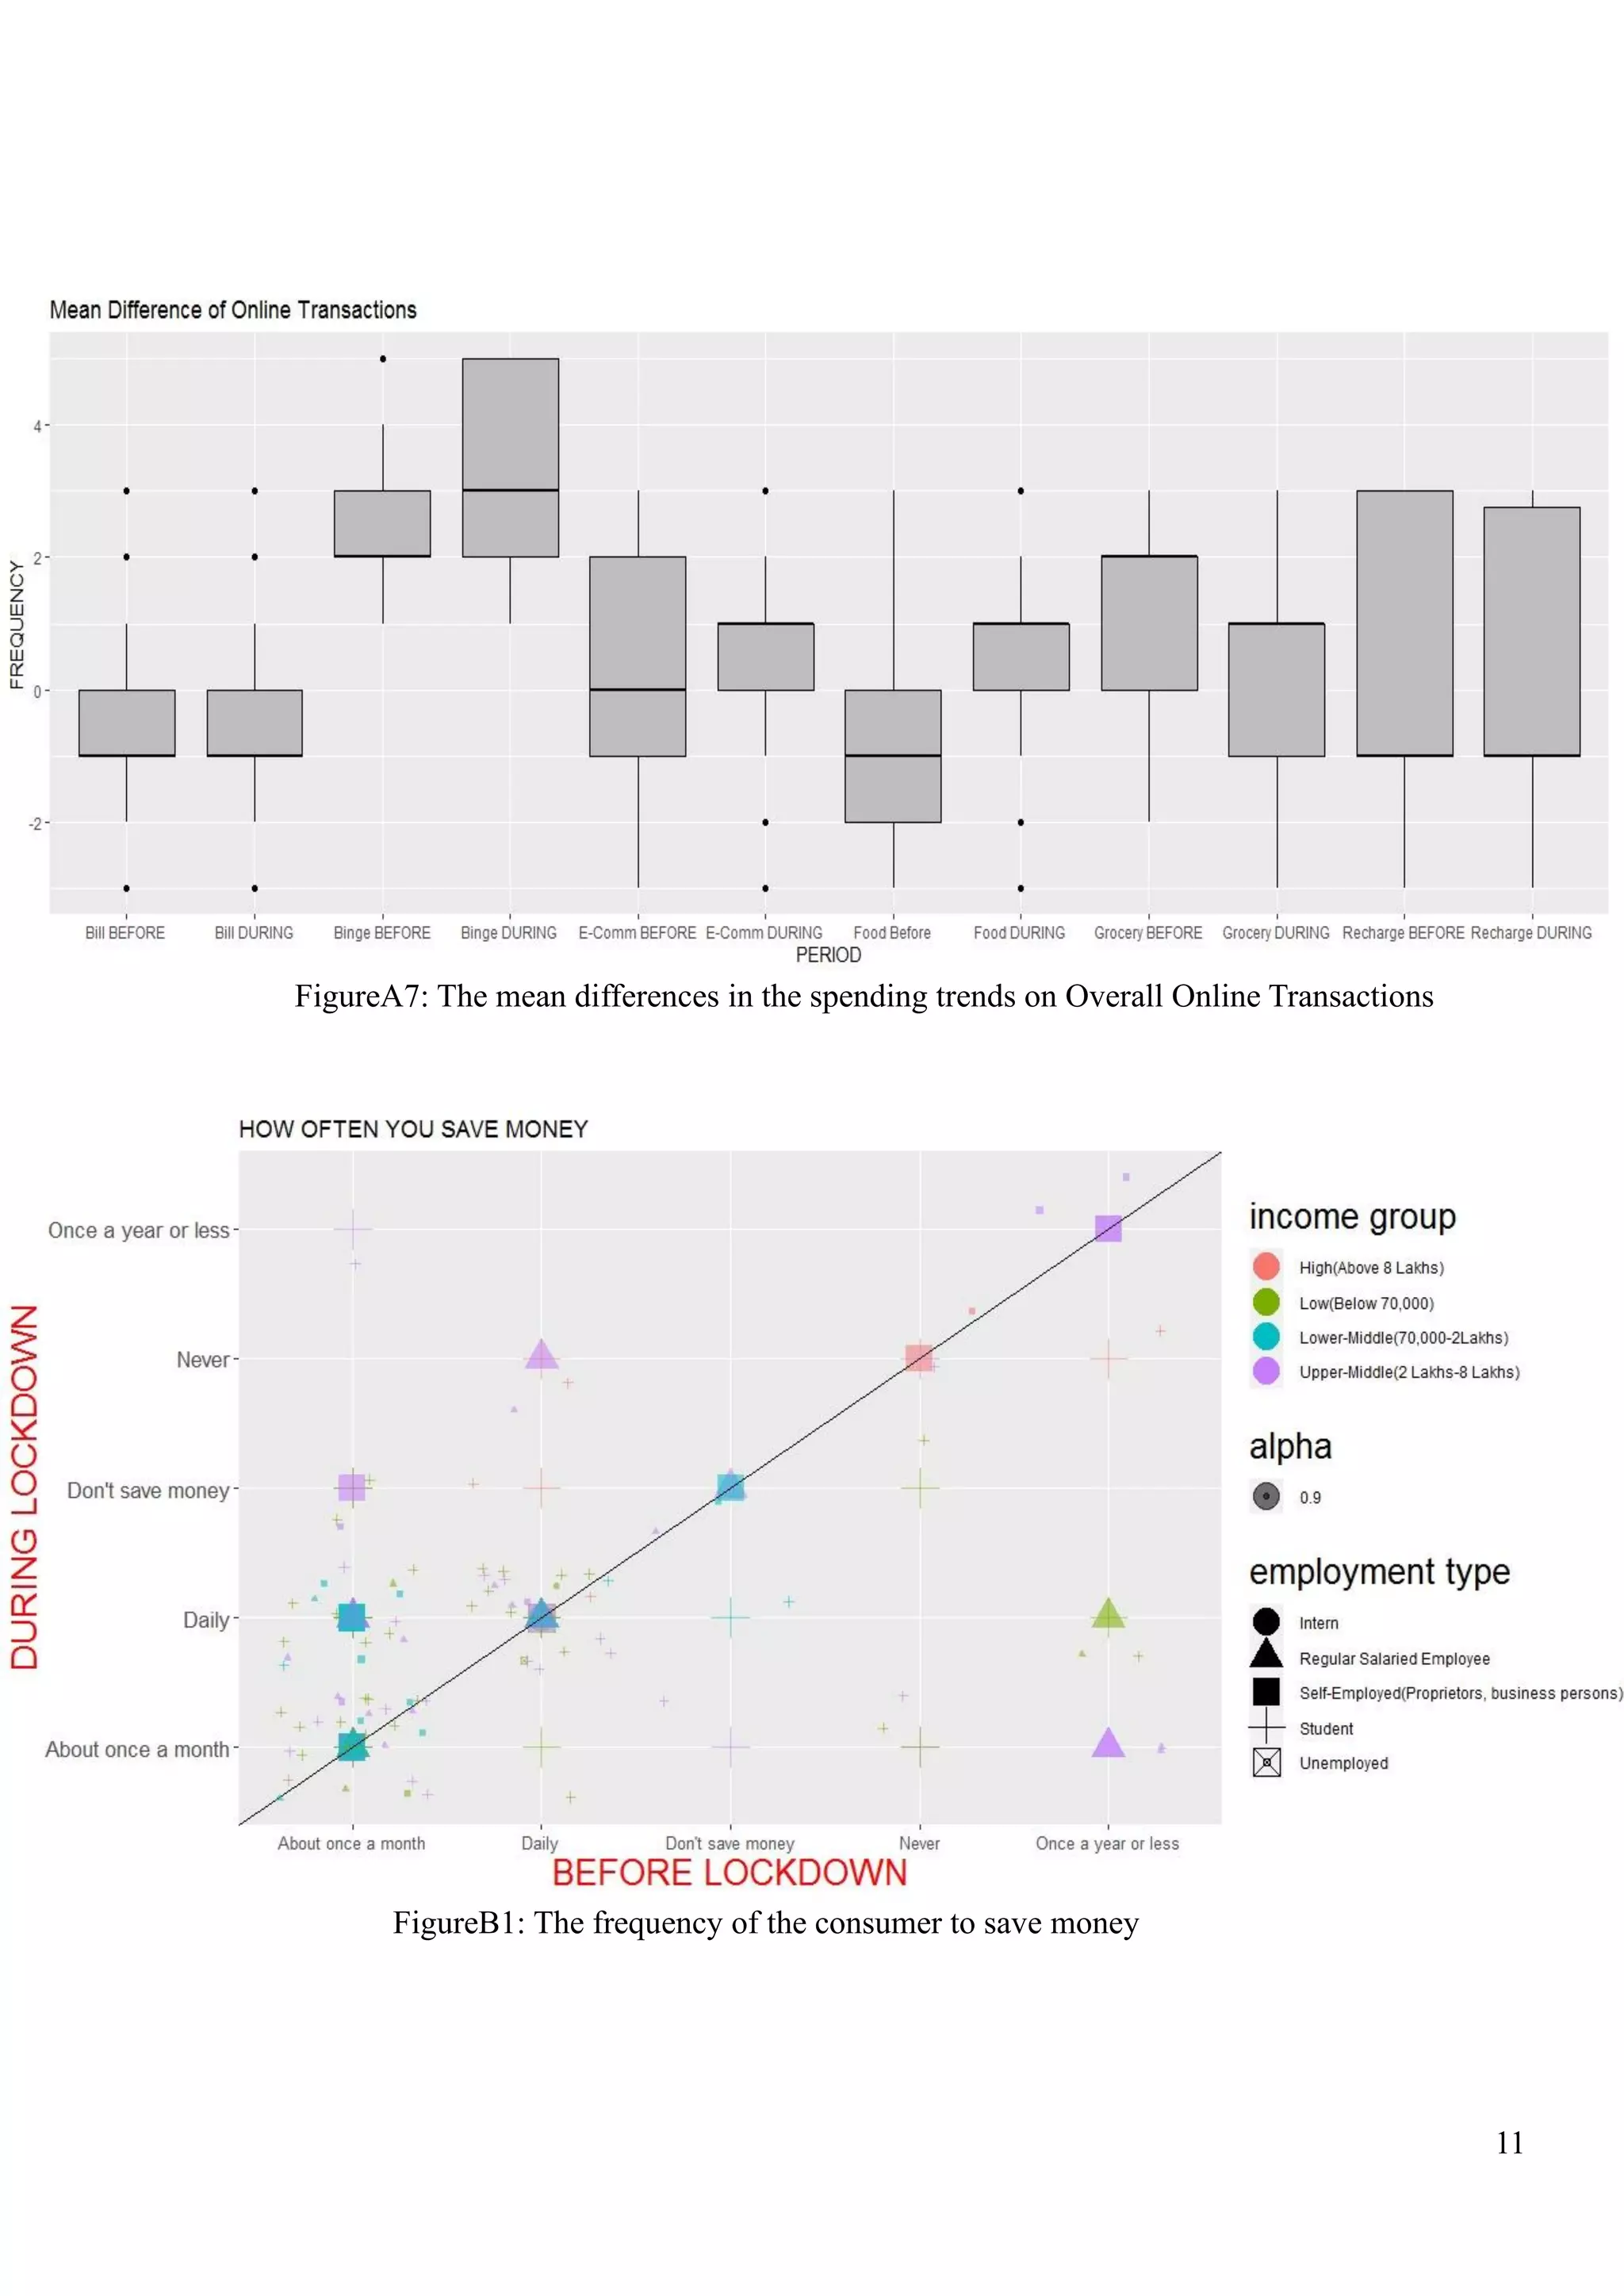
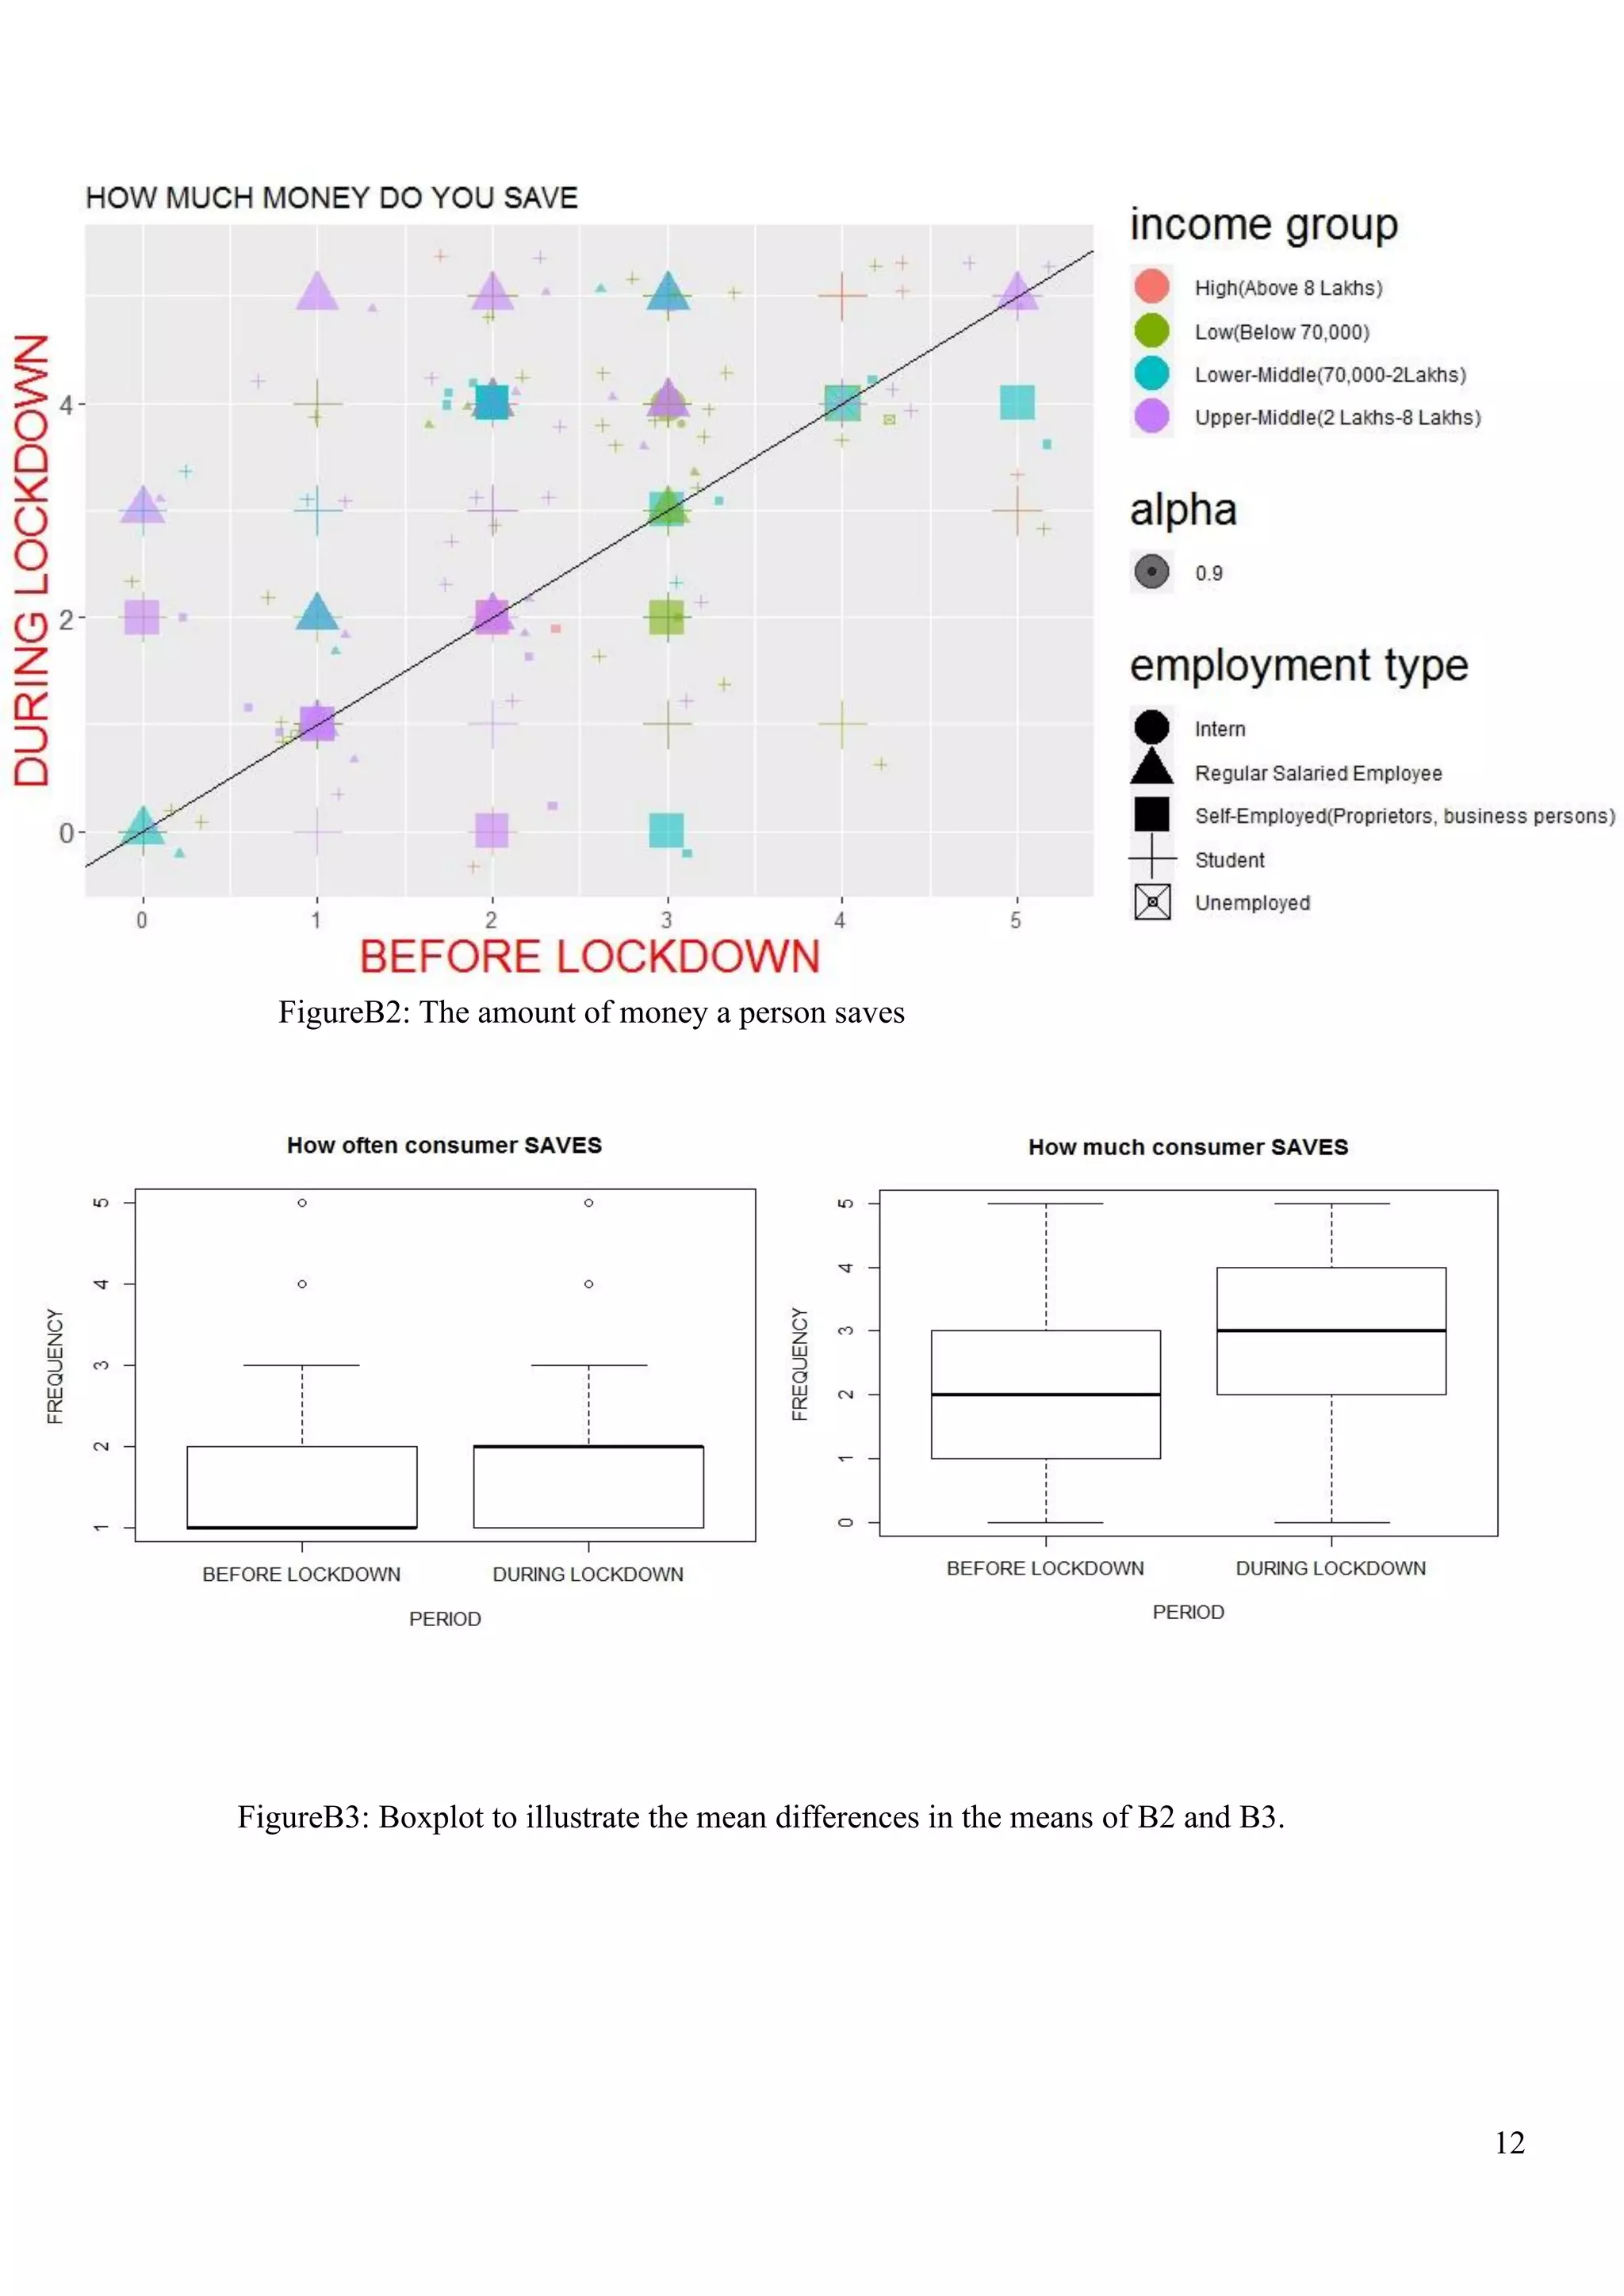
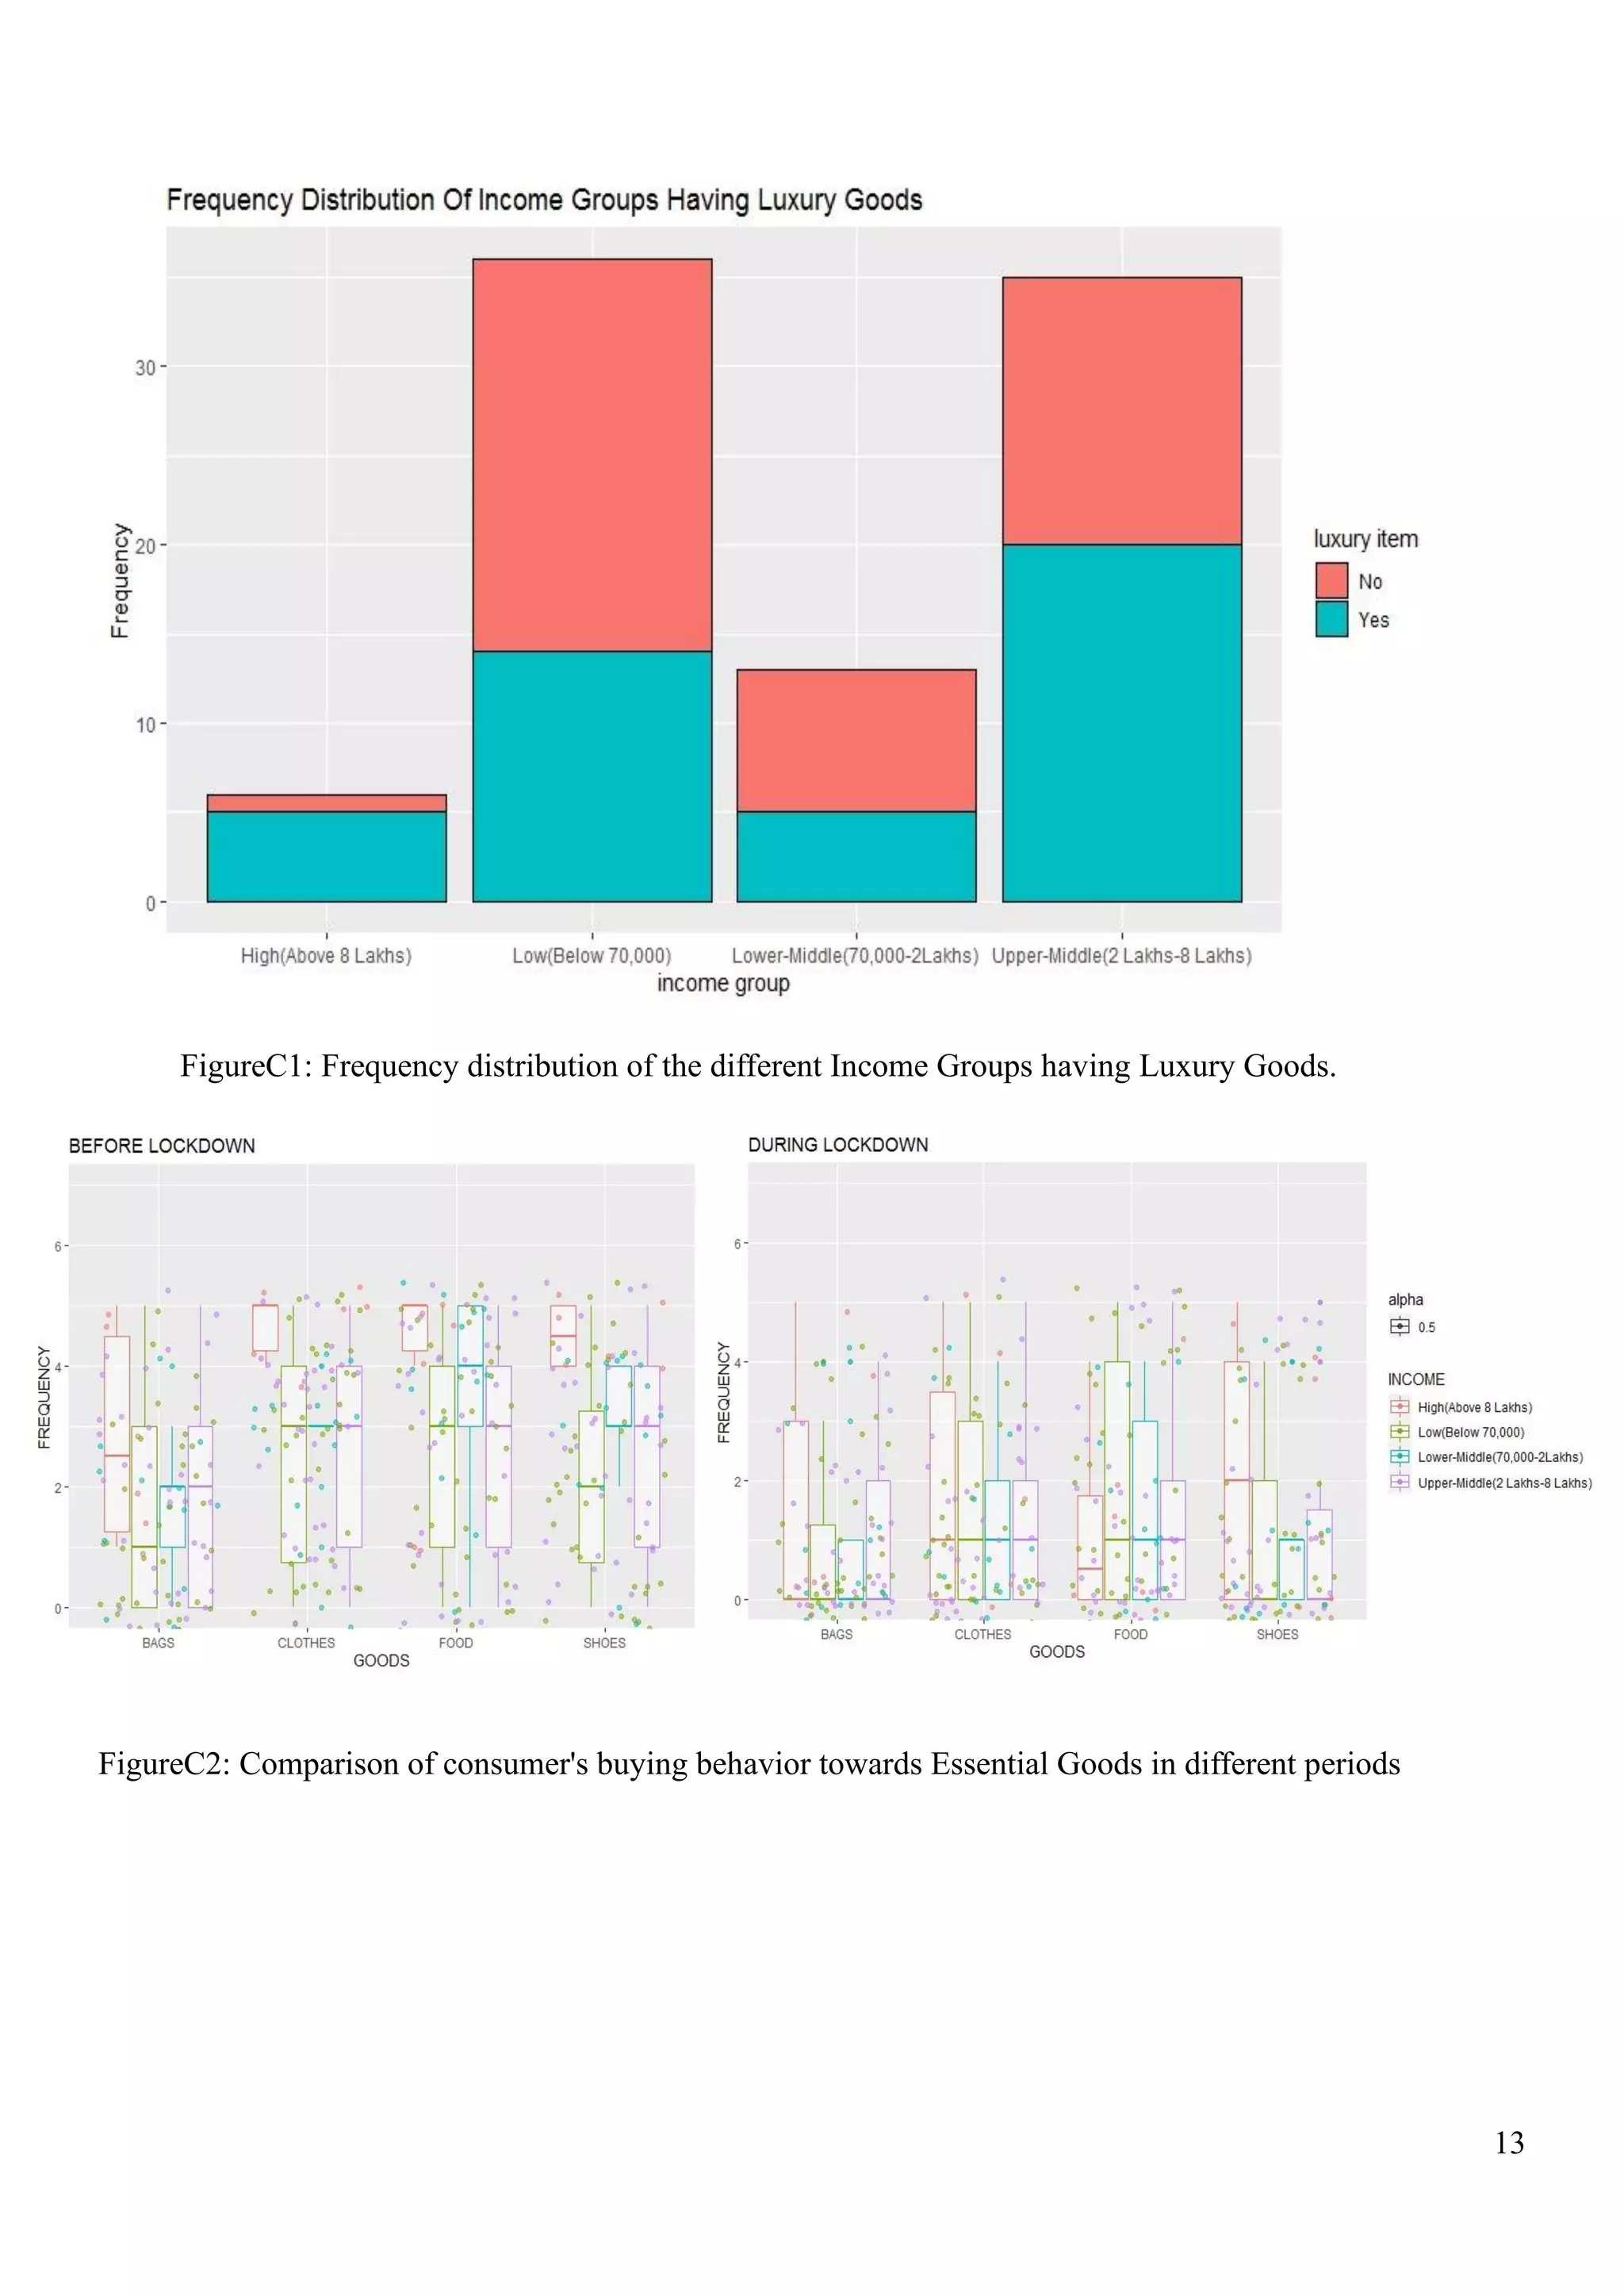
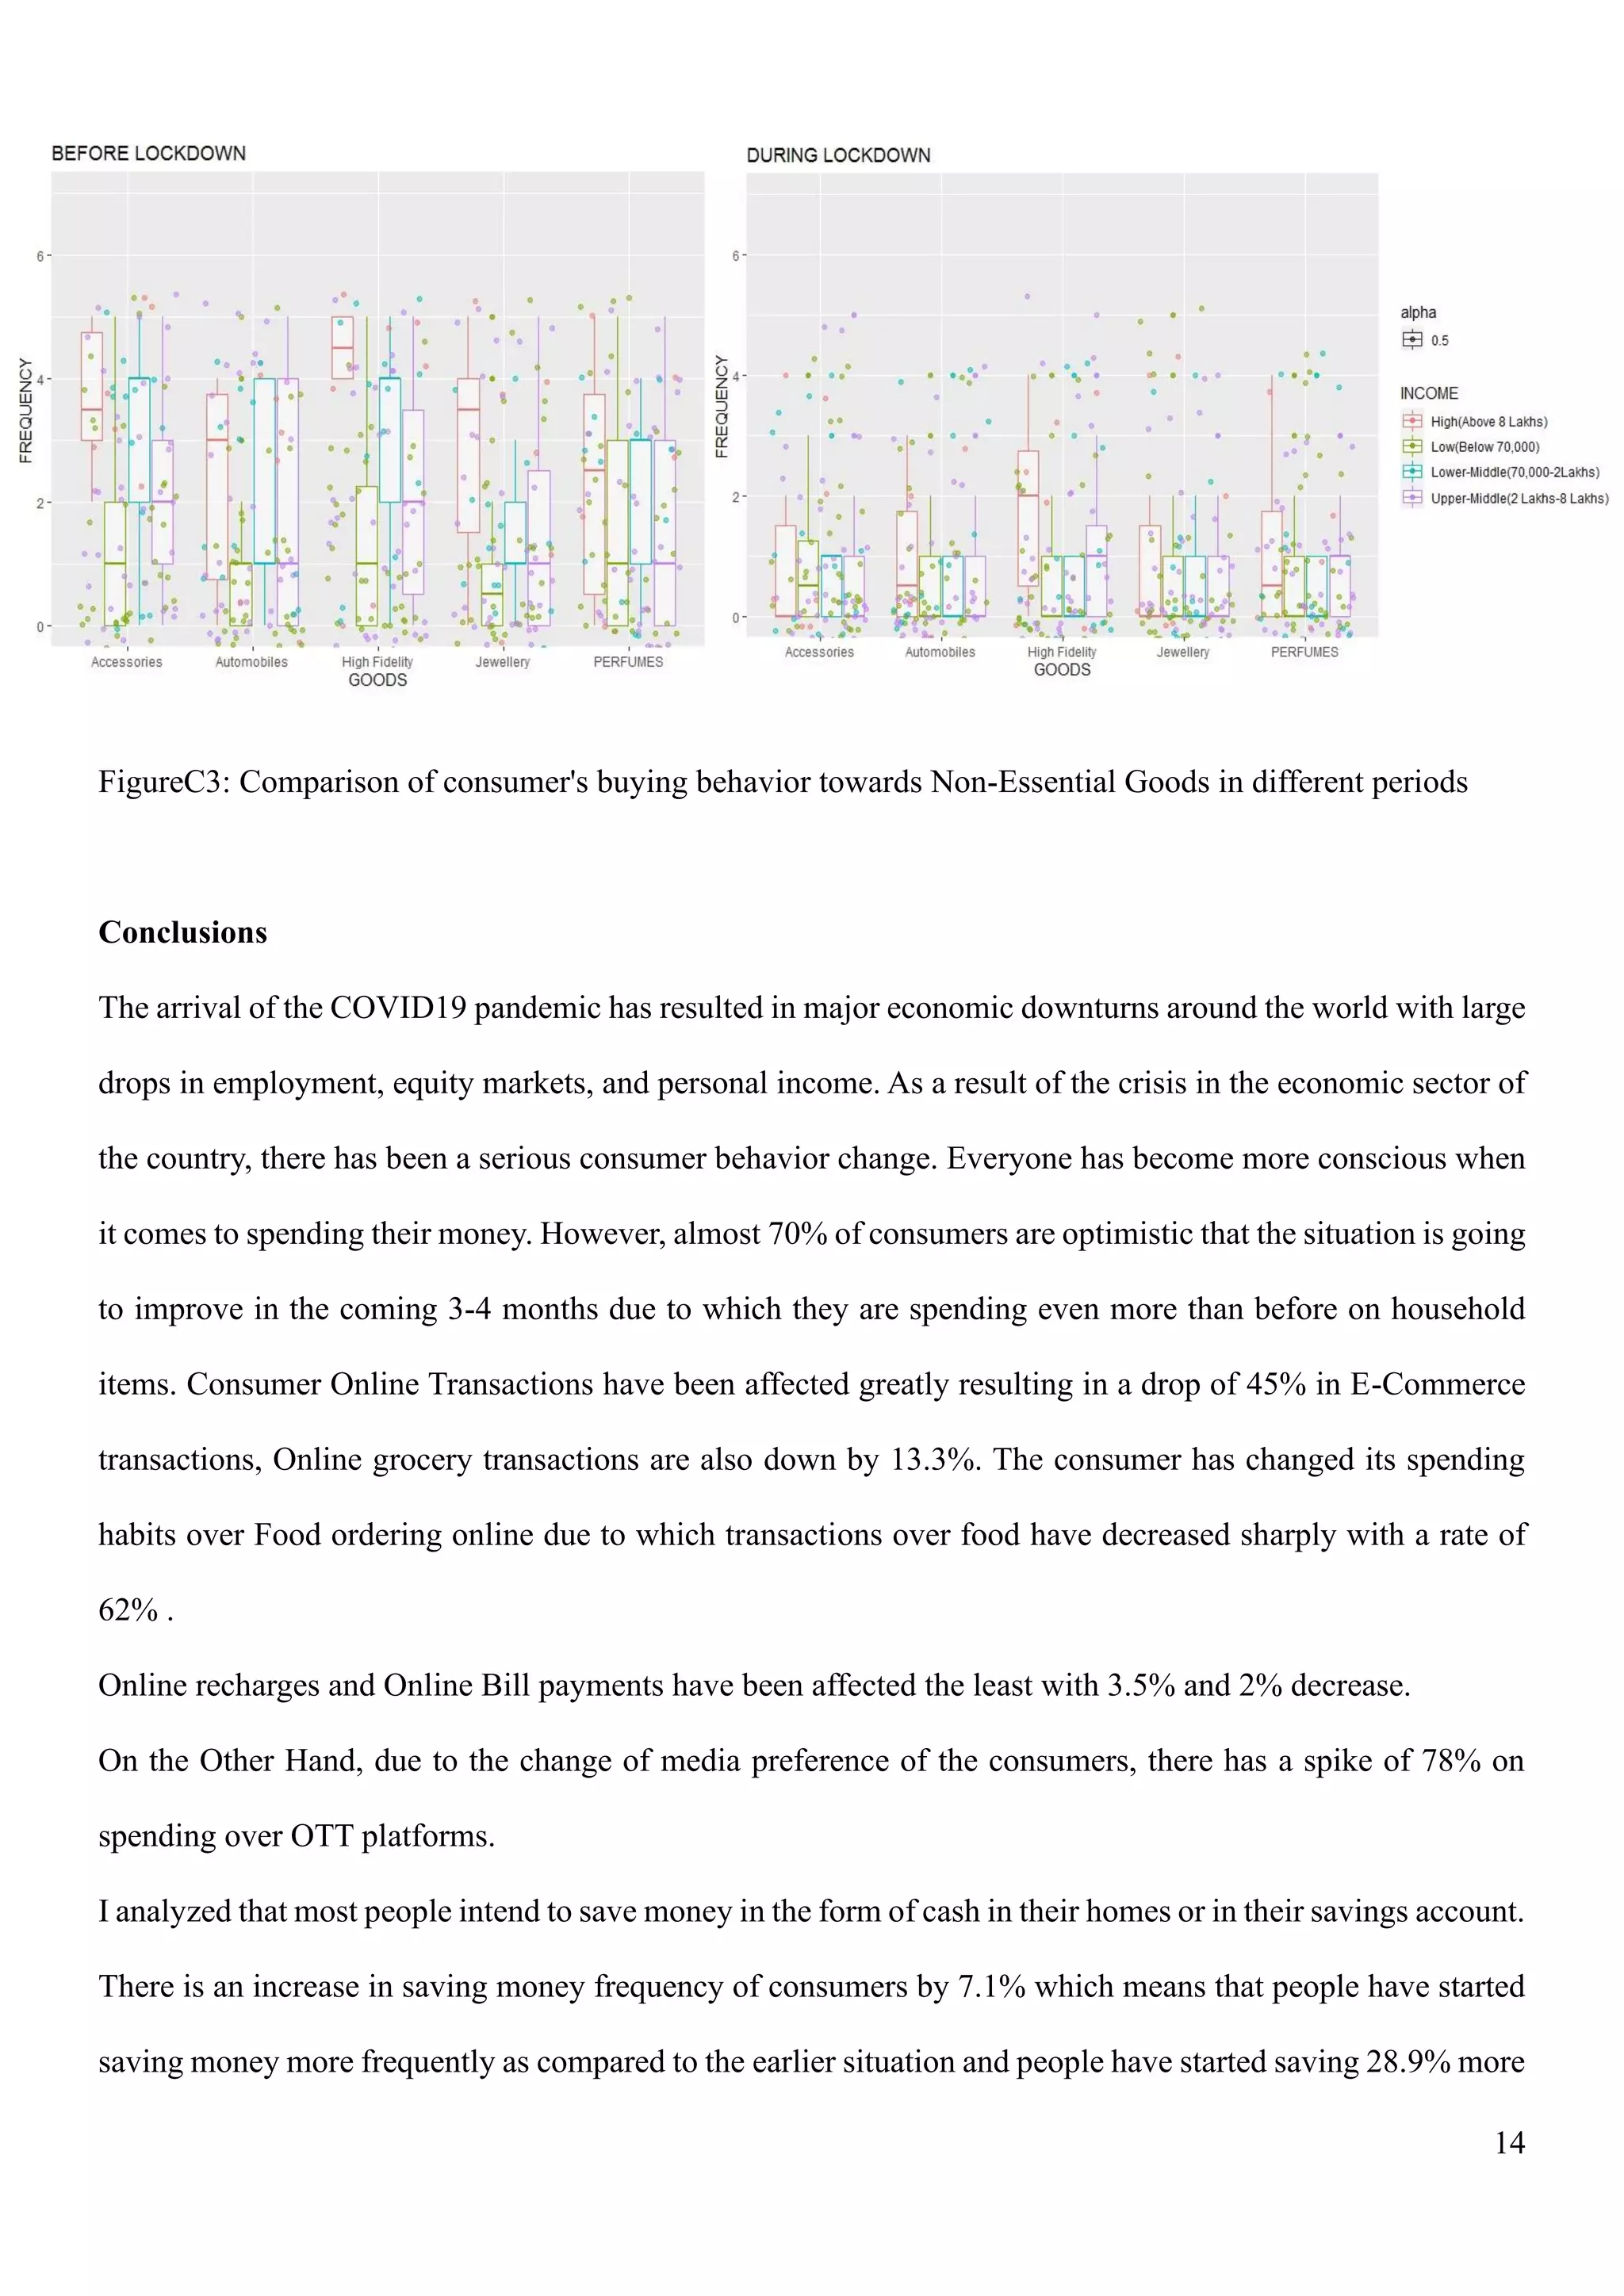
This report analyzes how consumers are reining their spendings in 2 two different periods i.e. pre lockdown and during the lockdown due to COVID-19 and then analyzing the changes in the behavior of the consumer that has been taking place. Hence using these insights to forecast the upcoming period.
Changes in consumer spending habits due to covid 19
1. Changes in Consumer Spending Habits due to COVID-19
Paras Lakhotra, MBA (Operations and Business Analytics)
2. 2
Abstract
This report analyzes how consumers are reining their spendings in 2 two different periods i.e. pre lockdown
and during the lockdown due to COVID-19 and then analyzing the changes in the behavior of the consumer
that has been taking place. Hence using these insights to forecast the upcoming period. Through this analysis,
I found that there has been a sure shift in the spending habits of the consumers. As consumers grapple with
uncertainty, their buying behavior becomes more erratic. They have reduced spending over all non-essential
products and services. However, almost 73% of the consumers are showing optimism that the situation is
going to be okay in the coming 3-4 months. As a result, they have increased their spendings on household
planning and to buy groceries and other important supplies. Due to a decrease in the overall economy however,
the imposition of lockdowns can account for much of the decline in employment in recent months as well as
declines in consumer spending.
3. 3
Introduction
The COVID-19 outbreak has unleashed a world of uncertainty about health, social institutions, and the
economy. Consumer spending changed almost instantly – stocking up on food and household goods, on the
one hand, but at the same time cutting back on travel and entertainment. Many consumers are changing their
lending behavior, too – some relying more on credit card debt to make ends meet with limited income, others
potentially skipping loan payments. On 24 March 2020, the Government of India under Prime Minister
Narendra Modi ordered a nationwide lockdown for 21 days, limiting movement of the entire 1.3 billion
population of India as a preventive measure against the COVID-19 pandemic in India. As the end of the first
lockdown period approached, state governments and other advisory committees recommended extending the
lockdown and this extension is still going on in the form of various versions of the lockdown. The COVID-
19 pandemic represents a grave risk to public health and most governments have attempted to contain the
virus by shutting down parts of the economy. Beyond the direct health consequences, the economic costs have
been staggering: millions of workers have lost their jobs and trillions of rupees of stock market wealth have
been destroyed.
As a result of the crisis in the economic sector of the country, there has been a serious consumer behavior
change. Everyone has become more conscious when it comes to spending their money. In this analysis report,
I have studied the previous patterns of regular consumer spending and compared it with the data of the current
situation to analyze the change by using some statistical tools and visualization techniques and hence using
this knowledge to predict the upcoming trend.
In this analysis, I have divided consumer spending into 3 groups which are: - Online Transactions, Saving
cash, and Essential & Non-Essential Luxury items. Online transactions in itself are divided into various sub-
categories like E-commerce, OTT platforms, etc. Money savings intend to be affected by the perceptions of
people of different age groups and by the employment status of the individual. Luxury items are affected
majorly by the financial status of an individual.
4. 4
The analysis is divided into 3 parts, Firstly the data is collected from online sources and I also surveyed a
sample of 500 people in which they were given a questionnaire having questions related to the changes that
they have undergone in the corona period. Secondly, after collecting the data, I analyzed the aggregate
statistics across survey waves to study how the arrival COVID19 affected spending patterns by using statistical
tool like Paired-T test and various visualization techniques to get clear insights of matter and check whether a
serious change in spending pattern has happened or not.
Thirdly, in the end, I used the results of my descriptive analysis to predict the future trend in consumer
spending patterns.
Consumers were also asked about their beliefs regarding the improvement of the situation in the coming
months to carry out a sentimental analysis which helped in predicting the upcoming trends
Data
This section describes the survey design we use to elicit expectations, plans, and past spending decisions. I
surveyed a sample size of 500 people which were categorized based on general demographic information such
as age, gender, location, etc. The questionnaire recorded the information on the consumer behavior change in
the 3 groups i.e. Online Transactions, Money savings, Luxury items for both pre-lockdown and during-
lockdown period, and had ample questions that were required to do the proper analysis. The sample is equally
divided into consumers of different age groups and has a ratio of almost 1:1 in terms of gender. Most of the
consumers put up in urban areas of the country and are fairly active when it comes to making an online
transaction. This section describes the survey design we use to elicit expectations, plans, and past spending
decisions. The data collected is categorical in nature which is further converted into numerical scale such that
I can apply statistical tools on the data and also use it for visualizations.
5. 5
Paired-T test
A paired t-test is used to compare two population means where you have two samples in which observations
in one sample can be paired with observations in the other sample. Examples of where this might occur are:
-
• Before-and-after observations on the same subjects
• A comparison of two different methods of measurement or two different treatments where the
measurements/treatments are applied to the same subjects
Suppose a sample of n students were given a diagnostic test before studying a particular module and then
again after completing the module. We want to find out if, in general, our teaching leads to improvements in
students’ knowledge/skills (i.e. test scores). We can use the results from our sample of students to draw
conclusions about the impact of this module in general.
Let x = test score before the module, y = test score after the module
To test the null hypothesis that the true mean difference is zero, the procedure is as follows:
1. Calculate the difference (di = yi −xi) between the two observations on each pair, making sure you distinguish
between positive and negative differences.
2. Calculate the mean difference, ¯ d.
3. Calculate the standard deviation of the differences, sd, and use this to calculate the standard error of the
mean difference,
SE(d) = Sd/√n
4. Calculate the t-statistic, which is given by T =d/SE(d)
. Under the null hypothesis, this statistic follows a t-distribution with n−1 degrees of freedom.
5. Use tables of the t-distribution to compare your value for T to the tn−1 distribution. This will give the p-value
for the paired t-test.
6. 6
Results
After running a Paired t-test on each category with a confidence interval of 99%, the results of the Paired t-
test prove that there have been significant changes in almost every sub-category in the Spending Habits of the
consumers. The results of the Paired t-test are given below:
Sub-Categories Mean difference
(DURING-BEFORE)
T-value P-Value
Shopping -1.1 -7.5044 4.461e-11
Grocery -0.0222 -0.1108 0.912
Food -2.0444 -9.8679 6.002e-16
Recharge payments -0.07777 -2.1528 0.03404
Bill payments -0.0444 -1.2692 0.2077
OTT platforms 1.0333 8.4109 6.203e-13
Results of Paired t-test on Online Transactions sub-categories
Sub-Categories Mean difference
(BEFORE-DURING)
T-value P-Value
Frequency of
saving money
0.1444 1.385 0.1695
How much
money is saved
0.6555 4.2529 5.198e-05
Result of Paired t-test on Savings money
Results of Paired t-test on luxury goods
Online transactions: -
The effect on spending over Online Transaction varies sub-category wise. I estimated a large drop of 45% in
the E-commerce purchasing habits of the consumers whereas there is 13.3% less purchase of groceries on
online grocery stores as compared to the previous trends. Online Food ordering is also down as consumer
spending over fast food has experienced a very large decrease of 62% due to changes in the preference of the
consumers from fast food to home food as there is a good threat of getting infected when ordered food from
outside. I estimated a small drop in aggregate spending on Online recharges and Online Bills payments of
around 3.5% and 2.5% respectively. Spending over OTT (Over The Top) platforms like Netflix,Amazon Prime,
Sub-Categories Mean difference
(BEFORE-DURING)
T-value P-Value
Intent to buy
Luxury Goods
-0.8222 -87237 1.401e-13
Essential Goods -4.7666 -7.314 1.084e-10
Non-essential
Goods
0 NA NA
7. 7
etc. on the other hand have increased tremendously with a rate of 78% as people are spending more time in
binge-watching due to ample free time.
Savings Money
There is an increase in saving money frequency of consumers by 7.1% and people have started saving 28.9%
more amount of money than earlier.
Luxury Goods
Luxury Goods market is down as there is a drop of 61.5% in the intent of consumers to purchase luxury goods
in the COVID-19. I estimated a drop of 47.6% in the purchasing behavior of consumers towards Essential
luxury goods. Whereas Non-Essential Luxury Goods have not experienced any effect due to COVID-19.
Illustrations
FigureA1. illustrates the changes in the spending trends on E-Commerce Platforms.
FigureA2. illustrates the changes in the spending trends on Online Grocery Stores.
FigureA3. illustrates the changes in the spending trends on Online Food Ordering.
FigureA4. illustrates the changes in the spending trends on Online Recharges.
FigureA5. illustrates the changes in the spending trends on Online Bill Payments.
FigureA6. illustrates the changes in the spending trends on OTT Platforms.
FigureA7. Illustrates the mean differences in the spending trends on Overall Online Transactions.
FigureB1. illustrates the frequency of the consumer to save money.
FigureB2. illustrates the amount of money a person saves.
FigureB3 boxplot to illustrate the mean differences in the means of B2 and B3.
FigureC1. illustrates the frequency distribution of the different Income Groups having Luxury Goods.
FigureC2. illustrates the comparison of consumer's buying behavior towards Essential Goods in different
periods.
FigureC3. illustrates the comparison of consumer's buying behavior towards Non-Essential Goods in different
periods.
8. 8
Figure A1: Changes in the spending trends on E-Commerce Platforms
FigureA2: Changes in the spending trends on Online Grocery Stores
9. 9
FigureA3: Changes in the spending trends on Online Food Ordering
FigureA4: Changes in the spending trends on Online Recharges
10. 10
FigureA5: Changes in the spending trends on Online Bill Payments
FigureA6: Changes in the spending trends on OTT Platforms
11. 11
FigureA7: The mean differences in the spending trends on Overall Online Transactions
FigureB1: The frequency of the consumer to save money
12. 12
FigureB2: The amount of money a person saves
FigureB3: Boxplot to illustrate the mean differences in the means of B2 and B3.
13. 13
FigureC1: Frequency distribution of the different Income Groups having Luxury Goods.
FigureC2: Comparison of consumer's buying behavior towards Essential Goods in different periods
14. 14
FigureC3: Comparison of consumer's buying behavior towards Non-Essential Goods in different periods
Conclusions
The arrival of the COVID19 pandemic has resulted in major economic downturns around the world with large
drops in employment, equity markets, and personal income. As a result of the crisis in the economic sector of
the country, there has been a serious consumer behavior change. Everyone has become more conscious when
it comes to spending their money. However, almost 70% of consumers are optimistic that the situation is going
to improve in the coming 3-4 months due to which they are spending even more than before on household
items. Consumer Online Transactions have been affected greatly resulting in a drop of 45% in E-Commerce
transactions, Online grocery transactions are also down by 13.3%. The consumer has changed its spending
habits over Food ordering online due to which transactions over food have decreased sharply with a rate of
62% .
Online recharges and Online Bill payments have been affected the least with 3.5% and 2% decrease.
On the Other Hand, due to the change of media preference of the consumers, there has a spike of 78% on
spending over OTT platforms.
I analyzed that most people intend to save money in the form of cash in their homes or in their savings account.
There is an increase in saving money frequency of consumers by 7.1% which means that people have started
saving money more frequently as compared to the earlier situation and people have started saving 28.9% more
15. 15
amount of money than earlier which implies that the amount of money that they used to save has been
multiplied by 28.9%.
Luxury Goods market is facing a great fall in the consumer's buying frequency by 61.5% as almost every
consumer is shifting towards non-luxury goods during the pandemic. There is a drop of 47.6% in the
purchasing behavior of consumers towards Essential luxury goods. Whereas Non-Essential Luxury Goods
have not experienced any effect due to COVID-19 as Non-Essential Goods are mostly owned by a high-class
society or by those who wish to seek royalty and such class is not getting much into the financial crisis.
If we look at the future trends then there are two situations on which the future trend majorly depends: -
• If the situation improves within 3-4 months.
• If the situation does not improve.
1)If the situation improves within 3-4 months
Industries dealing with online transactions have to undergo some temporary changes according to the safety
measures against COVID-19 and doing so could increase the sales of E-Commerce, Online Grocery stores,
Online Food ordering platforms. The consumer is barring itself from purchase any irrelevant goods at this
moment and only spending money on buying important household groceries. As the consumer is saving money
by not investing money in stock markets or any other investment option that involves risk factors, the stock
market is also expected to face some downfall but afterward once the situation improves it will gain pace
again. OTT platforms will continue to experience a rise in their usage in this period. When it comes to Luxury
goods if we look at the previous trends like demonetization, cash related purchase restrictions followed by
GST have acted as a great deterrent for the growth of the Indian luxury market. However, people had gradually
digested these effects and the Indian luxury market continues to experience a high growth rate. Overall
conditions are expected to improve as consumer spending will shift back to normal if the situation improves
in the coming months
16. 16
2)If the situation does not improve in the coming months
This will surely harm the economy and effects of this will vary from industry to industry. E-Commerce might
continue to fall at this rate as noticed in the current situation and this industry might face recession. Online
Grocery Stores are expected to rise as demand for groceries will increase in the coming time provided that it
improves its safety measures against COVID-19. Sales of Online Food Ordering platforms will also decrease
and this industry also might have to bear recession. Online transactions through recharge and bill payments
will not be much affected by the situation. The usage of OTT platforms will continue to grow at a phenomenal
rate. The stock market will also face the terror of great downfall as the industries will be shut down. Luxury
Goods industries are also prone to face the crisis if this situation continues to go further.
To avoid the situation of recession in each industry, every industry must amend changes to survive on its own.
For some, rebuilding their customer experience by appealing to changing values could result in a profitable,
and perhaps much-needed revival.
E-commerce and other online platforms can undergo some permanent changes in their infrastructure to test
their workforce for coronavirus and services which they offer to increase the safety of consumers.
Looking at the Luxury Goods industry if a recession occurs then the Luxury brands should shift towards the
manufacturing of FMCG products as according to the studies moving to the FMCG sector is expected to be
one of the best choices during the recession.
17. 17
References
Ahuja, M., & Raman, P. (2014). An Empirical Investigation of Online Consumer Purchasing Behavior.
Andersen, A. L., Hansen , E. T., Johannesen , N., & Sheridan, A. (2020). Consumer Responses to the
COVID-19 Crisis: Evidence from Bank Account Transaction Data.
Baker, S. R., Farrokhnia, R. A., Meye, S., Pagel, M., & Yannelisk , C. (2020).
HowDoesHouseholdSpendingRespondtoanEpidemic? ConsumptionDuringthe2020COVID-
19Pandemic.
Chronopoulos , D. K., Lukas , M., & Wilson , J. O. (2020). Consumer Spending Responses to the COVID-19
Pandemic: An Assessment of Great Britain.
Coibion, O., Michael , & Michael . (n.d.). The Cost of the COVID-19 Crisis: Lockdowns, Macroeconomic
Expectations, and Consumer Spending.
Consumer sentiment is evolving as countries around the world begin to reopen. (2020, June 5). Retrieved
from mckinsey: https://www.mckinsey.com/business-functions/marketing-and-sales/our-insights/a-
global-view-of-how-consumer-behavior-is-changing-amid-covid-19#
Evans, J. R. (2017). Business Analytics. PEARSON.
Flemming, G. (n.d.). First look at consumer spending: COVID-19 impact. Retrieved from Kantar:
https://www.kantar.com/inspiration/coronavirus/first-look-at-consumer-spending-covid-19-impact/
Jones`, K. (2020, April 22). How COVID-19 Consumer Spending is Impacting Industries. Retrieved from
visualcapitalist: https://www.visualcapitalist.com/consumer-spending-impacting-industries/
Sethi, N., & Pradhan, H. (2012). The Patterns of Consumption Expenditure in Rural Households of Western
Odisha of India: An Engel Ratio Analysis.
Shier, R. (2004). Paired t-tests.