SlideShare a Scribd company logo
1 of 7
Download to read offline
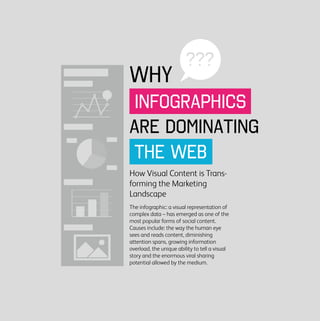
INFOGRAPHICS
THE WEB
???
ARE DOMINATING
WHY
How Visual Content is Trans-
forming the Marketing
Landscape
The infographic: a visual representation of
complex data – has emerged as one of the
most popular forms of social content.
Causes include: the way the human eye
sees and reads content, diminishing
attention spans, growing information
overload, the unique ability to tell a visual
story and the enormous viral sharing
potential allowed by the medium.
90%
1/2
Did you know?
Marketing
VISUAL
of information transmitted
to the brain is visual
of the brain is
dedicated to
visual function
10 Million
Bits per Second
The rate in which the
human retina transmits
data to the brain or
The speed of an
Ethernet connection
The human brain
processes visual
information 60,000
times faster than
text
Approximately
65% of people are
visual learners
Most people only remember
20% of what they read
Marketing persuades consumer's buying
behavior and data visualization enhances that
by factors of recall, memory and brand identity.
The purpose of visualization
is insight, not pictures
Ben Shneiderman
HUMANS ARE
CREATURES
The Estimated
Attention Span
5 times more
Marketers
12 minutes
5 minutes
29,500,000,000,000,000,000,000
SPANS DATA GLUT&
We receive
information daily
than we did in 1986
The average person
is exposed to the
equivalent of
174 newspapers
of data per day
are struggling to
get their messa-
ges heard among
all this noise.
in 2000
in 2012
= 315 times the
number of grains of
sand on the Earth
pieces of information
floating around the world
There’s about
...a wealth of information creates
a poverty of attention...
Herbert A. Simon
OUR SHRINKING ATTENTION
ARE TO BLAME
High Data
Data density can be improved by integrating
ALL visual elements into one page
The average press release contains
400 words
1/1,000th
B A F
H I R
Z D T
3 5 9
8 1 2
7 6 4
Infographics allow you to focus your
message only on the important
information, cutting out all the fluff.
Above all else show the data
Edward Tufte
Density
Infographics Have
which takes about 100
seconds or 10,000 bits per
second to read,
of the human
retina-brain data
capacity
using only
Words Numbers Images
Words are meaningless
without data
Data is meaningless
without context
Images are vital to
understanding
Infographics can be
used in your brand’s:
Visualization makes
your message more:
This is done by:
PR Friendly
Social Media Campaigns
Presentations
Annual Reports
Research Content
Blogs
Newsletters
Internal Communications
Website
Telling the Story of Your Brand
Driving Traffic to Your Website
Encouraging User Engagement
Amplifying Your Social Media
Presence
Creating Opportunities for User
Generated Content
Increasing Referrals and
Purchases
ActionableConcreteTangible
Visualizations act as a campfire
around which we gather to tell stories
Al Shalloway
Infographics Are
1 Billion
3.2 Billion
500 Million
5 Billion
200 Million
92%
200 Million
2 new
11 Million
80%
There are
Internet users worldwide
2.4 Billion
Infographic search
volumes on Google
have increased more
than 800% in the last
two years
High Viral coefficient
The best way to go viral is by engaging millions of users, each of them
sharing your content through their small social networks.
has more than
monthly
active users
Facebook
likes and
comments are
posted daily
has more than
members
Google+
times per day
The +1 button
is pressed more
that
has more than
active users
Twitter
of retweets are
based on
“interesting
content”
has more than
members
worldwide
LinkedIn
members per
second join
LinkedIn
About
has more than
users
Pinterest
of Pins are
Repins
I tell you and you forget. I show you and you
remember. I involve you and you understand.
Confucius
Infographics Have a
http://www.visualteachingalliance.com/
http://pewinternet.org/Commentary/2012/March/Pew-Internet-Social-Networking-full-detail.aspx
http://www.eurekalert.org/pub_releases/2006-07/uops-prc072606.php
http://www.insurance.lloydstsb.com/personal/general/mediacentre/homehazards_pr.asp
http://www.google.com/trends/explore#q=infographics&cmpt=q
http://www.globalwebindex.net/Stream-Social
http://www.mediabistro.com/alltwitter/internet-day-stats_b41621
http://www.mediabistro.com/alltwitter/category/statistics/page/2
http://thesocialskinny.com/216-social-media-and-internet-statistics-september-2012/
Unique Story
to be Told;
YOUR
Help You
Tell It
WE
CAN
Sources
Brand’s
is Waiting
/marketplace

More Related Content

What's hot

The Future of Infographics
The Future of InfographicsThe Future of Infographics
The Future of InfographicsColumn Five
 
Digital Trends 2015
Digital Trends 2015Digital Trends 2015
Digital Trends 2015Them London
 
Digital Marketing. Do little, achieve more
Digital Marketing. Do little, achieve moreDigital Marketing. Do little, achieve more
Digital Marketing. Do little, achieve moreBassam AlHakim
 
5 Tips for Implementing New Technology
5 Tips for Implementing New Technology5 Tips for Implementing New Technology
5 Tips for Implementing New TechnologyKelly Burlingham
 

What's hot (6)

The Future of Infographics
The Future of InfographicsThe Future of Infographics
The Future of Infographics
 
Digital Trends 2015
Digital Trends 2015Digital Trends 2015
Digital Trends 2015
 
Digital Brand Research & Social Media Analysis
Digital Brand Research & Social Media Analysis Digital Brand Research & Social Media Analysis
Digital Brand Research & Social Media Analysis
 
Digital Marketing. Do little, achieve more
Digital Marketing. Do little, achieve moreDigital Marketing. Do little, achieve more
Digital Marketing. Do little, achieve more
 
Mobility
MobilityMobility
Mobility
 
5 Tips for Implementing New Technology
5 Tips for Implementing New Technology5 Tips for Implementing New Technology
5 Tips for Implementing New Technology
 

Similar to Why infographics are dominating the web

Exaltus infographic design services
Exaltus infographic design servicesExaltus infographic design services
Exaltus infographic design servicesCarole Alalouf
 
HPE IDOL 10 (Intelligent Data Operating Layer)
HPE IDOL 10 (Intelligent Data Operating Layer)HPE IDOL 10 (Intelligent Data Operating Layer)
HPE IDOL 10 (Intelligent Data Operating Layer)Andrey Karpov
 
SXSW 2017 Mitchell Takeaways
SXSW 2017 Mitchell TakeawaysSXSW 2017 Mitchell Takeaways
SXSW 2017 Mitchell TakeawaysMitchell
 
SXSW 2017 Mitchell Takeaways
SXSW 2017 Mitchell TakeawaysSXSW 2017 Mitchell Takeaways
SXSW 2017 Mitchell TakeawaysEmma Huett
 
SXSW 2017 takeaways
SXSW 2017 takeawaysSXSW 2017 takeaways
SXSW 2017 takeawaysEmma Huett
 
Teradata Connect 2014 Unofficial Summary
Teradata Connect 2014 Unofficial SummaryTeradata Connect 2014 Unofficial Summary
Teradata Connect 2014 Unofficial SummaryLocalz
 
Digital Marketing 101 5496
Digital Marketing 101 5496Digital Marketing 101 5496
Digital Marketing 101 5496prashantnandan1
 
Leverage Visual Storytelling to Win More Leads
Leverage Visual Storytelling to Win More LeadsLeverage Visual Storytelling to Win More Leads
Leverage Visual Storytelling to Win More LeadsJomer Gregorio
 
InOttawa Linkedin Marketing Solutions Event 09.12.2013
InOttawa Linkedin Marketing Solutions Event 09.12.2013InOttawa Linkedin Marketing Solutions Event 09.12.2013
InOttawa Linkedin Marketing Solutions Event 09.12.2013Dan Pastuszak
 
Social Media Insights: 2018 Social Media Trends and Analytics Implications | ...
Social Media Insights: 2018 Social Media Trends and Analytics Implications | ...Social Media Insights: 2018 Social Media Trends and Analytics Implications | ...
Social Media Insights: 2018 Social Media Trends and Analytics Implications | ...PaloServices
 
Precedent's Finance Forum - The digital landscape for UK financial services
Precedent's Finance Forum -  The digital landscape for UK financial services Precedent's Finance Forum -  The digital landscape for UK financial services
Precedent's Finance Forum - The digital landscape for UK financial services Precedent
 
Vpk Digital Marketing042009
Vpk Digital Marketing042009Vpk Digital Marketing042009
Vpk Digital Marketing042009Antti Leino
 
Winning The War Of Brand Relevance With Data Driven Storytelling
Winning The War Of Brand Relevance With Data Driven StorytellingWinning The War Of Brand Relevance With Data Driven Storytelling
Winning The War Of Brand Relevance With Data Driven StorytellingMichael Brito | Zeno Group
 
Digital Marketing Project Report
Digital Marketing Project Report Digital Marketing Project Report
Digital Marketing Project Report KashikaJauhari
 
Helping vs. Telling - the press release's next chapter
Helping vs. Telling - the press release's next chapterHelping vs. Telling - the press release's next chapter
Helping vs. Telling - the press release's next chapterMalcolm Atherton
 

Similar to Why infographics are dominating the web (20)

Exaltus infographic design services
Exaltus infographic design servicesExaltus infographic design services
Exaltus infographic design services
 
HPE IDOL 10 (Intelligent Data Operating Layer)
HPE IDOL 10 (Intelligent Data Operating Layer)HPE IDOL 10 (Intelligent Data Operating Layer)
HPE IDOL 10 (Intelligent Data Operating Layer)
 
SXSW 2017 Mitchell Takeaways
SXSW 2017 Mitchell TakeawaysSXSW 2017 Mitchell Takeaways
SXSW 2017 Mitchell Takeaways
 
SXSW 2017 Mitchell Takeaways
SXSW 2017 Mitchell TakeawaysSXSW 2017 Mitchell Takeaways
SXSW 2017 Mitchell Takeaways
 
SXSW 2017 takeaways
SXSW 2017 takeawaysSXSW 2017 takeaways
SXSW 2017 takeaways
 
Teradata Connect 2014 Unofficial Summary
Teradata Connect 2014 Unofficial SummaryTeradata Connect 2014 Unofficial Summary
Teradata Connect 2014 Unofficial Summary
 
Digital Marketing 101 5496
Digital Marketing 101 5496Digital Marketing 101 5496
Digital Marketing 101 5496
 
Digital + Marketing 101
Digital + Marketing 101Digital + Marketing 101
Digital + Marketing 101
 
Web Design Trends 2016
Web Design Trends 2016Web Design Trends 2016
Web Design Trends 2016
 
Social Media Presented By Ritz Marketing 2.16.11
Social Media Presented By Ritz Marketing 2.16.11Social Media Presented By Ritz Marketing 2.16.11
Social Media Presented By Ritz Marketing 2.16.11
 
Leverage Visual Storytelling to Win More Leads
Leverage Visual Storytelling to Win More LeadsLeverage Visual Storytelling to Win More Leads
Leverage Visual Storytelling to Win More Leads
 
The Strategic State of News Media Worldwide
The Strategic State of News Media WorldwideThe Strategic State of News Media Worldwide
The Strategic State of News Media Worldwide
 
InOttawa Linkedin Marketing Solutions Event 09.12.2013
InOttawa Linkedin Marketing Solutions Event 09.12.2013InOttawa Linkedin Marketing Solutions Event 09.12.2013
InOttawa Linkedin Marketing Solutions Event 09.12.2013
 
Social Media Insights: 2018 Social Media Trends and Analytics Implications | ...
Social Media Insights: 2018 Social Media Trends and Analytics Implications | ...Social Media Insights: 2018 Social Media Trends and Analytics Implications | ...
Social Media Insights: 2018 Social Media Trends and Analytics Implications | ...
 
Precedent's Finance Forum - The digital landscape for UK financial services
Precedent's Finance Forum -  The digital landscape for UK financial services Precedent's Finance Forum -  The digital landscape for UK financial services
Precedent's Finance Forum - The digital landscape for UK financial services
 
Vpk Digital Marketing042009
Vpk Digital Marketing042009Vpk Digital Marketing042009
Vpk Digital Marketing042009
 
Winning The War Of Brand Relevance With Data Driven Storytelling
Winning The War Of Brand Relevance With Data Driven StorytellingWinning The War Of Brand Relevance With Data Driven Storytelling
Winning The War Of Brand Relevance With Data Driven Storytelling
 
Boost 2009 Freeman Leonard
Boost 2009   Freeman LeonardBoost 2009   Freeman Leonard
Boost 2009 Freeman Leonard
 
Digital Marketing Project Report
Digital Marketing Project Report Digital Marketing Project Report
Digital Marketing Project Report
 
Helping vs. Telling - the press release's next chapter
Helping vs. Telling - the press release's next chapterHelping vs. Telling - the press release's next chapter
Helping vs. Telling - the press release's next chapter
 

Recently uploaded

Connect Wave/ connectwave Pitch Deck Presentation
Connect Wave/ connectwave Pitch Deck PresentationConnect Wave/ connectwave Pitch Deck Presentation
Connect Wave/ connectwave Pitch Deck PresentationSlibray Presentation
 
Artificial intelligence in the post-deep learning era
Artificial intelligence in the post-deep learning eraArtificial intelligence in the post-deep learning era
Artificial intelligence in the post-deep learning eraDeakin University
 
Transcript: New from BookNet Canada for 2024: BNC BiblioShare - Tech Forum 2024
Transcript: New from BookNet Canada for 2024: BNC BiblioShare - Tech Forum 2024Transcript: New from BookNet Canada for 2024: BNC BiblioShare - Tech Forum 2024
Transcript: New from BookNet Canada for 2024: BNC BiblioShare - Tech Forum 2024BookNet Canada
 
Install Stable Diffusion in windows machine
Install Stable Diffusion in windows machineInstall Stable Diffusion in windows machine
Install Stable Diffusion in windows machinePadma Pradeep
 
Pigging Solutions Piggable Sweeping Elbows
Pigging Solutions Piggable Sweeping ElbowsPigging Solutions Piggable Sweeping Elbows
Pigging Solutions Piggable Sweeping ElbowsPigging Solutions
 
Maximizing Board Effectiveness 2024 Webinar.pptx
Maximizing Board Effectiveness 2024 Webinar.pptxMaximizing Board Effectiveness 2024 Webinar.pptx
Maximizing Board Effectiveness 2024 Webinar.pptxOnBoard
 
Beyond Boundaries: Leveraging No-Code Solutions for Industry Innovation
Beyond Boundaries: Leveraging No-Code Solutions for Industry InnovationBeyond Boundaries: Leveraging No-Code Solutions for Industry Innovation
Beyond Boundaries: Leveraging No-Code Solutions for Industry InnovationSafe Software
 
Are Multi-Cloud and Serverless Good or Bad?
Are Multi-Cloud and Serverless Good or Bad?Are Multi-Cloud and Serverless Good or Bad?
Are Multi-Cloud and Serverless Good or Bad?Mattias Andersson
 
Streamlining Python Development: A Guide to a Modern Project Setup
Streamlining Python Development: A Guide to a Modern Project SetupStreamlining Python Development: A Guide to a Modern Project Setup
Streamlining Python Development: A Guide to a Modern Project SetupFlorian Wilhelm
 
Designing IA for AI - Information Architecture Conference 2024
Designing IA for AI - Information Architecture Conference 2024Designing IA for AI - Information Architecture Conference 2024
Designing IA for AI - Information Architecture Conference 2024Enterprise Knowledge
 
Build your next Gen AI Breakthrough - April 2024
Build your next Gen AI Breakthrough - April 2024Build your next Gen AI Breakthrough - April 2024
Build your next Gen AI Breakthrough - April 2024Neo4j
 
Swan(sea) Song – personal research during my six years at Swansea ... and bey...
Swan(sea) Song – personal research during my six years at Swansea ... and bey...Swan(sea) Song – personal research during my six years at Swansea ... and bey...
Swan(sea) Song – personal research during my six years at Swansea ... and bey...Alan Dix
 
#StandardsGoals for 2024: What’s new for BISAC - Tech Forum 2024
#StandardsGoals for 2024: What’s new for BISAC - Tech Forum 2024#StandardsGoals for 2024: What’s new for BISAC - Tech Forum 2024
#StandardsGoals for 2024: What’s new for BISAC - Tech Forum 2024BookNet Canada
 
Key Features Of Token Development (1).pptx
Key  Features Of Token  Development (1).pptxKey  Features Of Token  Development (1).pptx
Key Features Of Token Development (1).pptxLBM Solutions
 
Tech-Forward - Achieving Business Readiness For Copilot in Microsoft 365
Tech-Forward - Achieving Business Readiness For Copilot in Microsoft 365Tech-Forward - Achieving Business Readiness For Copilot in Microsoft 365
Tech-Forward - Achieving Business Readiness For Copilot in Microsoft 3652toLead Limited
 
SQL Database Design For Developers at php[tek] 2024
SQL Database Design For Developers at php[tek] 2024SQL Database Design For Developers at php[tek] 2024
SQL Database Design For Developers at php[tek] 2024Scott Keck-Warren
 
Unleash Your Potential - Namagunga Girls Coding Club
Unleash Your Potential - Namagunga Girls Coding ClubUnleash Your Potential - Namagunga Girls Coding Club
Unleash Your Potential - Namagunga Girls Coding ClubKalema Edgar
 

Recently uploaded (20)

Connect Wave/ connectwave Pitch Deck Presentation
Connect Wave/ connectwave Pitch Deck PresentationConnect Wave/ connectwave Pitch Deck Presentation
Connect Wave/ connectwave Pitch Deck Presentation
 
Artificial intelligence in the post-deep learning era
Artificial intelligence in the post-deep learning eraArtificial intelligence in the post-deep learning era
Artificial intelligence in the post-deep learning era
 
Transcript: New from BookNet Canada for 2024: BNC BiblioShare - Tech Forum 2024
Transcript: New from BookNet Canada for 2024: BNC BiblioShare - Tech Forum 2024Transcript: New from BookNet Canada for 2024: BNC BiblioShare - Tech Forum 2024
Transcript: New from BookNet Canada for 2024: BNC BiblioShare - Tech Forum 2024
 
Vulnerability_Management_GRC_by Sohang Sengupta.pptx
Vulnerability_Management_GRC_by Sohang Sengupta.pptxVulnerability_Management_GRC_by Sohang Sengupta.pptx
Vulnerability_Management_GRC_by Sohang Sengupta.pptx
 
Install Stable Diffusion in windows machine
Install Stable Diffusion in windows machineInstall Stable Diffusion in windows machine
Install Stable Diffusion in windows machine
 
Pigging Solutions Piggable Sweeping Elbows
Pigging Solutions Piggable Sweeping ElbowsPigging Solutions Piggable Sweeping Elbows
Pigging Solutions Piggable Sweeping Elbows
 
DMCC Future of Trade Web3 - Special Edition
DMCC Future of Trade Web3 - Special EditionDMCC Future of Trade Web3 - Special Edition
DMCC Future of Trade Web3 - Special Edition
 
Maximizing Board Effectiveness 2024 Webinar.pptx
Maximizing Board Effectiveness 2024 Webinar.pptxMaximizing Board Effectiveness 2024 Webinar.pptx
Maximizing Board Effectiveness 2024 Webinar.pptx
 
Beyond Boundaries: Leveraging No-Code Solutions for Industry Innovation
Beyond Boundaries: Leveraging No-Code Solutions for Industry InnovationBeyond Boundaries: Leveraging No-Code Solutions for Industry Innovation
Beyond Boundaries: Leveraging No-Code Solutions for Industry Innovation
 
Are Multi-Cloud and Serverless Good or Bad?
Are Multi-Cloud and Serverless Good or Bad?Are Multi-Cloud and Serverless Good or Bad?
Are Multi-Cloud and Serverless Good or Bad?
 
Streamlining Python Development: A Guide to a Modern Project Setup
Streamlining Python Development: A Guide to a Modern Project SetupStreamlining Python Development: A Guide to a Modern Project Setup
Streamlining Python Development: A Guide to a Modern Project Setup
 
Designing IA for AI - Information Architecture Conference 2024
Designing IA for AI - Information Architecture Conference 2024Designing IA for AI - Information Architecture Conference 2024
Designing IA for AI - Information Architecture Conference 2024
 
Build your next Gen AI Breakthrough - April 2024
Build your next Gen AI Breakthrough - April 2024Build your next Gen AI Breakthrough - April 2024
Build your next Gen AI Breakthrough - April 2024
 
Swan(sea) Song – personal research during my six years at Swansea ... and bey...
Swan(sea) Song – personal research during my six years at Swansea ... and bey...Swan(sea) Song – personal research during my six years at Swansea ... and bey...
Swan(sea) Song – personal research during my six years at Swansea ... and bey...
 
#StandardsGoals for 2024: What’s new for BISAC - Tech Forum 2024
#StandardsGoals for 2024: What’s new for BISAC - Tech Forum 2024#StandardsGoals for 2024: What’s new for BISAC - Tech Forum 2024
#StandardsGoals for 2024: What’s new for BISAC - Tech Forum 2024
 
Key Features Of Token Development (1).pptx
Key  Features Of Token  Development (1).pptxKey  Features Of Token  Development (1).pptx
Key Features Of Token Development (1).pptx
 
Tech-Forward - Achieving Business Readiness For Copilot in Microsoft 365
Tech-Forward - Achieving Business Readiness For Copilot in Microsoft 365Tech-Forward - Achieving Business Readiness For Copilot in Microsoft 365
Tech-Forward - Achieving Business Readiness For Copilot in Microsoft 365
 
SQL Database Design For Developers at php[tek] 2024
SQL Database Design For Developers at php[tek] 2024SQL Database Design For Developers at php[tek] 2024
SQL Database Design For Developers at php[tek] 2024
 
Unleash Your Potential - Namagunga Girls Coding Club
Unleash Your Potential - Namagunga Girls Coding ClubUnleash Your Potential - Namagunga Girls Coding Club
Unleash Your Potential - Namagunga Girls Coding Club
 
08448380779 Call Girls In Friends Colony Women Seeking Men
08448380779 Call Girls In Friends Colony Women Seeking Men08448380779 Call Girls In Friends Colony Women Seeking Men
08448380779 Call Girls In Friends Colony Women Seeking Men
 

Why infographics are dominating the web

  • 1. INFOGRAPHICS THE WEB ??? ARE DOMINATING WHY How Visual Content is Trans- forming the Marketing Landscape The infographic: a visual representation of complex data – has emerged as one of the most popular forms of social content. Causes include: the way the human eye sees and reads content, diminishing attention spans, growing information overload, the unique ability to tell a visual story and the enormous viral sharing potential allowed by the medium.
  • 2. 90% 1/2 Did you know? Marketing VISUAL of information transmitted to the brain is visual of the brain is dedicated to visual function 10 Million Bits per Second The rate in which the human retina transmits data to the brain or The speed of an Ethernet connection The human brain processes visual information 60,000 times faster than text Approximately 65% of people are visual learners Most people only remember 20% of what they read Marketing persuades consumer's buying behavior and data visualization enhances that by factors of recall, memory and brand identity. The purpose of visualization is insight, not pictures Ben Shneiderman HUMANS ARE CREATURES
  • 3. The Estimated Attention Span 5 times more Marketers 12 minutes 5 minutes 29,500,000,000,000,000,000,000 SPANS DATA GLUT& We receive information daily than we did in 1986 The average person is exposed to the equivalent of 174 newspapers of data per day are struggling to get their messa- ges heard among all this noise. in 2000 in 2012 = 315 times the number of grains of sand on the Earth pieces of information floating around the world There’s about ...a wealth of information creates a poverty of attention... Herbert A. Simon OUR SHRINKING ATTENTION ARE TO BLAME
  • 4. High Data Data density can be improved by integrating ALL visual elements into one page The average press release contains 400 words 1/1,000th B A F H I R Z D T 3 5 9 8 1 2 7 6 4 Infographics allow you to focus your message only on the important information, cutting out all the fluff. Above all else show the data Edward Tufte Density Infographics Have which takes about 100 seconds or 10,000 bits per second to read, of the human retina-brain data capacity using only Words Numbers Images Words are meaningless without data Data is meaningless without context Images are vital to understanding
  • 5. Infographics can be used in your brand’s: Visualization makes your message more: This is done by: PR Friendly Social Media Campaigns Presentations Annual Reports Research Content Blogs Newsletters Internal Communications Website Telling the Story of Your Brand Driving Traffic to Your Website Encouraging User Engagement Amplifying Your Social Media Presence Creating Opportunities for User Generated Content Increasing Referrals and Purchases ActionableConcreteTangible Visualizations act as a campfire around which we gather to tell stories Al Shalloway Infographics Are
  • 6. 1 Billion 3.2 Billion 500 Million 5 Billion 200 Million 92% 200 Million 2 new 11 Million 80% There are Internet users worldwide 2.4 Billion Infographic search volumes on Google have increased more than 800% in the last two years High Viral coefficient The best way to go viral is by engaging millions of users, each of them sharing your content through their small social networks. has more than monthly active users Facebook likes and comments are posted daily has more than members Google+ times per day The +1 button is pressed more that has more than active users Twitter of retweets are based on “interesting content” has more than members worldwide LinkedIn members per second join LinkedIn About has more than users Pinterest of Pins are Repins I tell you and you forget. I show you and you remember. I involve you and you understand. Confucius Infographics Have a