SlideShare a Scribd company logo
1 of 25
Download to read offline
Equity Valuation 2022-07-22_KHC_MC_REPORT-CONTENTS Draft Valuation
LMB Enterprises, L.L.C. | © BEHARRY, LYNDON MARTIN W. | 2022-07-22_KHC_MC_Report-Contents | 7/22/2022 2:51 PM
KHC: Kraft Heinz Co. | FEIN: 46-2078182
Draft Materials of Financial Analysis
Note: The analyst must use Oracle Crystal Ball to run the Monte Carlo simulation.
Income Statement Review with Statistical Metrics 2.
Income Statement Worksheet (for complex D&A and byzantine
calculations)
3.
Balance Sheet Review (includes a restatement of equity adjusting per
share values to par $1 adjusting Capital Paid-In to simplify per share
allocation calculations)
4.
Capital Expenditures Worksheet 5.
Draft Statement of Cash Flow (Coding in Process) 6.
Complex Debt Valuation and KB Costing (Tax Shield) and multi-
Currency Converter
7.
Weighted Average Cost of Capital Calculator Worksheet 8.
Variables Tabulation Worksheet for Monte Carlo with Summary 9.
Monte Carlo Model (No Iteration Shown) 10.
Monte Carlo Model 10 Iterations Shown out of 1 Million 10A-10J.
Discounted Cash Flow worksheet (static model) 11.
Monte Carlo Model Summary of Results: Distribution Records;
Sensitivity to Variables; Tornado Chart
12.
DCF Valuation Sensitivity Analysis Graphics (WACC and Growth Rate) 13.
Monte Carlo Model Summary of Results Tornado Chart Metrics 14.
Coded Financial Statement Review (Formatting in Process) 15.
Benford Test for Fraud: Balance Sheet Data 16.
Beneish Test for Fraud: 5 Years 17.
Equity Valuation 2022‐07‐22_KHC_MC‐Equity‐1Million Financial Statement Review
KHC: Kraft Heinz Co. | FEIN: 46‐2078182 BalShtReview
1,000,000 $USD 2007 2008 2009 2010 2011 2012 2013 2014 2015 2016 2017 2018 2019 2020 2021
CURRENT ASSETS
Cash 567 1,244 2,101 2 0 1,255 1,686 2,298 4,837 4,204 1,629 1,130 2,279 3,417 3,445
Trade Accounts Receivable 5,197 4,704 5,197 1,196 903 1,089 1,048 690 871 769 921 2,129 1,973 2,063 1,957
Short Term Factor Financing Receivable 161 583 129 353
Accounts Receivable 5,197 4,704 5,197 1,196 903 1,089 1,048 851 1,454 898 1,274 2,129 1,973 2,063 1,957
Inventories 4,096 3,881 3,775 1,773 1,943 1,928 1,616 1,185 2,618 2,684 2,815 2,667 2,721 2,773 2,729
Investments in Securities / Short‐term Securities
Deferred Tax 575 804 730 171 232 420 360 260 582 152 173
Prepaid Expenses 400 384 132 136
Other Current Assets 302 828 651 165 194 131 198 581 871 707 966 1,221 445 574 716
Assets held for sale 1,376 122 1,863 11
TOTAL CURRENT ASSETS 10,737 11,461 12,454 3,307 3,272 4,823 4,908 4,915 9,780 8,753 7,266 9,075 8,097 10,822 8,994
NON-CURRENT ASSETS (i.e. LONG-TERM ASSETS)
Property Plant and Equipment (Acquisition Basis) 19,204 17,815 19,423 7,957 8,169 8,402 7,822 2,796 7,430 8,518 9,214 9,662 10,242 10,439 10,674
Accumulated Depreciation 8,426 7,898 8,730 3,674 3,891 4,198 3,707 431 906 1,830 2,094 2,584 3,187 3,563 3,868
Property Plant and Equipment (Net of Depreciation)
PPE (Net) 10,778 9,917 10,693 4,283 4,278 4,204 4,115 2,365 6,524 6,688 7,120 7,078 7,055 6,876 6,806
Goodwill 31,193 27,581 28,764 11,338 11,316 11,346 11,505 14,959 43,051 44,125 44,824 36,503 35,546 33,089 31,296
Intangible (Other Intangible) 12,200 12,926 13,429 2,630 2,630 2,631 2,229 13,188 62,120 59,297 59,449 49,468 48,652 46,667 43,542
TOTAL GOODWILL AND INTANGIBLE OTHER 43,393 40,507 42,193 13,968 13,946 13,977 13,734 28,147 105,171 103,422 104,273 85,971 84,198 79,756 74,838
Long‐term Marketable Securities
Other non‐current (non‐specified) 1,437 1,232 1,259 23 43 325 391 1,144 1,498 1,617 1,573 1,337 2,100 2,376 2,756
PrePaid pension assets 1,648 56 115 17
TOTAL NON-CURRENT ASSETS 57,256 51,712 54,260 18,291 18,267 18,506 18,240 31,656 113,193 111,727 112,966 94,386 93,353 89,008 84,400
TOTAL ASSETS 67,993 63,173 66,714 21,598 21,539 23,329 23,148 36,571 122,973 120,480 120,232 103,461 101,450 99,830 93,394
CURRENT LIABILITIES
Accounts Payable 4,065 3,373 3,766 1,285 1,447 1,556 1,548 1,651 2,844 3,996 4,449 4,153 4,003 4,304 4,753
Current Portion of Debt 8,107 1,662 966 8 8 5 4 2,691 3,203 398 1,028 236 754
Accrued Expenses 2,746 2,754 3,356 751 817 934 869 297 856 749 680 722 647 946 804
Accrued Taxes Payable 100 232 417 255 152 114 541
Interest Payable 167 401 415 419 408 384 358 268
Other Current Liabilities 1,654 3,255 3,403 322 300 579 479 730 1,324 1,238 1,178 1,767 1,804 2,086 1,944
Liabilities Held for Sale 55 9 17
Accrued postemployment costs 0 236 197 15 328 157 51
Due to Altria Group, Inc. and affiliates 0
Dividend Payable 414 296 313 762
TOTAL CURRENT LIABILITIES 17,086 11,044 11,491 2,366 2,572 3,606 3,410 3,092 6,932 9,501 10,132 7,503 7,875 8,061 9,064
LONG-TERM LIABILITIES
Notes payable / Long‐term Debt 12,902 18,589 18,024 31 27 9,966 9,976 13,358 25,151 29,713 28,333 30,770 28,216 28,070 21,061
Long‐term Tax Liabilities 4,876 4,064 4,508 1,524 1,594 288 662 3,867 21,497 20,848 14,076 12,202 11,878 11,462 10,536
Accrued post‐Employment Costs 3,656 5,045 4,581 55 117 5,492 3,485 287 2,405 2,038 427 306 273 243 205
Long‐term Deferred Income 6 1,534
Other non‐current 2,178 2,075 2,138 583 641 405 428 282 752 806 1,017 902 1,459 1,745 1,542
TOTAL LONG-TERM LIABILITIES 23,612 29,773 29,251 2,193 2,379 16,151 14,551 17,794 49,805 53,405 43,853 44,180 41,826 41,526 34,878
TOTAL LIABILITIES 40,698 40,817 40,742 4,559 4,951 19,757 17,961 20,886 56,737 62,906 53,985 51,683 49,701 49,587 43,942
SHAREHOLDERS EQUITY Goal‐Seek Adjust Capital Paid‐In and Share count total to Par  $USD 1.00
Preferred Stock:A @ par  $USD 1.00 0 0
Preferred Stock:B @ par  $USD 1.00
Preferred Stock:C @ par  $USD 1.00
Preferred Stock:D @ par  $USD 1.00
Common Stock @ par  $USD 1.00 1,735 1,735 1,735 593 593 597 744 1,214 1,217 1,219 1,224 1,221 1,228 1,224
Treasury Stock @ par  $USD 1.00 2 2 4 3 5 11
Additional Capital Paid‐In 15,186 13,114 13,460 ‐593 3,645 3,808 15,287 65,462 57,179 57,278 57,225 55,345 53,531 51,569
Deferred Compensation
Accumulated Comprehensive Income / (Loss) ‐1,835 ‐5,994 ‐3,955 ‐171 ‐499 ‐574 ‐671 ‐1,628 ‐1,054 ‐1,943 ‐1,886 ‐1,967 ‐1,824
Retained Earnings / Accumulated Other Comprehensive Income 12,209 13,440 14,636 ‐125 ‐460 1,281 0 0 588 8,589 ‐4,853 ‐3,060 ‐2,694 ‐1,682
Other Equity 17,210 16,713 0
NonControlling Interests 61 96 0 ‐206 228 231 216 213 121 126 140 154
TOTAL SHAREHOLDERS EQUITY 27,295 22,356 25,972 17,039 16,588 3,572 5,187 15,685 66,236 57,574 66,247 51,778 51,749 50,243 49,452
TOTAL LIABILITIES AND SE 67,993 63,173 66,714 21,598 21,539 23,329 23,148 36,571 122,973 120,480 120,232 103,461 101,450 99,830 93,394
Beharry, Lyndon Martin W. 2022‐07‐22_KHC_MC‐Equity‐1Million|BalShtReview 07/22/2022 15:04 | Page 4 of 17
Equity Valuation 2022‐07‐22_KHC_MC‐Equity‐1Million Financial Statement Review
KHC: Kraft Heinz Co. | FEIN: 46‐2078182 CAPEXCalc
IRR; CAGR Aggregated 1,000,000 $USD 2007 2008 2009 2010 2011 2012 2013 2014 2015 2016 2017 2018 2019 2020 2021
1.285%
Working Capital [Current
Assets - Current Liabilities]
‐6,349 417 963 941 700 1,217 1,498 1,823 2,848 ‐748 ‐2,866 1,572 222 2,761 ‐70
PerCent of Revenue ‐17.706% 0.994% 2.384% 5.287% 3.752% 6.661% 8.223% 10.014% 15.531% ‐2.824% ‐10.991% 5.984% 0.889% 10.544% ‐0.269%
-14.362%  Working Capital ‐6,766 ‐546 22 241 ‐517 ‐281 ‐325 ‐1,025 3,596 2,118 ‐4,438 1,350 ‐2,539 2,831
-1.174%  Working Capital %Rev ‐16.136% ‐1.352% 0.124% 1.292% ‐2.830% ‐1.542% ‐1.785% ‐5.589% 13.576% 8.122% ‐16.895% 5.405% ‐9.696% 10.871%
21.437% 6.370%
CAPEX =  Total Assets - 
Total Liabilities
‐4,939 3,616 ‐8,933 ‐451 ‐13,016 1,615 10,498 50,551 ‐8,662 8,673 ‐14,469 ‐29 ‐1,506 ‐791
10.863% CAPEX %Rev ‐11.779% 8.954% ‐50.194% ‐2.418% ‐71.239% 8.865% 57.665% 275.663% ‐32.703% 33.260% ‐55.082% ‐0.116% ‐5.751% ‐3.037%
29.566% 8.079%
CAPEX = PPECurrent - PPELast +
Depreciation
1,172 1,669 ‐6,064 357 495 412 ‐1,366 4,899 1,501 1,512 16,877 2,870 4,189 2,474
7.975% CAPEX %Rev 2.795% 4.133% ‐34.073% 1.914% 2.709% 2.261% ‐7.503% 26.715% 5.667% 5.798% 64.249% 11.491% 15.998% 9.500%
54.195% 44.592% CAPEX %FCFFirm 30.198% 42.566% ‐271.199% 16.706% 22.388% 12.811% ‐95.725% 353.208% 30.147% 12.587% 253.218% 59.470% 88.581% 69.339%
[Agg CapEx]/[Agg Rev] 8.911%
Net Operating Working Capital
[Alt Calc]
2007 2008 2009 2010 2011 2012 2013 2014 2015 2016 2017 2018 2019 2020 2021
+ Total Current Assets 10,737 11,461 12,454 3,307 3,272 4,823 4,908 4,915 9,780 8,753 7,266 9,075 8,097 10,822 8,994
‐ Investments In Securities
‐ Factor Trade Financing 
Receivable
‐161 ‐583 ‐129 ‐353
‐ Current Liabilities ‐17,086 ‐11,044 ‐11,491 ‐2,366 ‐2,572 ‐3,606 ‐3,410 ‐3,092 ‐6,932 ‐9,501 ‐10,132 ‐7,503 ‐7,875 ‐8,061 ‐9,064
+ Current Portion of Debt 8,107 1,662 966 8 8 5 4 2,691 3,203 398 1,028 236 754
5.935% Net Operating Working Capital 1,758 2,079 1,929 949 708 1,222 1,502 1,662 2,265 1,814 ‐16 1,970 1,250 2,997 684
PerCent of Revenue 4.903% 4.958% 4.776% 5.332% 3.795% 6.688% 8.245% 9.129% 12.351% 6.849% ‐0.061% 7.500% 5.005% 11.445% 2.627%
 Working Capital ‐321 150 980 241 ‐514 ‐280 ‐160 ‐603 451 1,830 ‐1,986 720 ‐1,747 2,313
0.280% 0.296%  Working Capital %Rev ‐0.766% 0.371% 5.507% 1.292% ‐2.813% ‐1.537% ‐0.879% ‐3.288% 1.703% 7.018% ‐7.561% 2.883% ‐6.672% 8.882%
Beharry, Lyndon Martin W. 2022‐07‐22_KHC_MC‐Equity‐1Million|CAPEXCalc 07/22/2022 15:04 | Page 5 of 17
Equity Valuation 2022‐07‐22_KHC_MC‐Equity‐1Million Financial Statement Review
Statement of Cash Flows
CashFlows
1,000,000 $USD 2007 2008 2009 2010 2011 2012 2013 2014 2015 2016 2017 2018 2019 2020 2021
CashFlow from Operating Activities: CFO ‐1,645 4,612 2,264 2,385 1,952 3,436 1,586 1,683 9,709 15,364 3,511 7,537 3,584 8,446
Indirect Method
Net Income 2,492 1,848 3,028 1,890 1,775 1,642 2,715 1,043 647 3,642 10,932 ‐10,254 1,933 361 1,024
Adjustments
D&A 1,339 2,033 893 346 362 569 501 384 740 1,337 1,080 16,919 2,893 4,368 2,544
Deferred Taxes 575 804 730 171 232 420 360 0 0 260 582 152 173 0 0
Decrease / (Increase) in Accounts Receivables 493 ‐493 4,001 293 ‐186 41 197 ‐603 556 ‐376 ‐1,231 ‐1,075 ‐1,165 172
Increase / (Decrease) in Inventories 215 106 2,002 ‐170 15 312 431 ‐1,433 ‐66 ‐131 17 ‐37 ‐89 ‐62
Increase / (Decrease) in Accounts Payable 692 ‐393 2,481 ‐162 ‐109 8 ‐103 ‐1,193 ‐1,152 ‐453 ‐157 ‐7 ‐308 ‐600
Increase / (Decrease) in Accrued Interest Receivable
Gain / (Loss) on Sale of Property
CashFlow from Investing Activities: CFI 6,085 3,871 10,891 2,330 2,351 3,937 1,952 ‐1,842 4,577 11,634 5,446 3,880 3,167
Indirect Method
Cash from Sale of Marketable Securities
Cash from Sale of Land
Cash from Sale of Other Assets 5,112 1,137 872 2,874 496 250 250 4,243
Purchase of Plant & Equipment ‐499 ‐85 ‐2,001 ‐4,608 ‐658 ‐71
CashFlow from Financing Activities: CFF ‐499 5,112 1,137 ‐85 872 2,874 ‐2,001 ‐4,608 496 ‐658 ‐71 250 250
Indirect Method
Cash from Sale of Equity 0 0 0 0 0 0 0 0 0 0 0 0 0 0 0
Cash from Sale of Debt 0 0 0 0 0 0 0 0 0 0 0 0 0 0 0
Cash Interest Paid for Debt ‐604 ‐1,240 ‐1,237 ‐6 ‐7 ‐258 ‐501 ‐484 ‐1,321 ‐1,134 ‐1,234 ‐1,284 ‐1,361 ‐1,394 ‐2,047
Cash Paid to Redeem Debt ‐8,107 6,445 696 958 0 3 1 4 0 ‐2,691 ‐512 2,293 1,663 2,455 ‐356
Cash paid for Dividends 0 0 0 0 0 0 0 0 0 0 0 0 0 0 0
Beharry, Lyndon Martin W. 2022‐07‐22_KHC_MC‐Equity‐1Million|CashFlows 07/22/2022 15:04 | Page 6 of 17
Equity Valuation 2022‐07‐22_KHC_MC‐Equity‐1Million Financial Statement Review
Complex Debt
ForEx Carrying Conversion 1,000,000 $USD Currency Purchases $USD
Currency Value Rate Long-Term Debt British pound sterling UKL 1.20000
MatDate Coupon Value Annual Canadian Dollar CND NA
USD 18,049.000 1.00000 2022‐12‐31 3.951% 18,049.000 713 Chinese Yuan CNY NA
EUR 2,877.000 1.02000 2023‐12‐31 1.875% 2,934.540 55 European Union EUR 1.02000
UKL 172.000 1.20000 2030‐02‐18 6.250% 206.400 13 Korean Won KRW NA
UKL 533.000 1.20000 2027‐07‐01 4.125% 639.600 26 South Africa Rand ZAR NA
USD 42.000 1.00000 2022‐12‐31 6.925% 42.000 3 Swiss CHF NA
USD 128.000 1.00000 Lease Obliga 3.250% 128.000 4 US Dollar USD 1.00000
USD 1.00000 2024‐12‐31 4.500% 0.000 0
USD 1.00000 2024‐12‐31 7.875% 0.000 0
USD 1.00000 2025‐12‐31 7.950% 0.000 0
USD 1.00000 2025‐12‐31 5.600% 0.000 0
USD 1.00000 2025‐12‐31 4.750% 0.000 0
USD 1.00000 2026‐12‐31 5.000% 0.000 0
USD 1.00000 2026‐12‐31 2.370% 0.000 0
USD 1.00000 2027‐12‐31 2.950% 0.000 0
USD 1.00000 2027‐12‐31 3.100% 0.000 0
USD 1.00000 2028‐12‐31 6.440% 0.000 0
USD 1.00000 2028‐12‐31 2.070% 0.000 0
USD 1.00000 2028‐12‐31 2.020% 0.000 0
USD 1.00000 2028‐12‐31 2.110% 0.000 0
USD 1.00000 2028‐12‐31 3.620% 0.000 0
USD 1.00000 2028‐12‐31 2.530% 0.000 0
USD 1.00000 2028‐12‐31 2.480% 0.000 0
USD 1.00000 2029‐12‐31 2.500% 0.000 0
USD 1.00000 2029‐12‐31 3.380% 0.000 0
EUR 1.02000 2030‐12‐31 1.900% 0.000 0
USD 1.00000 2030‐12‐31 3.090% 0.000 0
EUR 1.02000 2031‐12‐31 1.540% 0.000 0
USD 1.00000 2037‐12‐31 5.730% 0.000 0
USD 1.00000 2040‐12‐31 3.100% 0.000 0
USD 1.00000 2041‐12‐31 3.100% 0.000 0
USD 1.00000 2044‐12‐31 4.050% 0.000 0
USD 1.00000 2044‐12‐31 3.100% 0.000 0
USD 1.00000 2046‐12‐31 3.370% 0.000 0
USD 1.00000 2047‐12‐31 3.680% 0.000 0
USD 1.00000 2048‐12‐31 4.070% 0.000 0
USD 1.00000 2048‐12‐31 3.780% 0.000 0
USD 1.00000 2049‐12‐31 3.370% 0.000 0
USD 1.00000 2050‐12‐31 3.720% 0.000 0
USD 1.00000 2022‐12‐31 0.190% 0.000 0
USD 1.00000 0.000 0
USD 1.00000 0.000 0
USD 1.00000 0.000 0
USD 1.00000 0.000 0
USD 1.00000 0.000 0
0.00000 0.000 0
0.00000 0.000 0
0.00000 0.000 0
0.00000 0.000 0
0.00000 0.000 0
0.00000 0.000 0
0.00000 0.000 0
0.00000 0.000 0
0.00000 0.000 0
0.00000 0.000 0
0.00000 0.000 0
0.00000 0.000 0
0.00000 0.000 0
0.00000 0.000 0
0.00000 0.000 0
0.00000 0.000 0
0.00000 0.000 0
0.00000 0.000 0
0.00000 0.000 0
0.00000 0.000 0
0.00000 0.000 0
0.00000 0.000 0
0.00000 0.000 0
0.00000 0.000 0
0.00000 0.000 0
0.00000 0.000 0
0.00000 0.000 0
0.00000 0.000 0
0.00000 0.000 0
0.00000 0.000 0
0.00000 0.000 0
…
21,999.540 814
3.702%
Beharry, Lyndon Martin W. 2022‐07‐22_KHC_MC‐Equity‐1Million|Complex Debt 07/22/2022 15:04 | Page 7 of 17
Equity Valuation 2022‐07‐22_KHC_MC‐Equity‐1Million Financial Statement Review
KHC: Kraft Heinz Co. | FEIN: 46‐2078182 WACCCalc ACCOUNT FOR CURRENT AND LONG‐TERM LIABILITIES Yes
DCF analysis will deduct the total value of 
liabilities from the firm's cash position.
Functional Currency:  1,000,000 $USD DCF ACCOUNTS FOR CASH AND ALL OTHER ASSETS (YES); ONLY CASH AND SHORT‐TERM (NO) No
To assess liquidity at T₀, DCF analysis will 
deduct Balance Sheet Liabilities from Cash + 
Short‐term securities.
Debt B Calculations [for Weighted Average Cost of Debt]: FIRE SALE VALUE FOR ASSETS OTHER THAN CASH: 85.000%
1,000,000
Long-Term Debt COST OF DEBT 3.702%
MatDate Coupon Value Annual TAX ADJUSTED 2.924%
2018‐09‐01 8.000% 0 OUTSTANDING DEBT OBLIGATIONS 43,942
2.700% 0 0 $USD CURRENCY COST OF DEBT ISSUE. 45,227
1.550% 0 0
6.800% 0 0
2.250% 0 0 COST OF PREFERRED STOCK 0.000%
2.960% 0 0 WEIGHTED MARKET PRICE OF PREFERRED STOCK 0.000
2.400% 0 0 WEIGHTED AVERAGE OF OUTSTANDING PREFERRED STOCK 0
2.150% 0 0 $USD CURRENCY COST OF PREFERRED CAPITAL. 0
2.400% 0 0
2.850% 0 0
2.550% 0 0 MARKET PRICE OF COMMON STOCK 38.490
3.500% 0 0 RECENT SHARES OUT 1,220
4.625% 0 0 OUTSTANDING COMMON STOCK: ESTIMATETTM = AVG(RECENT,10K FIGURE) 1,228 Adjusted for Treasury Stock
4.540% 0 RETAINED EARNINGS ‐1,682
4.580% 0 $USD CURRENCY COST OF COMMON CAPITAL: CAPITALIZATION. 47,102 49,452 BALANCE SHEET SE
1.920% 0
2.610% 0 DIVIDEND IN $USD 1.600
2.840% 0 DIVIDEND YIELD RATE 4.157%
4.150% 0 ONE YR EXPECTED $USD RETURN PER SHARE = [MARKET PRICE X (1+ER)] + DIVIDEND 42.879
1.890% 0 ACTUAL RETURN ON EQUITY: ER for TTM 2.071% 2.470% TTM VALUE
EXPECTED RETURN ON EQUITYUPPER: Including Risk Premium 6.514% MEAN OF FINANCIALS AND TTM
0 0 GORDON DIVIDEND RoE IMPUTED ke  7.247%
Cost of Long Term Debt 0.000% HISTORICAL 0.790
CAPM FOR COMMON STOCK E(ri) = rf + [E(rm)-rf] LOWER 7.247%
Long Term Debt 22,000 ESTIMATE THE COST OF EQUITY ON EXPECTED RoE OR CAPM?
WAAC 
CAPMKe 
Cost 3.70% WACC MEAN 5.130%
Short Term Debt 0
Cost 0.00% ESTIMATED SHORT-TERM RISK FREE RATE: T-BILL OR OTHER 2.850%
Revolving Debt 0 OVERALL HISTORIC MARKET RETURN 8.416%
Cost 0.00%
PERPETUITY GROWTH RATE = INFLATION 2.500%
Average Debt Cost 3.702%
PERPETUITY DISCOUNT FACTORWACC-PERPETUITY GROWTH RATE 2.630%
WACC Monte 5.130%
TIME HORIZON (YEARS) FOR SCENARIO 10
CAPM Target Price in 1 Years: 41.279
DCF PROJECTED PRICE PER SHARE AT THESE VARIABLES: 34.388
AVERAGE INTERNAL REVENUE GROWTH RATE TIMET-10,T -2.259%
Beharry, Lyndon Martin W. 2022‐07‐22_KHC_MC‐Equity‐1Million|WACCCalc 07/22/2022 15:04 | Page 8 of 17
Equity Valuation 2022‐07‐22_KHC_MC‐Equity‐1Million Financial Statement Review
Variables Monetary Values In 1,000,000 $USD (Except Per Share Values).
KHC: Kraft Heinz Co. | FEIN: 46‐2078182 Currency  $USD Note: This sheet carries decimals to 3 places: 0.000 .
The Kraft Heinz Company, together with its subsidiaries, manufactures and markets food and beverage products in the United States, Canada, the United Kingdom, and internationally. Its products include condiments and sauces, cheese and dairy 
products, meals, meats, refreshment beverages, coffee, and other grocery products. The company also offers dressings, healthy snacks, and other categories; and spices and other seasonings. It sells its products through its own sales organizations, as 
well as through independent brokers, agents, and distributors to chain, wholesale, cooperative and independent grocery accounts, convenience stores, drug stores, value stores, bakeries, pharmacies, mass merchants, club stores, and foodservice 
distributors and institutions, including hotels, restaurants, hospitals, health care facilities, and government agencies; and online through various e‐commerce platforms and retailers. The company was formerly known as H.J. Heinz Holding Corporation 
and changed its name to The Kraft Heinz Company in July 2015. The Kraft Heinz Company was founded in 1869 and is headquartered in Pittsburgh, Pennsylvania. (FY: 2021‐12‐25)
User may vary input into shaded cells. Complete the IncStmntReview and BalShtReview worksheets. Complete this page; then run your simulation here.
The most recent FY end (type year): 2021 Adjust Base Year for TTM Estimate Yes
Calculate Statistics through FY: 2021
Mean Historical Alternate 10.000% Coefficient of Variation Target Cut-off
Variables Estimate STDEV Rate
Revenue Growth Rate 0.246% 20.535% ‐2.259% High deviation. Coefficient of Variation=8335.09% Use an alternate rate.
Alternative Revenue Growth RateDCF 0.00000% 0.000% 0.00% + / -  Growth Per Annum Monte Carlo DCF:  $USD KHC: Kraft Heinz Co. | FEIN: 46-2078182
Projected Growth Rate Y1     0.000% 0.000% Use Alternate Rates: Yes 0.000% 0.000%
AGGR
CoGS : f(Revenue) 63.544% 3.015% 63.266% 63.266%
Depreciation/Amortization [COGs] : f(Revenue) 9.221% 15.837% 9.221% 3.047% High deviation. Coefficient of Variation=171.75% Use an alternate rate.
SGA (Only) : f(Revenue) 15.757% 3.637% 16.383% 16.383% High deviation. Coefficient of Variation=23.08% Use an alternate rate.
R&D : f(Revenue) 0.000% 0.000% 0.000% 0.000% 0.000%
Depreciation/Amortization [SGA] : f(Revenue) 6.179% 15.543% 6.179% 6.416% High deviation. Coefficient of Variation=251.56% Use an alternate rate.
Total Other Overhead : f(Revenue) 6.179% 15.543% 6.179% 6.416% Operating expense has a high deviation=251.56% Check rates of member elements.
Other Expense (Income) : f(Revenue) -0.552% 1.244% ‐0.570% ‐0.570% High deviation. Coefficient of Variation=225.64% Use an alternate rate.
Interest Expense (Income) : f(Revenue) 3.622% 2.347% 1.250% 3.678% 1.250% High deviation. Coefficient of Variation=64.79% Use an alternate rate.
Tax Rate : f(EBT) 24.083% 36.336% 21.000% 17.201% High deviation. Coefficient of Variation=150.88% Use an alternate rate.
Capital Expenditures : f(Revenue) 7.975% 21.037% 8.079% 8.079% High deviation. Coefficient of Variation=263.78% Use an alternate rate.
Δ Working Capital : f(Revenue) 0.280% 4.759% 0.000% 0.296% High deviation. Coefficient of Variation=1700.04% Use an alternate rate.
Working Capital : f(Revenue) 2.565% 8.425% 1.285% 1.285% High deviation. Coefficient of Variation=328.45% Use an alternate rate.
Equity Minority Interest : f(Revenue) 0.000% 0.000% 0.000% 0.000%
Financial Ratios | FY 2021
Current 0.99227714
Acid Test 0.38007502 No Include Accounts Receivable?
Debt:Equity 0.88857882
Debt:Debt+Equity 0.47050132
RoA (Adjusted for D&A) 0.0109643
RoE 0.02070695
Gordon Dividend Payout Model:
Book Value of the Firm $USD1,000,000 49,452
Book Value Per Share BV0 40.534
Dividend Growth Rate (Gordon Model) gn 160.962% 0.000% Δ KE : [CAPM - Gordon]
ke = [(RoE - gn ) X (BV0 / P0)] + gn 7.247% No Actual RoE (Yes); Expected RoE (No)
P0/BV0 = PBV = [(RoE-gn)/(ke-gn) 0.94956321
Price Multiple : BV0 0.950
Forecast Share Price From Multiple X BV0 38.490
Static Model: DCF Valuation Per Share 34.388 Growth Rate: 0.00% less 0.00% each subsequent year after T₁.
 $USD 34.388
VARIABLES FOR WACC CALCULATIONS
Market and CAPM Modelling 2.850% Risk‐Free Rate (T‐Bill/Bond/Note, LIBOR or other imputed rate)
8.416% Overall historic Market Return
Equity Share Variables 38.490 Current Market Price of Common Stock
1.600 Dividend, if applicable
0.790  eta 
2.470% Return on Equity TTM
15.000% Expected Return on Equity
1,220.000 Current Shares Outstanding (diluted) Including Treasury Holdings in 1,000,000's
Preferred Share Variables Current Market Price of Preferred Stock: A, if applicable
0 Current shares outstanding 1,000,000
Preferred: A stock coupon
Current Market Price of Preferred Stock: B, if applicable
0 Current shares outstanding 1,000,000
Preferred: B stock coupon
Current Market Price of Preferred Stock: C, if applicable
0 Current shares outstanding 1,000,000
Preferred: C stock coupon
Current Market Price of Preferred Stock: D, if applicable
0 Current shares outstanding 1,000,000
Preferred: D stock coupon
0 Weighted Number of Preferred Shares Outstanding
0.000% Weighted Cost (Coupon) of Preferred Shares Outstanding
0.000 Weighted Market Price of Preferred
Perpetuity Growth Rate Inflation Long‐term Growth Rate (for perpetuity model)
2.500% Long‐Term Inflation Rate
3.580% Average Long‐Term Inflation Rate: U.S.A.
7.247% CAPM KE 
Basis of WACC Calculation
WAAC 
CAPMKe 
CALCULATE DISCOUNT RATE VARYING EQUITY WEIGHTING: 
WACC, CAPM, GORDON RoE, AVERAGE OF CAPM AND GORDON RoE?
Yes VARY WACC AROUND ITS MEAN?
2.000% AT THIS COEFFICIENT OF VARIATION (  PERCENT OF THE MEAN).
5.130% WACC FOR SIMULATION
ALTERNATE PLUG FOR WACC DISCOUNT FACTOR
Forecast Results Summary Per Share 37.770 P/E Valuation 45.000 PE Forward
42.879 CAPM Valuation No Revenue Growth
38.490 BV0 Multiple Valuation
34.388 Static DCF Valuation
35.496 Monte Carlo DCF  Valuation
37.805    of All Models Valuation
Monte Carlo Analysis: 35.496 Monte Carlo DCF  2.500 
155.517 Monte Carlo Upper 155.517
(112.956) Monte Carlo Lower (112.956)
268.473 Monte Carlo Range
756.342% Range:Mean
Student's t Distribution
The header (top) is higher | lower than the complement (left).
Ratio Comparison of the Models P/E CAPM Gordon BV0  Static DCF MC DCF  Models
P/E 0.000% 13.526% 1.905% ‐8.954% ‐6.021% 0.091%
CAPM ‐11.915% 0.000% ‐10.237% ‐19.802% ‐17.218% ‐11.834%
Gordon BV0  ‐1.869% 11.404% 0.000% ‐10.656% ‐7.778% ‐1.780%
Static DCF 9.835% 24.691% 11.927% 0.000% 3.222% 9.935%
MC DCF 6.407% 20.800% 8.434% ‐3.121% 0.000% 6.504%
 Models ‐0.091% 13.423% 1.812% ‐9.037% ‐6.107% 0.000%
Beharry, Lyndon Martin W. 2022‐07‐22_KHC_MC‐Equity‐1Million|Variables 07/22/2022 15:04 | Page 9 of 17
Equity Valuation 2022‐07‐22_KHC_MC‐Equity‐1Million Financial Statement Review
Type alternative annual growth rates here:
KHC: Kraft Heinz Co. | FEIN: 46‐2078182: Monte Carlo: Valuation Per Share |  $USD Mask Monetary Values In 1,000,000 $USD (Except Per Share Values).
1,000,000 $USD Revenue Growth Rate2022 Revenue Growth Rate2023 Revenue Growth Rate2024 Revenue Growth Rate2025 Revenue Growth Rate2026 Revenue Growth Rate2027 Revenue Growth Rate2028 Revenue Growth Rate2029 Revenue Growth Rate2030 Revenue Growth Rate2031 Revenue Growth Rate2032
Projection Base [FY] Year T0  2021 2021 2022 2023 2024 2025 2026 2027 2028 2029 2030 2031 2032
Mean STDEV 0 1 2 3 4 5 6 7 8 9 10
Revenue Growth Rate 2022 00.0% Revenue Growth Rate 2023 00.0% Revenue Growth Rate 2024 00.0% Revenue Growth Rate 2025 00.0% Revenue Growth Rate 2026 00.0% Revenue Growth Rate 2027 00.0% Revenue Growth Rate 2028 00.0% Revenue Growth Rate 2029 00.0% Revenue Growth Rate 2030 00.0% Revenue Growth Rate 2031 00.0% Revenue Growth Rate 2032 00.0%
0.000% 0.000% Random Growth Rate
Sequential Reduction 0.000% Alternate Coefficient of Variability 10.00% 0.00% 0.00% 0.00% 0.00% 0.00% 0.00% 0.00% 0.00% 0.00% 0.00% 0.00%
Timet0 Timet+1 Timet+2 Timet+3 Timet+4 Timet+5 Timet+6 Timet+7 Timet+8 Timet+9 Timet+10 Timet+11
Projection TimeT1 
26,042 MONTE CARLO REVENUE 26,042 26,042 26,042 26,042 26,042 26,042 26,042 26,042 26,042 26,042 26,042
CoGS : f(Revenue)2022 CoGS : f(Revenue)2023 CoGS : f(Revenue)2024 CoGS : f(Revenue)2025 CoGS : f(Revenue)2026 CoGS : f(Revenue)2027 CoGS : f(Revenue)2028 CoGS : f(Revenue)2029 CoGS : f(Revenue)2030 CoGS : f(Revenue)2031 CoGS : f(Revenue)2032
63.266% 6.327%
CoGS: 0.00% 0 0 0 0 0 0 0 0 0 0 0
Depreciation/Amortization [COGs] : f(Revenue)2022 Depreciation/Amortization [COGs] : f(Revenue)2023 Depreciation/Amortization [COGs] : f(Revenue)2024 Depreciation/Amortization [COGs] : f(Revenue)2025 Depreciation/Amortization [COGs] : f(Revenue)2026 Depreciation/Amortization [COGs] : f(Revenue)2027 Depreciation/Amortization [COGs] : f(Revenue)2028 Depreciation/Amortization [COGs] : f(Revenue)2029 Depreciation/Amortization [COGs] : f(Revenue)2030 Depreciation/Amortization [COGs] : f(Revenue)2031 Depreciation/Amortization [COGs] : f(Revenue)2032
9.221% 0.922%
D&A (Production): 0.00% 0 0 0 0 0 0 0 0 0 0 0
GROSS MARGIN: 100.00% 26,042 26,042 26,042 26,042 26,042 26,042 26,042 26,042 26,042 26,042 26,042
SGA (Only) : f(Revenue)2022 SGA (Only) : f(Revenue)2023 SGA (Only) : f(Revenue)2024 SGA (Only) : f(Revenue)2025 SGA (Only) : f(Revenue)2026 SGA (Only) : f(Revenue)2027 SGA (Only) : f(Revenue)2028 SGA (Only) : f(Revenue)2029 SGA (Only) : f(Revenue)2030 SGA (Only) : f(Revenue)2031 SGA (Only) : f(Revenue)2032
16.383% 1.638% Administrative Costs:
SGA: 0.00% 0 0 0 0 0 0 0 0 0 0 0
R&D : f(Revenue)2022 R&D : f(Revenue)2023 R&D : f(Revenue)2024 R&D : f(Revenue)2025 R&D : f(Revenue)2026 R&D : f(Revenue)2027 R&D : f(Revenue)2028 R&D : f(Revenue)2029 R&D : f(Revenue)2030 R&D : f(Revenue)2031 R&D : f(Revenue)2032
0.000% 0.000%
R & D: 0.00% 0 0 0 0 0 0 0 0 0 0 0
Depreciation/Amortization [SGA] : f(Revenue)2022 Depreciation/Amortization [SGA] : f(Revenue)2023 Depreciation/Amortization [SGA] : f(Revenue)2024 Depreciation/Amortization [SGA] : f(Revenue)2025 Depreciation/Amortization [SGA] : f(Revenue)2026 Depreciation/Amortization [SGA] : f(Revenue)2027 Depreciation/Amortization [SGA] : f(Revenue)2028 Depreciation/Amortization [SGA] : f(Revenue)2029 Depreciation/Amortization [SGA] : f(Revenue)2030 Depreciation/Amortization [SGA] : f(Revenue)2031 Depreciation/Amortization [SGA] : f(Revenue)2032
6.179% 0.618%
D & A [SGA]: 0.00% 0 0 0 0 0 0 0 0 0 0 0
Admin Expenses: 0.00% 0 0 0 0 0 0 0 0 0 0 0
Other Expense (Income) : f(Revenue)2022 Other Expense (Income) : f(Revenue)2023 Other Expense (Income) : f(Revenue)2024 Other Expense (Income) : f(Revenue)2025 Other Expense (Income) : f(Revenue)2026 Other Expense (Income) : f(Revenue)2027 Other Expense (Income) : f(Revenue)2028 Other Expense (Income) : f(Revenue)2029 Other Expense (Income) : f(Revenue)2030 Other Expense (Income) : f(Revenue)2031 Other Expense (Income) : f(Revenue)2032
-0.570% 0.057%
Other: 0.00% 0 0 0 0 0 0 0 0 0 0 0
EBIT: 100.00% 26,042 26,042 26,042 26,042 26,042 26,042 26,042 26,042 26,042 26,042 26,042
Interest Expense (Income) : f(Revenue)2022 Interest Expense (Income) : f(Revenue)2023 Interest Expense (Income) : f(Revenue)2024 Interest Expense (Income) : f(Revenue)2025 Interest Expense (Income) : f(Revenue)2026 Interest Expense (Income) : f(Revenue)2027 Interest Expense (Income) : f(Revenue)2028 Interest Expense (Income) : f(Revenue)2029 Interest Expense (Income) : f(Revenue)2030 Interest Expense (Income) : f(Revenue)2031 Interest Expense (Income) : f(Revenue)2032
1.250% 0.125%
Interest Expense: 0.00% 0 0 0 0 0 0 0 0 0 0 0
EBT: 100.00% 26,042 26,042 26,042 26,042 26,042 26,042 26,042 26,042 26,042 26,042 26,042
Tax Rate : f(EBT)2022 Tax Rate : f(EBT)2023 Tax Rate : f(EBT)2024 Tax Rate : f(EBT)2025 Tax Rate : f(EBT)2026 Tax Rate : f(EBT)2027 Tax Rate : f(EBT)2028 Tax Rate : f(EBT)2029 Tax Rate : f(EBT)2030 Tax Rate : f(EBT)2031 Tax Rate : f(EBT)2032
21.000% 2.100%
Taxes: 0.00% 0 0 0 0 0 0 0 0 0 0 0
Tax Payable Tax Payable Tax Payable Tax Payable Tax Payable Tax Payable Tax Payable Tax Payable Tax Payable Tax Payable Tax Payable
NET EARNINGS: 100.00% 26,042 26,042 26,042 26,042 26,042 26,042 26,042 26,042 26,042 26,042 26,042
D&A Add‐Back: 0.00% 0 0 0 0 0 0 0 0 0 0 0
Capital Expenditures : f(Revenue)2022 Capital Expenditures : f(Revenue)2023 Capital Expenditures : f(Revenue)2024 Capital Expenditures : f(Revenue)2025 Capital Expenditures : f(Revenue)2026 Capital Expenditures : f(Revenue)2027 Capital Expenditures : f(Revenue)2028 Capital Expenditures : f(Revenue)2029 Capital Expenditures : f(Revenue)2030 Capital Expenditures : f(Revenue)2031 Capital Expenditures : f(Revenue)2032
8.079% 0.808%
CAP EX: 0.00% 0 0 0 0 0 0 0 0 0 0 0
Δ  Working Capital : f(Revenue)2022 Δ  Working Capital : f(Revenue)2023 Δ  Working Capital : f(Revenue)2024 Δ  Working Capital : f(Revenue)2025 Δ  Working Capital : f(Revenue)2026 Δ  Working Capital : f(Revenue)2027 Δ  Working Capital : f(Revenue)2028 Δ  Working Capital : f(Revenue)2029 Δ  Working Capital : f(Revenue)2030 Δ  Working Capital : f(Revenue)2031 Δ  Working Capital : f(Revenue)2032
0.000% 0.000%
Δ WRK CAP: 0.00% 0 0 0 0 0 0 0 0 0 0 0
Equity Minority Interest : f(Revenue)2022 Equity Minority Interest : f(Revenue)2023 Equity Minority Interest : f(Revenue)2024 Equity Minority Interest : f(Revenue)2025 Equity Minority Interest : f(Revenue)2026 Equity Minority Interest : f(Revenue)2027 Equity Minority Interest : f(Revenue)2028 Equity Minority Interest : f(Revenue)2029 Equity Minority Interest : f(Revenue)2030 Equity Minority Interest : f(Revenue)2031 Equity Minority Interest : f(Revenue)2032
0.000% 0.000%
EARN AFFL: 0.00% 0 0 0 0 0 0 0 0 0 0 0
‐45,227 LESS CURRENT DEBT AND OTHER LONG-TERM LIABILITIES T₀ (Adjusted for Carrying Costs )
0 LESS PREFERRED AT PAR T₀
3,445 EXCESS CASH & SHORT-TERM SECURITIES T₀ GROWTH 2.500%
DCF analysis will deduct the total value of liabilities from the firm's cash position. PERPETUITY VALUE
FCF to Equity 26,042 26,042 26,042 26,042 26,042 26,042 26,042 26,042 26,042 26,042 26,042 1,015,065
WACC FOR SIMULATION
5.130% 0.103% To assess liquidity at T₀, DCF analysis will deduct Balance Sheet Liabilities from Cash + Short‐term securities.
DCF to the Investors 1,259,745 DCF analysis will deduct the total value of liabilities from the firm's cash position.
KHC: Kraft Heinz Co. | FEIN: 46-2078182: Monte Carlo: Valuation Per Share | $USD PER SHARE
Beharry, Lyndon Martin W. 2022‐07‐22_KHC_MC‐Equity‐1Million|DCF All Variable_MC 07/22/2022 15:04 | Page 10 of 17
Equity Valuation 2022‐07‐22_KHC_MC‐Equity‐1Million Financial Statement Review
Type alternative annual growth rates here:
KHC: Kraft Heinz Co. | FEIN: 46‐2078182: Monte Carlo: Valuation Per Share |  $USD Mask Monetary Values In 1,000,000 $USD (Except Per Share Values).
1,000,000 $USD Revenue Growth Rate2022 Revenue Growth Rate2023 Revenue Growth Rate2024 Revenue Growth Rate2025 Revenue Growth Rate2026 Revenue Growth Rate2027 Revenue Growth Rate2028 Revenue Growth Rate2029 Revenue Growth Rate2030 Revenue Growth Rate2031 Revenue Growth Rate2032
Projection Base [FY] Year T0  2021 2021 2022 2023 2024 2025 2026 2027 2028 2029 2030 2031 2032
Mean STDEV 0 1 2 3 4 5 6 7 8 9 10
Revenue Growth Rate 2022 00.0% Revenue Growth Rate 2023 00.0% Revenue Growth Rate 2024 00.0% Revenue Growth Rate 2025 00.0% Revenue Growth Rate 2026 00.0% Revenue Growth Rate 2027 00.0% Revenue Growth Rate 2028 00.0% Revenue Growth Rate 2029 00.0% Revenue Growth Rate 2030 00.0% Revenue Growth Rate 2031 00.0% Revenue Growth Rate 2032 00.0%
0.000% 0.000% Random Growth Rate 0.00% 0.00% 0.00% 0.00% 0.00% 0.00% 0.00% 0.00% 0.00% 0.00% 0.00%
Sequential Reduction 0.000% Alternate Coefficient of Variability 10.00% 0.00% 0.00% 0.00% 0.00% 0.00% 0.00% 0.00% 0.00% 0.00% 0.00% 0.00%
Timet0 Timet+1 Timet+2 Timet+3 Timet+4 Timet+5 Timet+6 Timet+7 Timet+8 Timet+9 Timet+10 Timet+11
Projection TimeT1
26,042 MONTE CARLO REVENUE 26,042 26,042 26,042 26,042 26,042 26,042 26,042 26,042 26,042 26,042 26,042
CoGS : f(Revenue)2022 CoGS : f(Revenue)2023 CoGS : f(Revenue)2024 CoGS : f(Revenue)2025 CoGS : f(Revenue)2026 CoGS : f(Revenue)2027 CoGS : f(Revenue)2028 CoGS : f(Revenue)2029 CoGS : f(Revenue)2030 CoGS : f(Revenue)2031 CoGS : f(Revenue)2032
63.266% 6.327% 55.413% 60.845% 68.201% 72.433% 62.177% 72.800% 68.786% 62.963% 56.308% 54.551% 67.578%
CoGS: 63.82% ‐14,431 ‐15,845 ‐17,761 ‐18,863 ‐16,192 ‐18,958 ‐17,913 ‐16,397 ‐14,664 ‐14,206 ‐17,599
Depreciation/Amortization [COGs] : f(Revenue)2022 Depreciation/Amortization [COGs] : f(Revenue)2023 Depreciation/Amortization [COGs] : f(Revenue)2024 Depreciation/Amortization [COGs] : f(Revenue)2025 Depreciation/Amortization [COGs] : f(Revenue)2026 Depreciation/Amortization [COGs] : f(Revenue)2027 Depreciation/Amortization [COGs] : f(Revenue)2028 Depreciation/Amortization [COGs] : f(Revenue)2029 Depreciation/Amortization [COGs] : f(Revenue)2030 Depreciation/Amortization [COGs] : f(Revenue)2031 Depreciation/Amortization [COGs] : f(Revenue)2032
9.221% 0.922% 9.437% 10.099% 8.328% 10.086% 9.329% 11.038% 10.339% 8.902% 8.651% 8.100% 8.455%
D&A (Production): 9.34% ‐2,458 ‐2,630 ‐2,169 ‐2,626 ‐2,430 ‐2,875 ‐2,693 ‐2,318 ‐2,253 ‐2,109 ‐2,202
GROSS MARGIN: 26.83% 9,154 7,567 6,112 4,553 7,420 4,209 5,436 7,327 9,125 9,726 6,241
SGA (Only) : f(Revenue)2022 SGA (Only) : f(Revenue)2023 SGA (Only) : f(Revenue)2024 SGA (Only) : f(Revenue)2025 SGA (Only) : f(Revenue)2026 SGA (Only) : f(Revenue)2027 SGA (Only) : f(Revenue)2028 SGA (Only) : f(Revenue)2029 SGA (Only) : f(Revenue)2030 SGA (Only) : f(Revenue)2031 SGA (Only) : f(Revenue)2032
16.383% 1.638% Administrative Costs: 16.127% 15.860% 15.795% 17.675% 16.731% 16.543% 15.403% 18.667% 16.551% 17.521% 15.812%
SGA: 16.13% ‐4,200 ‐4,200 ‐4,200 ‐4,200 ‐4,200 ‐4,200 ‐4,200 ‐4,200 ‐4,200 ‐4,200 ‐4,200
R&D : f(Revenue)2022 R&D : f(Revenue)2023 R&D : f(Revenue)2024 R&D : f(Revenue)2025 R&D : f(Revenue)2026 R&D : f(Revenue)2027 R&D : f(Revenue)2028 R&D : f(Revenue)2029 R&D : f(Revenue)2030 R&D : f(Revenue)2031 R&D : f(Revenue)2032
0.000% 0.000% 0.000% 0.000% 0.000% 0.000% 0.000% 0.000% 0.000% 0.000% 0.000% 0.000% 0.000%
R & D: 0.00% 0 0 0 0 0 0 0 0 0 0 0
Depreciation/Amortization [SGA] : f(Revenue)2022 Depreciation/Amortization [SGA] : f(Revenue)2023 Depreciation/Amortization [SGA] : f(Revenue)2024 Depreciation/Amortization [SGA] : f(Revenue)2025 Depreciation/Amortization [SGA] : f(Revenue)2026 Depreciation/Amortization [SGA] : f(Revenue)2027 Depreciation/Amortization [SGA] : f(Revenue)2028 Depreciation/Amortization [SGA] : f(Revenue)2029 Depreciation/Amortization [SGA] : f(Revenue)2030 Depreciation/Amortization [SGA] : f(Revenue)2031 Depreciation/Amortization [SGA] : f(Revenue)2032
6.179% 0.618% 5.920% 5.770% 6.297% 5.786% 6.291% 6.960% 6.602% 5.918% 7.110% 6.718% 6.263%
D & A [SGA]: 6.33% ‐1,542 ‐1,503 ‐1,640 ‐1,507 ‐1,638 ‐1,812 ‐1,719 ‐1,541 ‐1,851 ‐1,749 ‐1,631
Admin Expenses: 22.46% ‐5,741 ‐5,702 ‐5,840 ‐5,707 ‐5,838 ‐6,012 ‐5,919 ‐5,741 ‐6,051 ‐5,949 ‐5,831
Other Expense (Income) : f(Revenue)2022 Other Expense (Income) : f(Revenue)2023 Other Expense (Income) : f(Revenue)2024 Other Expense (Income) : f(Revenue)2025 Other Expense (Income) : f(Revenue)2026 Other Expense (Income) : f(Revenue)2027 Other Expense (Income) : f(Revenue)2028 Other Expense (Income) : f(Revenue)2029 Other Expense (Income) : f(Revenue)2030 Other Expense (Income) : f(Revenue)2031 Other Expense (Income) : f(Revenue)2032
-0.570% 0.057% ‐0.576% ‐0.630% ‐0.583% ‐0.585% ‐0.550% ‐0.599% ‐0.576% ‐0.636% ‐0.552% ‐0.575% ‐0.505%
Other: ‐0.58% 150 164 152 152 143 156 150 166 144 150 132
EBIT: 4.96% 3,562 2,028 424 ‐1,002 1,726 ‐1,647 ‐333 1,752 3,218 3,927 542
Interest Expense (Income) : f(Revenue)2022 Interest Expense (Income) : f(Revenue)2023 Interest Expense (Income) : f(Revenue)2024 Interest Expense (Income) : f(Revenue)2025 Interest Expense (Income) : f(Revenue)2026 Interest Expense (Income) : f(Revenue)2027 Interest Expense (Income) : f(Revenue)2028 Interest Expense (Income) : f(Revenue)2029 Interest Expense (Income) : f(Revenue)2030 Interest Expense (Income) : f(Revenue)2031 Interest Expense (Income) : f(Revenue)2032
1.250% 0.125% 1.248% 1.289% 1.302% 1.356% 1.163% 1.358% 1.206% 1.140% 1.418% 1.303% 1.312%
Interest Expense: 1.28% ‐325 ‐336 ‐339 ‐353 ‐303 ‐354 ‐314 ‐297 ‐369 ‐339 ‐342
EBT: 3.68% 3,237 1,693 85 ‐1,355 1,423 ‐2,001 ‐647 1,455 2,849 3,588 201
Tax Rate : f(EBT)2022 Tax Rate : f(EBT)2023 Tax Rate : f(EBT)2024 Tax Rate : f(EBT)2025 Tax Rate : f(EBT)2026 Tax Rate : f(EBT)2027 Tax Rate : f(EBT)2028 Tax Rate : f(EBT)2029 Tax Rate : f(EBT)2030 Tax Rate : f(EBT)2031 Tax Rate : f(EBT)2032
21.000% 2.100% 23.804% 19.014% 24.301% 20.969% 21.004% 22.875% 21.585% 22.852% 19.911% 21.130% 22.226%
Taxes: 5.65% ‐771 ‐322 ‐21 284 46 408 587 224 ‐229 ‐758 ‐45
Tax Payable Tax Payable Tax Payable Tax Payable Tax Payable Tax Payable Tax Payable Tax Payable Tax Payable Tax Payable Tax Payable
NET EARNINGS: 3.47% 2,467 1,371 65 ‐1,071 1,468 ‐1,593 ‐60 1,679 2,620 2,830 156
D&A Add‐Back: 15.67% 3,999 4,133 3,809 4,133 4,068 4,687 4,412 3,859 4,104 3,859 3,833
Capital Expenditures : f(Revenue)2022 Capital Expenditures : f(Revenue)2023 Capital Expenditures : f(Revenue)2024 Capital Expenditures : f(Revenue)2025 Capital Expenditures : f(Revenue)2026 Capital Expenditures : f(Revenue)2027 Capital Expenditures : f(Revenue)2028 Capital Expenditures : f(Revenue)2029 Capital Expenditures : f(Revenue)2030 Capital Expenditures : f(Revenue)2031 Capital Expenditures : f(Revenue)2032
8.079% 0.808% 8.369% 8.267% 7.144% 9.248% 9.353% 6.908% 7.738% 8.069% 8.503% 8.383% 6.651%
CAP EX: 8.06% ‐2,179 ‐2,153 ‐1,861 ‐2,408 ‐2,436 ‐1,799 ‐2,015 ‐2,101 ‐2,214 ‐2,183 ‐1,732
Δ  Working Capital : f(Revenue)2022 Δ  Working Capital : f(Revenue)2023 Δ  Working Capital : f(Revenue)2024 Δ  Working Capital : f(Revenue)2025 Δ  Working Capital : f(Revenue)2026 Δ  Working Capital : f(Revenue)2027 Δ  Working Capital : f(Revenue)2028 Δ  Working Capital : f(Revenue)2029 Δ  Working Capital : f(Revenue)2030 Δ  Working Capital : f(Revenue)2031 Δ  Working Capital : f(Revenue)2032
0.000% 0.000% 0.000% 0.000% 0.000% 0.000% 0.000% 0.000% 0.000% 0.000% 0.000% 0.000% 0.000%
Δ WRK CAP: 0.00% 0 0 0 0 0 0 0 0 0 0 0
Equity Minority Interest : f(Revenue)2022 Equity Minority Interest : f(Revenue)2023 Equity Minority Interest : f(Revenue)2024 Equity Minority Interest : f(Revenue)2025 Equity Minority Interest : f(Revenue)2026 Equity Minority Interest : f(Revenue)2027 Equity Minority Interest : f(Revenue)2028 Equity Minority Interest : f(Revenue)2029 Equity Minority Interest : f(Revenue)2030 Equity Minority Interest : f(Revenue)2031 Equity Minority Interest : f(Revenue)2032
0.000% 0.000% 0.000% 0.000% 0.000% 0.000% 0.000% 0.000% 0.000% 0.000% 0.000% 0.000% 0.000%
EARN AFFL: 0.00% 0 0 0 0 0 0 0 0 0 0 0
‐45,227 LESS CURRENT DEBT AND OTHER LONG-TERM LIABILITIES T₀ (Adjusted for Carrying Costs )
0 LESS PREFERRED AT PAR T₀
3,445 EXCESS CASH & SHORT-TERM SECURITIES T₀ GROWTH 2.500%
DCF analysis will deduct the total value of liabilities from the firm's cash position. PERPETUITY VALUE
FCF to Equity 4,287 3,351 2,013 654 3,100 1,295 2,337 3,437 4,510 4,505 2,257 87,966
WACC FOR SIMULATION
5.130% 0.103% To assess liquidity at T₀, DCF analysis will deduct Balance Sheet Liabilities from Cash + Short‐term securities.
5.056% DCF to the Investors 30,589 DCF analysis will deduct the total value of liabilities from the firm's cash position.
KHC: Kraft Heinz Co. | FEIN: 46-2078182: Monte Carlo: Valuation Per Share | $USD 24.919 PER SHARE
Beharry, Lyndon Martin W. 2022‐07‐22_KHC_MC‐Equity‐1Million|DCF All Variable_MC 07/22/2022 14:25 | Page 10A of 17
Equity Valuation 2022‐07‐22_KHC_MC‐Equity‐1Million Financial Statement Review
Type alternative annual growth rates here:
KHC: Kraft Heinz Co. | FEIN: 46‐2078182: Monte Carlo: Valuation Per Share |  $USD Mask Monetary Values In 1,000,000 $USD (Except Per Share Values).
1,000,000 $USD Revenue Growth Rate2022 Revenue Growth Rate2023 Revenue Growth Rate2024 Revenue Growth Rate2025 Revenue Growth Rate2026 Revenue Growth Rate2027 Revenue Growth Rate2028 Revenue Growth Rate2029 Revenue Growth Rate2030 Revenue Growth Rate2031 Revenue Growth Rate2032
Projection Base [FY] Year T0  2021 2021 2022 2023 2024 2025 2026 2027 2028 2029 2030 2031 2032
Mean STDEV 0 1 2 3 4 5 6 7 8 9 10
Revenue Growth Rate 2022 00.0% Revenue Growth Rate 2023 00.0% Revenue Growth Rate 2024 00.0% Revenue Growth Rate 2025 00.0% Revenue Growth Rate 2026 00.0% Revenue Growth Rate 2027 00.0% Revenue Growth Rate 2028 00.0% Revenue Growth Rate 2029 00.0% Revenue Growth Rate 2030 00.0% Revenue Growth Rate 2031 00.0% Revenue Growth Rate 2032 00.0%
0.000% 0.000% Random Growth Rate 0.00% 0.00% 0.00% 0.00% 0.00% 0.00% 0.00% 0.00% 0.00% 0.00% 0.00%
Sequential Reduction 0.000% Alternate Coefficient of Variability 10.00% 0.00% 0.00% 0.00% 0.00% 0.00% 0.00% 0.00% 0.00% 0.00% 0.00% 0.00%
Timet0 Timet+1 Timet+2 Timet+3 Timet+4 Timet+5 Timet+6 Timet+7 Timet+8 Timet+9 Timet+10 Timet+11
Projection TimeT1
26,042 MONTE CARLO REVENUE 26,042 26,042 26,042 26,042 26,042 26,042 26,042 26,042 26,042 26,042 26,042
CoGS : f(Revenue)2022 CoGS : f(Revenue)2023 CoGS : f(Revenue)2024 CoGS : f(Revenue)2025 CoGS : f(Revenue)2026 CoGS : f(Revenue)2027 CoGS : f(Revenue)2028 CoGS : f(Revenue)2029 CoGS : f(Revenue)2030 CoGS : f(Revenue)2031 CoGS : f(Revenue)2032
63.266% 6.327% 57.182% 59.210% 74.837% 68.070% 67.817% 53.935% 66.437% 63.980% 65.936% 62.659% 66.957%
CoGS: 64.27% ‐14,891 ‐15,419 ‐19,489 ‐17,727 ‐17,661 ‐14,046 ‐17,301 ‐16,662 ‐17,171 ‐16,318 ‐17,437
Depreciation/Amortization [COGs] : f(Revenue)2022 Depreciation/Amortization [COGs] : f(Revenue)2023 Depreciation/Amortization [COGs] : f(Revenue)2024 Depreciation/Amortization [COGs] : f(Revenue)2025 Depreciation/Amortization [COGs] : f(Revenue)2026 Depreciation/Amortization [COGs] : f(Revenue)2027 Depreciation/Amortization [COGs] : f(Revenue)2028 Depreciation/Amortization [COGs] : f(Revenue)2029 Depreciation/Amortization [COGs] : f(Revenue)2030 Depreciation/Amortization [COGs] : f(Revenue)2031 Depreciation/Amortization [COGs] : f(Revenue)2032
9.221% 0.922% 9.672% 9.960% 10.275% 9.717% 9.497% 10.385% 9.982% 9.989% 7.926% 9.421% 8.088%
D&A (Production): 9.54% ‐2,519 ‐2,594 ‐2,676 ‐2,531 ‐2,473 ‐2,704 ‐2,599 ‐2,601 ‐2,064 ‐2,454 ‐2,106
GROSS MARGIN: 26.19% 8,632 8,029 3,877 5,785 5,908 9,292 6,141 6,779 6,807 7,271 6,499
SGA (Only) : f(Revenue)2022 SGA (Only) : f(Revenue)2023 SGA (Only) : f(Revenue)2024 SGA (Only) : f(Revenue)2025 SGA (Only) : f(Revenue)2026 SGA (Only) : f(Revenue)2027 SGA (Only) : f(Revenue)2028 SGA (Only) : f(Revenue)2029 SGA (Only) : f(Revenue)2030 SGA (Only) : f(Revenue)2031 SGA (Only) : f(Revenue)2032
16.383% 1.638% Administrative Costs: 17.248% 16.391% 14.507% 18.390% 14.610% 12.232% 16.796% 15.864% 16.149% 16.546% 15.182%
SGA: 17.25% ‐4,492 ‐4,492 ‐4,492 ‐4,492 ‐4,492 ‐4,492 ‐4,492 ‐4,492 ‐4,492 ‐4,492 ‐4,492
R&D : f(Revenue)2022 R&D : f(Revenue)2023 R&D : f(Revenue)2024 R&D : f(Revenue)2025 R&D : f(Revenue)2026 R&D : f(Revenue)2027 R&D : f(Revenue)2028 R&D : f(Revenue)2029 R&D : f(Revenue)2030 R&D : f(Revenue)2031 R&D : f(Revenue)2032
0.000% 0.000% 0.000% 0.000% 0.000% 0.000% 0.000% 0.000% 0.000% 0.000% 0.000% 0.000% 0.000%
R & D: 0.00% 0 0 0 0 0 0 0 0 0 0 0
Depreciation/Amortization [SGA] : f(Revenue)2022 Depreciation/Amortization [SGA] : f(Revenue)2023 Depreciation/Amortization [SGA] : f(Revenue)2024 Depreciation/Amortization [SGA] : f(Revenue)2025 Depreciation/Amortization [SGA] : f(Revenue)2026 Depreciation/Amortization [SGA] : f(Revenue)2027 Depreciation/Amortization [SGA] : f(Revenue)2028 Depreciation/Amortization [SGA] : f(Revenue)2029 Depreciation/Amortization [SGA] : f(Revenue)2030 Depreciation/Amortization [SGA] : f(Revenue)2031 Depreciation/Amortization [SGA] : f(Revenue)2032
6.179% 0.618% 6.544% 6.149% 6.274% 6.670% 7.642% 6.661% 5.578% 6.147% 5.438% 5.130% 6.896%
D & A [SGA]: 6.28% ‐1,704 ‐1,601 ‐1,634 ‐1,737 ‐1,990 ‐1,735 ‐1,453 ‐1,601 ‐1,416 ‐1,336 ‐1,796
Admin Expenses: 23.53% ‐6,196 ‐6,093 ‐6,126 ‐6,229 ‐6,482 ‐6,227 ‐5,944 ‐6,093 ‐5,908 ‐5,828 ‐6,288
Other Expense (Income) : f(Revenue)2022 Other Expense (Income) : f(Revenue)2023 Other Expense (Income) : f(Revenue)2024 Other Expense (Income) : f(Revenue)2025 Other Expense (Income) : f(Revenue)2026 Other Expense (Income) : f(Revenue)2027 Other Expense (Income) : f(Revenue)2028 Other Expense (Income) : f(Revenue)2029 Other Expense (Income) : f(Revenue)2030 Other Expense (Income) : f(Revenue)2031 Other Expense (Income) : f(Revenue)2032
-0.570% 0.057% ‐0.493% ‐0.615% ‐0.560% ‐0.589% ‐0.649% ‐0.607% ‐0.592% ‐0.597% ‐0.553% ‐0.530% ‐0.470%
Other: ‐0.57% 128 160 146 153 169 158 154 156 144 138 122
EBIT: 3.22% 2,564 2,096 ‐2,103 ‐291 ‐405 3,224 351 842 1,043 1,581 334
Interest Expense (Income) : f(Revenue)2022 Interest Expense (Income) : f(Revenue)2023 Interest Expense (Income) : f(Revenue)2024 Interest Expense (Income) : f(Revenue)2025 Interest Expense (Income) : f(Revenue)2026 Interest Expense (Income) : f(Revenue)2027 Interest Expense (Income) : f(Revenue)2028 Interest Expense (Income) : f(Revenue)2029 Interest Expense (Income) : f(Revenue)2030 Interest Expense (Income) : f(Revenue)2031 Interest Expense (Income) : f(Revenue)2032
1.250% 0.125% 1.408% 1.265% 1.303% 1.473% 1.178% 1.372% 1.275% 1.235% 1.279% 1.446% 1.292%
Interest Expense: 1.32% ‐367 ‐329 ‐339 ‐384 ‐307 ‐357 ‐332 ‐322 ‐333 ‐376 ‐336
EBT: 1.90% 2,197 1,766 ‐2,442 ‐674 ‐712 2,866 19 520 710 1,204 ‐3
Tax Rate : f(EBT)2022 Tax Rate : f(EBT)2023 Tax Rate : f(EBT)2024 Tax Rate : f(EBT)2025 Tax Rate : f(EBT)2026 Tax Rate : f(EBT)2027 Tax Rate : f(EBT)2028 Tax Rate : f(EBT)2029 Tax Rate : f(EBT)2030 Tax Rate : f(EBT)2031 Tax Rate : f(EBT)2032
21.000% 2.100% 21.843% 22.227% 21.040% 21.069% 16.987% 21.929% 22.826% 20.053% 17.735% 20.979% 24.416%
Taxes: 29.19% ‐480 ‐393 514 694 850 214 183 162 119 ‐272 1
Tax Payable Tax Payable Tax Payable Tax Payable Tax Payable Tax Payable Tax Payable Tax Payable Tax Payable Tax Payable Tax Payable
NET EARNINGS: 2.46% 1,717 1,374 ‐1,928 20 138 3,081 202 683 828 933 ‐2
D&A Add‐Back: 15.82% 4,223 4,195 4,310 4,268 4,463 4,439 4,052 4,202 3,480 3,790 3,902
Capital Expenditures : f(Revenue)2022 Capital Expenditures : f(Revenue)2023 Capital Expenditures : f(Revenue)2024 Capital Expenditures : f(Revenue)2025 Capital Expenditures : f(Revenue)2026 Capital Expenditures : f(Revenue)2027 Capital Expenditures : f(Revenue)2028 Capital Expenditures : f(Revenue)2029 Capital Expenditures : f(Revenue)2030 Capital Expenditures : f(Revenue)2031 Capital Expenditures : f(Revenue)2032
8.079% 0.808% 10.405% 7.157% 8.311% 8.393% 8.589% 9.343% 8.120% 8.880% 6.539% 8.420% 9.039%
CAP EX: 8.47% ‐2,710 ‐1,864 ‐2,164 ‐2,186 ‐2,237 ‐2,433 ‐2,115 ‐2,313 ‐1,703 ‐2,193 ‐2,354
Δ  Working Capital : f(Revenue)2022 Δ  Working Capital : f(Revenue)2023 Δ  Working Capital : f(Revenue)2024 Δ  Working Capital : f(Revenue)2025 Δ  Working Capital : f(Revenue)2026 Δ  Working Capital : f(Revenue)2027 Δ  Working Capital : f(Revenue)2028 Δ  Working Capital : f(Revenue)2029 Δ  Working Capital : f(Revenue)2030 Δ  Working Capital : f(Revenue)2031 Δ  Working Capital : f(Revenue)2032
0.000% 0.000% 0.000% 0.000% 0.000% 0.000% 0.000% 0.000% 0.000% 0.000% 0.000% 0.000% 0.000%
Δ WRK CAP: 0.00% 0 0 0 0 0 0 0 0 0 0 0
Equity Minority Interest : f(Revenue)2022 Equity Minority Interest : f(Revenue)2023 Equity Minority Interest : f(Revenue)2024 Equity Minority Interest : f(Revenue)2025 Equity Minority Interest : f(Revenue)2026 Equity Minority Interest : f(Revenue)2027 Equity Minority Interest : f(Revenue)2028 Equity Minority Interest : f(Revenue)2029 Equity Minority Interest : f(Revenue)2030 Equity Minority Interest : f(Revenue)2031 Equity Minority Interest : f(Revenue)2032
0.000% 0.000% 0.000% 0.000% 0.000% 0.000% 0.000% 0.000% 0.000% 0.000% 0.000% 0.000% 0.000%
EARN AFFL: 0.00% 0 0 0 0 0 0 0 0 0 0 0
‐45,227 LESS CURRENT DEBT AND OTHER LONG-TERM LIABILITIES T₀ (Adjusted for Carrying Costs )
0 LESS PREFERRED AT PAR T₀
3,445 EXCESS CASH & SHORT-TERM SECURITIES T₀ GROWTH 2.500%
DCF analysis will deduct the total value of liabilities from the firm's cash position. PERPETUITY VALUE
FCF to Equity 3,231 3,705 217 2,101 2,364 5,086 2,139 2,572 2,606 2,529 1,546 60,267
WACC FOR SIMULATION
5.130% 0.103% To assess liquidity at T₀, DCF analysis will deduct Balance Sheet Liabilities from Cash + Short‐term securities.
5.039% DCF to the Investors 12,986 DCF analysis will deduct the total value of liabilities from the firm's cash position.
KHC: Kraft Heinz Co. | FEIN: 46-2078182: Monte Carlo: Valuation Per Share | $USD 10.579 PER SHARE
Beharry, Lyndon Martin W. 2022‐07‐22_KHC_MC‐Equity‐1Million|DCF All Variable_MC 07/22/2022 14:26 | Page 10B of 17
Equity Valuation 2022‐07‐22_KHC_MC‐Equity‐1Million Financial Statement Review
Type alternative annual growth rates here:
KHC: Kraft Heinz Co. | FEIN: 46‐2078182: Monte Carlo: Valuation Per Share |  $USD Mask Monetary Values In 1,000,000 $USD (Except Per Share Values).
1,000,000 $USD Revenue Growth Rate2022 Revenue Growth Rate2023 Revenue Growth Rate2024 Revenue Growth Rate2025 Revenue Growth Rate2026 Revenue Growth Rate2027 Revenue Growth Rate2028 Revenue Growth Rate2029 Revenue Growth Rate2030 Revenue Growth Rate2031 Revenue Growth Rate2032
Projection Base [FY] Year T0  2021 2021 2022 2023 2024 2025 2026 2027 2028 2029 2030 2031 2032
Mean STDEV 0 1 2 3 4 5 6 7 8 9 10
Revenue Growth Rate 2022 00.0% Revenue Growth Rate 2023 00.0% Revenue Growth Rate 2024 00.0% Revenue Growth Rate 2025 00.0% Revenue Growth Rate 2026 00.0% Revenue Growth Rate 2027 00.0% Revenue Growth Rate 2028 00.0% Revenue Growth Rate 2029 00.0% Revenue Growth Rate 2030 00.0% Revenue Growth Rate 2031 00.0% Revenue Growth Rate 2032 00.0%
0.000% 0.000% Random Growth Rate 0.00% 0.00% 0.00% 0.00% 0.00% 0.00% 0.00% 0.00% 0.00% 0.00% 0.00%
Sequential Reduction 0.000% Alternate Coefficient of Variability 10.00% 0.00% 0.00% 0.00% 0.00% 0.00% 0.00% 0.00% 0.00% 0.00% 0.00% 0.00%
Timet0 Timet+1 Timet+2 Timet+3 Timet+4 Timet+5 Timet+6 Timet+7 Timet+8 Timet+9 Timet+10 Timet+11
Projection TimeT1
26,042 MONTE CARLO REVENUE 26,042 26,042 26,042 26,042 26,042 26,042 26,042 26,042 26,042 26,042 26,042
CoGS : f(Revenue)2022 CoGS : f(Revenue)2023 CoGS : f(Revenue)2024 CoGS : f(Revenue)2025 CoGS : f(Revenue)2026 CoGS : f(Revenue)2027 CoGS : f(Revenue)2028 CoGS : f(Revenue)2029 CoGS : f(Revenue)2030 CoGS : f(Revenue)2031 CoGS : f(Revenue)2032
63.266% 6.327% 69.209% 64.312% 57.547% 64.532% 62.114% 61.800% 62.350% 71.018% 61.739% 68.454% 52.417%
CoGS: 63.23% ‐18,023 ‐16,748 ‐14,986 ‐16,805 ‐16,176 ‐16,094 ‐16,237 ‐18,494 ‐16,078 ‐17,827 ‐13,650
Depreciation/Amortization [COGs] : f(Revenue)2022 Depreciation/Amortization [COGs] : f(Revenue)2023 Depreciation/Amortization [COGs] : f(Revenue)2024 Depreciation/Amortization [COGs] : f(Revenue)2025 Depreciation/Amortization [COGs] : f(Revenue)2026 Depreciation/Amortization [COGs] : f(Revenue)2027 Depreciation/Amortization [COGs] : f(Revenue)2028 Depreciation/Amortization [COGs] : f(Revenue)2029 Depreciation/Amortization [COGs] : f(Revenue)2030 Depreciation/Amortization [COGs] : f(Revenue)2031 Depreciation/Amortization [COGs] : f(Revenue)2032
9.221% 0.922% 9.284% 10.122% 9.636% 9.848% 7.522% 8.840% 9.809% 8.246% 10.115% 9.752% 8.524%
D&A (Production): 9.25% ‐2,418 ‐2,636 ‐2,509 ‐2,565 ‐1,959 ‐2,302 ‐2,554 ‐2,147 ‐2,634 ‐2,540 ‐2,220
GROSS MARGIN: 27.53% 5,601 6,658 8,546 6,672 7,907 7,646 7,251 5,400 7,330 5,676 10,172
SGA (Only) : f(Revenue)2022 SGA (Only) : f(Revenue)2023 SGA (Only) : f(Revenue)2024 SGA (Only) : f(Revenue)2025 SGA (Only) : f(Revenue)2026 SGA (Only) : f(Revenue)2027 SGA (Only) : f(Revenue)2028 SGA (Only) : f(Revenue)2029 SGA (Only) : f(Revenue)2030 SGA (Only) : f(Revenue)2031 SGA (Only) : f(Revenue)2032
16.383% 1.638% Administrative Costs: 14.726% 17.172% 16.847% 15.081% 15.246% 16.760% 14.575% 15.960% 18.479% 13.607% 17.097%
SGA: 14.73% ‐3,835 ‐3,835 ‐3,835 ‐3,835 ‐3,835 ‐3,835 ‐3,835 ‐3,835 ‐3,835 ‐3,835 ‐3,835
R&D : f(Revenue)2022 R&D : f(Revenue)2023 R&D : f(Revenue)2024 R&D : f(Revenue)2025 R&D : f(Revenue)2026 R&D : f(Revenue)2027 R&D : f(Revenue)2028 R&D : f(Revenue)2029 R&D : f(Revenue)2030 R&D : f(Revenue)2031 R&D : f(Revenue)2032
0.000% 0.000% 0.000% 0.000% 0.000% 0.000% 0.000% 0.000% 0.000% 0.000% 0.000% 0.000% 0.000%
R & D: 0.00% 0 0 0 0 0 0 0 0 0 0 0
Depreciation/Amortization [SGA] : f(Revenue)2022 Depreciation/Amortization [SGA] : f(Revenue)2023 Depreciation/Amortization [SGA] : f(Revenue)2024 Depreciation/Amortization [SGA] : f(Revenue)2025 Depreciation/Amortization [SGA] : f(Revenue)2026 Depreciation/Amortization [SGA] : f(Revenue)2027 Depreciation/Amortization [SGA] : f(Revenue)2028 Depreciation/Amortization [SGA] : f(Revenue)2029 Depreciation/Amortization [SGA] : f(Revenue)2030 Depreciation/Amortization [SGA] : f(Revenue)2031 Depreciation/Amortization [SGA] : f(Revenue)2032
6.179% 0.618% 6.835% 5.809% 5.891% 5.537% 5.660% 6.148% 6.813% 5.523% 7.782% 6.204% 5.972%
D & A [SGA]: 6.20% ‐1,780 ‐1,513 ‐1,534 ‐1,442 ‐1,474 ‐1,601 ‐1,774 ‐1,438 ‐2,027 ‐1,616 ‐1,555
Admin Expenses: 20.92% ‐5,615 ‐5,348 ‐5,369 ‐5,277 ‐5,309 ‐5,436 ‐5,609 ‐5,273 ‐5,862 ‐5,451 ‐5,390
Other Expense (Income) : f(Revenue)2022 Other Expense (Income) : f(Revenue)2023 Other Expense (Income) : f(Revenue)2024 Other Expense (Income) : f(Revenue)2025 Other Expense (Income) : f(Revenue)2026 Other Expense (Income) : f(Revenue)2027 Other Expense (Income) : f(Revenue)2028 Other Expense (Income) : f(Revenue)2029 Other Expense (Income) : f(Revenue)2030 Other Expense (Income) : f(Revenue)2031 Other Expense (Income) : f(Revenue)2032
-0.570% 0.057% ‐0.593% ‐0.532% ‐0.568% ‐0.454% ‐0.610% ‐0.667% ‐0.458% ‐0.598% ‐0.561% ‐0.548% ‐0.498%
Other: ‐0.55% 154 138 148 118 159 174 119 156 146 143 130
EBIT: 7.16% 140 1,448 3,325 1,513 2,757 2,383 1,760 283 1,614 368 4,911
Interest Expense (Income) : f(Revenue)2022 Interest Expense (Income) : f(Revenue)2023 Interest Expense (Income) : f(Revenue)2024 Interest Expense (Income) : f(Revenue)2025 Interest Expense (Income) : f(Revenue)2026 Interest Expense (Income) : f(Revenue)2027 Interest Expense (Income) : f(Revenue)2028 Interest Expense (Income) : f(Revenue)2029 Interest Expense (Income) : f(Revenue)2030 Interest Expense (Income) : f(Revenue)2031 Interest Expense (Income) : f(Revenue)2032
1.250% 0.125% 1.196% 1.257% 1.195% 1.435% 1.068% 1.469% 1.168% 1.110% 1.323% 1.250% 1.463%
Interest Expense: 1.27% ‐312 ‐327 ‐311 ‐374 ‐278 ‐383 ‐304 ‐289 ‐345 ‐325 ‐381
EBT: 5.89% ‐171 1,121 3,014 1,140 2,479 2,001 1,456 ‐7 1,270 42 4,530
Tax Rate : f(EBT)2022 Tax Rate : f(EBT)2023 Tax Rate : f(EBT)2024 Tax Rate : f(EBT)2025 Tax Rate : f(EBT)2026 Tax Rate : f(EBT)2027 Tax Rate : f(EBT)2028 Tax Rate : f(EBT)2029 Tax Rate : f(EBT)2030 Tax Rate : f(EBT)2031 Tax Rate : f(EBT)2032
21.000% 2.100% 22.894% 21.531% 23.779% 18.175% 20.340% 22.585% 20.941% 18.484% 20.297% 23.970% 23.073%
Taxes: 21.04% 0 ‐205 ‐717 ‐207 ‐504 ‐452 ‐305 1 ‐108 ‐10 ‐1,045
Forward Credit Tax Payable Tax Payable Tax Payable Tax Payable Tax Payable Tax Payable Tax Payable Tax Payable Tax Payable Tax Payable
NET EARNINGS: 4.65% ‐171 917 2,297 932 1,975 1,549 1,151 ‐5 1,162 32 3,485
D&A Add‐Back: 15.44% 4,198 4,149 4,044 4,007 3,433 3,903 4,329 3,586 4,661 4,155 3,775
Capital Expenditures : f(Revenue)2022 Capital Expenditures : f(Revenue)2023 Capital Expenditures : f(Revenue)2024 Capital Expenditures : f(Revenue)2025 Capital Expenditures : f(Revenue)2026 Capital Expenditures : f(Revenue)2027 Capital Expenditures : f(Revenue)2028 Capital Expenditures : f(Revenue)2029 Capital Expenditures : f(Revenue)2030 Capital Expenditures : f(Revenue)2031 Capital Expenditures : f(Revenue)2032
8.079% 0.808% 7.580% 8.183% 7.311% 6.796% 8.323% 8.275% 7.904% 8.394% 8.792% 9.115% 8.847%
CAP EX: 8.14% ‐1,974 ‐2,131 ‐1,904 ‐1,770 ‐2,168 ‐2,155 ‐2,058 ‐2,186 ‐2,289 ‐2,374 ‐2,304
Δ  Working Capital : f(Revenue)2022 Δ  Working Capital : f(Revenue)2023 Δ  Working Capital : f(Revenue)2024 Δ  Working Capital : f(Revenue)2025 Δ  Working Capital : f(Revenue)2026 Δ  Working Capital : f(Revenue)2027 Δ  Working Capital : f(Revenue)2028 Δ  Working Capital : f(Revenue)2029 Δ  Working Capital : f(Revenue)2030 Δ  Working Capital : f(Revenue)2031 Δ  Working Capital : f(Revenue)2032
0.000% 0.000% 0.000% 0.000% 0.000% 0.000% 0.000% 0.000% 0.000% 0.000% 0.000% 0.000% 0.000%
Δ WRK CAP: 0.00% 0 0 0 0 0 0 0 0 0 0 0
Equity Minority Interest : f(Revenue)2022 Equity Minority Interest : f(Revenue)2023 Equity Minority Interest : f(Revenue)2024 Equity Minority Interest : f(Revenue)2025 Equity Minority Interest : f(Revenue)2026 Equity Minority Interest : f(Revenue)2027 Equity Minority Interest : f(Revenue)2028 Equity Minority Interest : f(Revenue)2029 Equity Minority Interest : f(Revenue)2030 Equity Minority Interest : f(Revenue)2031 Equity Minority Interest : f(Revenue)2032
0.000% 0.000% 0.000% 0.000% 0.000% 0.000% 0.000% 0.000% 0.000% 0.000% 0.000% 0.000% 0.000%
EARN AFFL: 0.00% 0 0 0 0 0 0 0 0 0 0 0
‐45,227 LESS CURRENT DEBT AND OTHER LONG-TERM LIABILITIES T₀ (Adjusted for Carrying Costs )
0 LESS PREFERRED AT PAR T₀
3,445 EXCESS CASH & SHORT-TERM SECURITIES T₀ GROWTH 2.500%
DCF analysis will deduct the total value of liabilities from the firm's cash position. PERPETUITY VALUE
FCF to Equity 2,052 2,934 4,437 3,169 3,240 3,297 3,422 1,394 3,533 1,813 4,956 193,177
WACC FOR SIMULATION
5.130% 0.103% To assess liquidity at T₀, DCF analysis will deduct Balance Sheet Liabilities from Cash + Short‐term securities.
5.140% DCF to the Investors 89,605 DCF analysis will deduct the total value of liabilities from the firm's cash position.
KHC: Kraft Heinz Co. | FEIN: 46-2078182: Monte Carlo: Valuation Per Share | $USD 72.998 PER SHARE
Beharry, Lyndon Martin W. 2022‐07‐22_KHC_MC‐Equity‐1Million|DCF All Variable_MC 07/22/2022 14:26 | Page 10C of 17
Equity Valuation 2022‐07‐22_KHC_MC‐Equity‐1Million Financial Statement Review
Type alternative annual growth rates here:
KHC: Kraft Heinz Co. | FEIN: 46‐2078182: Monte Carlo: Valuation Per Share |  $USD Mask Monetary Values In 1,000,000 $USD (Except Per Share Values).
1,000,000 $USD Revenue Growth Rate2022 Revenue Growth Rate2023 Revenue Growth Rate2024 Revenue Growth Rate2025 Revenue Growth Rate2026 Revenue Growth Rate2027 Revenue Growth Rate2028 Revenue Growth Rate2029 Revenue Growth Rate2030 Revenue Growth Rate2031 Revenue Growth Rate2032
Projection Base [FY] Year T0  2021 2021 2022 2023 2024 2025 2026 2027 2028 2029 2030 2031 2032
Mean STDEV 0 1 2 3 4 5 6 7 8 9 10
Revenue Growth Rate 2022 00.0% Revenue Growth Rate 2023 00.0% Revenue Growth Rate 2024 00.0% Revenue Growth Rate 2025 00.0% Revenue Growth Rate 2026 00.0% Revenue Growth Rate 2027 00.0% Revenue Growth Rate 2028 00.0% Revenue Growth Rate 2029 00.0% Revenue Growth Rate 2030 00.0% Revenue Growth Rate 2031 00.0% Revenue Growth Rate 2032 00.0%
0.000% 0.000% Random Growth Rate 0.00% 0.00% 0.00% 0.00% 0.00% 0.00% 0.00% 0.00% 0.00% 0.00% 0.00%
Sequential Reduction 0.000% Alternate Coefficient of Variability 10.00% 0.00% 0.00% 0.00% 0.00% 0.00% 0.00% 0.00% 0.00% 0.00% 0.00% 0.00%
Timet0 Timet+1 Timet+2 Timet+3 Timet+4 Timet+5 Timet+6 Timet+7 Timet+8 Timet+9 Timet+10 Timet+11
Projection TimeT1
26,042 MONTE CARLO REVENUE 26,042 26,042 26,042 26,042 26,042 26,042 26,042 26,042 26,042 26,042 26,042
CoGS : f(Revenue)2022 CoGS : f(Revenue)2023 CoGS : f(Revenue)2024 CoGS : f(Revenue)2025 CoGS : f(Revenue)2026 CoGS : f(Revenue)2027 CoGS : f(Revenue)2028 CoGS : f(Revenue)2029 CoGS : f(Revenue)2030 CoGS : f(Revenue)2031 CoGS : f(Revenue)2032
63.266% 6.327% 57.659% 82.042% 69.062% 69.958% 61.162% 56.368% 58.168% 65.497% 76.855% 71.271% 65.274%
CoGS: 66.67% ‐15,016 ‐21,365 ‐17,985 ‐18,218 ‐15,928 ‐14,679 ‐15,148 ‐17,057 ‐20,015 ‐18,560 ‐16,999
Depreciation/Amortization [COGs] : f(Revenue)2022 Depreciation/Amortization [COGs] : f(Revenue)2023 Depreciation/Amortization [COGs] : f(Revenue)2024 Depreciation/Amortization [COGs] : f(Revenue)2025 Depreciation/Amortization [COGs] : f(Revenue)2026 Depreciation/Amortization [COGs] : f(Revenue)2027 Depreciation/Amortization [COGs] : f(Revenue)2028 Depreciation/Amortization [COGs] : f(Revenue)2029 Depreciation/Amortization [COGs] : f(Revenue)2030 Depreciation/Amortization [COGs] : f(Revenue)2031 Depreciation/Amortization [COGs] : f(Revenue)2032
9.221% 0.922% 8.514% 8.327% 8.148% 9.338% 10.132% 7.242% 9.358% 8.550% 8.333% 8.377% 7.946%
D&A (Production): 8.57% ‐2,217 ‐2,169 ‐2,122 ‐2,432 ‐2,638 ‐1,886 ‐2,437 ‐2,227 ‐2,170 ‐2,182 ‐2,069
GROSS MARGIN: 24.77% 8,809 2,508 5,935 5,392 7,476 9,477 8,457 6,759 3,857 5,300 6,974
SGA (Only) : f(Revenue)2022 SGA (Only) : f(Revenue)2023 SGA (Only) : f(Revenue)2024 SGA (Only) : f(Revenue)2025 SGA (Only) : f(Revenue)2026 SGA (Only) : f(Revenue)2027 SGA (Only) : f(Revenue)2028 SGA (Only) : f(Revenue)2029 SGA (Only) : f(Revenue)2030 SGA (Only) : f(Revenue)2031 SGA (Only) : f(Revenue)2032
16.383% 1.638% Administrative Costs: 15.383% 17.603% 17.565% 17.104% 14.669% 18.280% 15.422% 17.115% 15.456% 19.778% 20.878%
SGA: 15.38% ‐4,006 ‐4,006 ‐4,006 ‐4,006 ‐4,006 ‐4,006 ‐4,006 ‐4,006 ‐4,006 ‐4,006 ‐4,006
R&D : f(Revenue)2022 R&D : f(Revenue)2023 R&D : f(Revenue)2024 R&D : f(Revenue)2025 R&D : f(Revenue)2026 R&D : f(Revenue)2027 R&D : f(Revenue)2028 R&D : f(Revenue)2029 R&D : f(Revenue)2030 R&D : f(Revenue)2031 R&D : f(Revenue)2032
0.000% 0.000% 0.000% 0.000% 0.000% 0.000% 0.000% 0.000% 0.000% 0.000% 0.000% 0.000% 0.000%
R & D: 0.00% 0 0 0 0 0 0 0 0 0 0 0
Depreciation/Amortization [SGA] : f(Revenue)2022 Depreciation/Amortization [SGA] : f(Revenue)2023 Depreciation/Amortization [SGA] : f(Revenue)2024 Depreciation/Amortization [SGA] : f(Revenue)2025 Depreciation/Amortization [SGA] : f(Revenue)2026 Depreciation/Amortization [SGA] : f(Revenue)2027 Depreciation/Amortization [SGA] : f(Revenue)2028 Depreciation/Amortization [SGA] : f(Revenue)2029 Depreciation/Amortization [SGA] : f(Revenue)2030 Depreciation/Amortization [SGA] : f(Revenue)2031 Depreciation/Amortization [SGA] : f(Revenue)2032
6.179% 0.618% 5.652% 6.196% 5.709% 7.543% 6.117% 4.982% 7.076% 6.287% 5.619% 6.716% 5.989%
D & A [SGA]: 6.17% ‐1,472 ‐1,614 ‐1,487 ‐1,964 ‐1,593 ‐1,297 ‐1,843 ‐1,637 ‐1,463 ‐1,749 ‐1,560
Admin Expenses: 21.55% ‐5,478 ‐5,620 ‐5,493 ‐5,970 ‐5,599 ‐5,303 ‐5,849 ‐5,643 ‐5,469 ‐5,755 ‐5,566
Other Expense (Income) : f(Revenue)2022 Other Expense (Income) : f(Revenue)2023 Other Expense (Income) : f(Revenue)2024 Other Expense (Income) : f(Revenue)2025 Other Expense (Income) : f(Revenue)2026 Other Expense (Income) : f(Revenue)2027 Other Expense (Income) : f(Revenue)2028 Other Expense (Income) : f(Revenue)2029 Other Expense (Income) : f(Revenue)2030 Other Expense (Income) : f(Revenue)2031 Other Expense (Income) : f(Revenue)2032
-0.570% 0.057% ‐0.569% ‐0.509% ‐0.552% ‐0.446% ‐0.584% ‐0.627% ‐0.512% ‐0.549% ‐0.644% ‐0.621% ‐0.491%
Other: ‐0.56% 148 133 144 116 152 163 133 143 168 162 128
EBIT: 3.77% 3,480 ‐2,979 586 ‐462 2,029 4,337 2,741 1,259 ‐1,444 ‐293 1,536
Interest Expense (Income) : f(Revenue)2022 Interest Expense (Income) : f(Revenue)2023 Interest Expense (Income) : f(Revenue)2024 Interest Expense (Income) : f(Revenue)2025 Interest Expense (Income) : f(Revenue)2026 Interest Expense (Income) : f(Revenue)2027 Interest Expense (Income) : f(Revenue)2028 Interest Expense (Income) : f(Revenue)2029 Interest Expense (Income) : f(Revenue)2030 Interest Expense (Income) : f(Revenue)2031 Interest Expense (Income) : f(Revenue)2032
1.250% 0.125% 1.306% 1.235% 1.392% 1.061% 1.278% 1.297% 1.324% 1.056% 1.175% 1.300% 1.282%
Interest Expense: 1.25% ‐340 ‐322 ‐362 ‐276 ‐333 ‐338 ‐345 ‐275 ‐306 ‐339 ‐334
EBT: 2.52% 3,140 ‐3,300 224 ‐739 1,696 3,999 2,397 984 ‐1,750 ‐632 1,202
Tax Rate : f(EBT)2022 Tax Rate : f(EBT)2023 Tax Rate : f(EBT)2024 Tax Rate : f(EBT)2025 Tax Rate : f(EBT)2026 Tax Rate : f(EBT)2027 Tax Rate : f(EBT)2028 Tax Rate : f(EBT)2029 Tax Rate : f(EBT)2030 Tax Rate : f(EBT)2031 Tax Rate : f(EBT)2032
21.000% 2.100% 21.122% 21.517% 23.124% 20.811% 20.555% 21.725% 20.521% 19.475% 19.695% 19.466% 22.722%
Taxes: 15.49% ‐663 710 649 0 453 ‐427 ‐492 ‐192 345 602 133
Tax Payable Forward Credit Tax Payable Forward Credit Tax Payable Tax Payable Tax Payable Tax Payable Tax Payable Tax Payable Tax Payable
NET EARNINGS: 2.91% 2,476 ‐2,590 872 ‐739 2,149 3,572 1,905 792 ‐1,405 ‐30 1,336
D&A Add‐Back: 14.74% 3,689 3,782 3,608 4,396 4,231 3,183 4,280 3,864 3,633 3,931 3,629
Capital Expenditures : f(Revenue)2022 Capital Expenditures : f(Revenue)2023 Capital Expenditures : f(Revenue)2024 Capital Expenditures : f(Revenue)2025 Capital Expenditures : f(Revenue)2026 Capital Expenditures : f(Revenue)2027 Capital Expenditures : f(Revenue)2028 Capital Expenditures : f(Revenue)2029 Capital Expenditures : f(Revenue)2030 Capital Expenditures : f(Revenue)2031 Capital Expenditures : f(Revenue)2032
8.079% 0.808% 8.763% 8.229% 9.242% 7.401% 6.450% 8.274% 9.174% 7.532% 8.247% 7.881% 7.916%
CAP EX: 8.10% ‐2,282 ‐2,143 ‐2,407 ‐1,927 ‐1,680 ‐2,155 ‐2,389 ‐1,962 ‐2,148 ‐2,052 ‐2,061
Δ  Working Capital : f(Revenue)2022 Δ  Working Capital : f(Revenue)2023 Δ  Working Capital : f(Revenue)2024 Δ  Working Capital : f(Revenue)2025 Δ  Working Capital : f(Revenue)2026 Δ  Working Capital : f(Revenue)2027 Δ  Working Capital : f(Revenue)2028 Δ  Working Capital : f(Revenue)2029 Δ  Working Capital : f(Revenue)2030 Δ  Working Capital : f(Revenue)2031 Δ  Working Capital : f(Revenue)2032
0.000% 0.000% 0.000% 0.000% 0.000% 0.000% 0.000% 0.000% 0.000% 0.000% 0.000% 0.000% 0.000%
Δ WRK CAP: 0.00% 0 0 0 0 0 0 0 0 0 0 0
Equity Minority Interest : f(Revenue)2022 Equity Minority Interest : f(Revenue)2023 Equity Minority Interest : f(Revenue)2024 Equity Minority Interest : f(Revenue)2025 Equity Minority Interest : f(Revenue)2026 Equity Minority Interest : f(Revenue)2027 Equity Minority Interest : f(Revenue)2028 Equity Minority Interest : f(Revenue)2029 Equity Minority Interest : f(Revenue)2030 Equity Minority Interest : f(Revenue)2031 Equity Minority Interest : f(Revenue)2032
0.000% 0.000% 0.000% 0.000% 0.000% 0.000% 0.000% 0.000% 0.000% 0.000% 0.000% 0.000% 0.000%
EARN AFFL: 0.00% 0 0 0 0 0 0 0 0 0 0 0
‐45,227 LESS CURRENT DEBT AND OTHER LONG-TERM LIABILITIES T₀ (Adjusted for Carrying Costs )
0 LESS PREFERRED AT PAR T₀
3,445 EXCESS CASH & SHORT-TERM SECURITIES T₀ GROWTH 2.500%
DCF analysis will deduct the total value of liabilities from the firm's cash position. PERPETUITY VALUE
FCF to Equity 3,883 ‐951 2,074 1,730 4,701 4,600 3,796 2,694 80 1,849 2,903 113,171
WACC FOR SIMULATION
5.130% 0.103% To assess liquidity at T₀, DCF analysis will deduct Balance Sheet Liabilities from Cash + Short‐term securities.
5.070% DCF to the Investors 41,228 DCF analysis will deduct the total value of liabilities from the firm's cash position.
KHC: Kraft Heinz Co. | FEIN: 46-2078182: Monte Carlo: Valuation Per Share | $USD 33.587 PER SHARE
Beharry, Lyndon Martin W. 2022‐07‐22_KHC_MC‐Equity‐1Million|DCF All Variable_MC 07/22/2022 14:27 | Page 10D of 17
Equity Valuation 2022‐07‐22_KHC_MC‐Equity‐1Million Financial Statement Review
Type alternative annual growth rates here:
KHC: Kraft Heinz Co. | FEIN: 46‐2078182: Monte Carlo: Valuation Per Share |  $USD Mask Monetary Values In 1,000,000 $USD (Except Per Share Values).
1,000,000 $USD Revenue Growth Rate2022 Revenue Growth Rate2023 Revenue Growth Rate2024 Revenue Growth Rate2025 Revenue Growth Rate2026 Revenue Growth Rate2027 Revenue Growth Rate2028 Revenue Growth Rate2029 Revenue Growth Rate2030 Revenue Growth Rate2031 Revenue Growth Rate2032
Projection Base [FY] Year T0  2021 2021 2022 2023 2024 2025 2026 2027 2028 2029 2030 2031 2032
Mean STDEV 0 1 2 3 4 5 6 7 8 9 10
Revenue Growth Rate 2022 00.0% Revenue Growth Rate 2023 00.0% Revenue Growth Rate 2024 00.0% Revenue Growth Rate 2025 00.0% Revenue Growth Rate 2026 00.0% Revenue Growth Rate 2027 00.0% Revenue Growth Rate 2028 00.0% Revenue Growth Rate 2029 00.0% Revenue Growth Rate 2030 00.0% Revenue Growth Rate 2031 00.0% Revenue Growth Rate 2032 00.0%
0.000% 0.000% Random Growth Rate 0.00% 0.00% 0.00% 0.00% 0.00% 0.00% 0.00% 0.00% 0.00% 0.00% 0.00%
Sequential Reduction 0.000% Alternate Coefficient of Variability 10.00% 0.00% 0.00% 0.00% 0.00% 0.00% 0.00% 0.00% 0.00% 0.00% 0.00% 0.00%
Timet0 Timet+1 Timet+2 Timet+3 Timet+4 Timet+5 Timet+6 Timet+7 Timet+8 Timet+9 Timet+10 Timet+11
Projection TimeT1
26,042 MONTE CARLO REVENUE 26,042 26,042 26,042 26,042 26,042 26,042 26,042 26,042 26,042 26,042 26,042
CoGS : f(Revenue)2022 CoGS : f(Revenue)2023 CoGS : f(Revenue)2024 CoGS : f(Revenue)2025 CoGS : f(Revenue)2026 CoGS : f(Revenue)2027 CoGS : f(Revenue)2028 CoGS : f(Revenue)2029 CoGS : f(Revenue)2030 CoGS : f(Revenue)2031 CoGS : f(Revenue)2032
63.266% 6.327% 59.100% 63.084% 66.711% 63.948% 55.796% 65.027% 52.289% 57.695% 56.189% 54.535% 73.020%
CoGS: 60.67% ‐15,391 ‐16,428 ‐17,373 ‐16,653 ‐14,530 ‐16,934 ‐13,617 ‐15,025 ‐14,633 ‐14,202 ‐19,016
Depreciation/Amortization [COGs] : f(Revenue)2022 Depreciation/Amortization [COGs] : f(Revenue)2023 Depreciation/Amortization [COGs] : f(Revenue)2024 Depreciation/Amortization [COGs] : f(Revenue)2025 Depreciation/Amortization [COGs] : f(Revenue)2026 Depreciation/Amortization [COGs] : f(Revenue)2027 Depreciation/Amortization [COGs] : f(Revenue)2028 Depreciation/Amortization [COGs] : f(Revenue)2029 Depreciation/Amortization [COGs] : f(Revenue)2030 Depreciation/Amortization [COGs] : f(Revenue)2031 Depreciation/Amortization [COGs] : f(Revenue)2032
9.221% 0.922% 9.383% 10.467% 9.795% 9.701% 10.215% 8.636% 10.530% 8.255% 7.498% 8.692% 8.833%
D&A (Production): 9.27% ‐2,443 ‐2,726 ‐2,551 ‐2,526 ‐2,660 ‐2,249 ‐2,742 ‐2,150 ‐1,953 ‐2,264 ‐2,300
GROSS MARGIN: 30.05% 8,208 6,888 6,118 6,862 8,851 6,859 9,683 8,867 9,457 9,577 4,726
SGA (Only) : f(Revenue)2022 SGA (Only) : f(Revenue)2023 SGA (Only) : f(Revenue)2024 SGA (Only) : f(Revenue)2025 SGA (Only) : f(Revenue)2026 SGA (Only) : f(Revenue)2027 SGA (Only) : f(Revenue)2028 SGA (Only) : f(Revenue)2029 SGA (Only) : f(Revenue)2030 SGA (Only) : f(Revenue)2031 SGA (Only) : f(Revenue)2032
16.383% 1.638% Administrative Costs: 15.228% 20.412% 14.219% 17.003% 16.445% 15.741% 15.934% 15.309% 14.578% 17.488% 18.738%
SGA: 15.23% ‐3,966 ‐3,966 ‐3,966 ‐3,966 ‐3,966 ‐3,966 ‐3,966 ‐3,966 ‐3,966 ‐3,966 ‐3,966
R&D : f(Revenue)2022 R&D : f(Revenue)2023 R&D : f(Revenue)2024 R&D : f(Revenue)2025 R&D : f(Revenue)2026 R&D : f(Revenue)2027 R&D : f(Revenue)2028 R&D : f(Revenue)2029 R&D : f(Revenue)2030 R&D : f(Revenue)2031 R&D : f(Revenue)2032
0.000% 0.000% 0.000% 0.000% 0.000% 0.000% 0.000% 0.000% 0.000% 0.000% 0.000% 0.000% 0.000%
R & D: 0.00% 0 0 0 0 0 0 0 0 0 0 0
Depreciation/Amortization [SGA] : f(Revenue)2022 Depreciation/Amortization [SGA] : f(Revenue)2023 Depreciation/Amortization [SGA] : f(Revenue)2024 Depreciation/Amortization [SGA] : f(Revenue)2025 Depreciation/Amortization [SGA] : f(Revenue)2026 Depreciation/Amortization [SGA] : f(Revenue)2027 Depreciation/Amortization [SGA] : f(Revenue)2028 Depreciation/Amortization [SGA] : f(Revenue)2029 Depreciation/Amortization [SGA] : f(Revenue)2030 Depreciation/Amortization [SGA] : f(Revenue)2031 Depreciation/Amortization [SGA] : f(Revenue)2032
6.179% 0.618% 6.307% 6.052% 5.540% 5.314% 6.252% 5.536% 5.398% 5.582% 7.281% 6.801% 6.728%
D & A [SGA]: 6.07% ‐1,642 ‐1,576 ‐1,443 ‐1,384 ‐1,628 ‐1,442 ‐1,406 ‐1,454 ‐1,896 ‐1,771 ‐1,752
Admin Expenses: 21.30% ‐5,608 ‐5,542 ‐5,408 ‐5,349 ‐5,594 ‐5,407 ‐5,371 ‐5,419 ‐5,862 ‐5,737 ‐5,718
Other Expense (Income) : f(Revenue)2022 Other Expense (Income) : f(Revenue)2023 Other Expense (Income) : f(Revenue)2024 Other Expense (Income) : f(Revenue)2025 Other Expense (Income) : f(Revenue)2026 Other Expense (Income) : f(Revenue)2027 Other Expense (Income) : f(Revenue)2028 Other Expense (Income) : f(Revenue)2029 Other Expense (Income) : f(Revenue)2030 Other Expense (Income) : f(Revenue)2031 Other Expense (Income) : f(Revenue)2032
-0.570% 0.057% ‐0.614% ‐0.564% ‐0.470% ‐0.512% ‐0.588% ‐0.612% ‐0.594% ‐0.557% ‐0.631% ‐0.553% ‐0.570%
Other: ‐0.57% 160 147 122 133 153 159 155 145 164 144 148
EBIT: 9.32% 2,760 1,493 832 1,646 3,411 1,611 4,466 3,593 3,759 3,984 ‐844
Interest Expense (Income) : f(Revenue)2022 Interest Expense (Income) : f(Revenue)2023 Interest Expense (Income) : f(Revenue)2024 Interest Expense (Income) : f(Revenue)2025 Interest Expense (Income) : f(Revenue)2026 Interest Expense (Income) : f(Revenue)2027 Interest Expense (Income) : f(Revenue)2028 Interest Expense (Income) : f(Revenue)2029 Interest Expense (Income) : f(Revenue)2030 Interest Expense (Income) : f(Revenue)2031 Interest Expense (Income) : f(Revenue)2032
1.250% 0.125% 1.314% 1.201% 1.323% 1.489% 1.183% 1.132% 1.301% 1.404% 1.295% 1.310% 1.276%
Interest Expense: 1.29% ‐342 ‐313 ‐344 ‐388 ‐308 ‐295 ‐339 ‐366 ‐337 ‐341 ‐332
EBT: 8.03% 2,418 1,180 488 1,259 3,103 1,316 4,127 3,228 3,422 3,643 ‐1,176
Tax Rate : f(EBT)2022 Tax Rate : f(EBT)2023 Tax Rate : f(EBT)2024 Tax Rate : f(EBT)2025 Tax Rate : f(EBT)2026 Tax Rate : f(EBT)2027 Tax Rate : f(EBT)2028 Tax Rate : f(EBT)2029 Tax Rate : f(EBT)2030 Tax Rate : f(EBT)2031 Tax Rate : f(EBT)2032
21.000% 2.100% 21.320% 21.794% 21.589% 23.261% 23.400% 21.828% 18.027% 21.094% 23.358% 23.680% 21.770%
Taxes: 21.80% ‐515 ‐257 ‐105 ‐293 ‐726 ‐287 ‐744 ‐681 ‐799 ‐863 256
Tax Payable Tax Payable Tax Payable Tax Payable Tax Payable Tax Payable Tax Payable Tax Payable Tax Payable Tax Payable Tax Payable
NET EARNINGS: 6.28% 1,902 923 383 966 2,377 1,029 3,383 2,547 2,623 2,780 ‐920
D&A Add‐Back: 15.35% 4,086 4,302 3,993 3,910 4,288 3,691 4,148 3,603 3,849 4,035 4,052
Capital Expenditures : f(Revenue)2022 Capital Expenditures : f(Revenue)2023 Capital Expenditures : f(Revenue)2024 Capital Expenditures : f(Revenue)2025 Capital Expenditures : f(Revenue)2026 Capital Expenditures : f(Revenue)2027 Capital Expenditures : f(Revenue)2028 Capital Expenditures : f(Revenue)2029 Capital Expenditures : f(Revenue)2030 Capital Expenditures : f(Revenue)2031 Capital Expenditures : f(Revenue)2032
8.079% 0.808% 7.698% 9.431% 7.515% 5.597% 7.706% 9.347% 7.971% 7.163% 8.481% 7.744% 8.117%
CAP EX: 7.89% ‐2,005 ‐2,456 ‐1,957 ‐1,458 ‐2,007 ‐2,434 ‐2,076 ‐1,865 ‐2,209 ‐2,017 ‐2,114
Δ  Working Capital : f(Revenue)2022 Δ  Working Capital : f(Revenue)2023 Δ  Working Capital : f(Revenue)2024 Δ  Working Capital : f(Revenue)2025 Δ  Working Capital : f(Revenue)2026 Δ  Working Capital : f(Revenue)2027 Δ  Working Capital : f(Revenue)2028 Δ  Working Capital : f(Revenue)2029 Δ  Working Capital : f(Revenue)2030 Δ  Working Capital : f(Revenue)2031 Δ  Working Capital : f(Revenue)2032
0.000% 0.000% 0.000% 0.000% 0.000% 0.000% 0.000% 0.000% 0.000% 0.000% 0.000% 0.000% 0.000%
Δ WRK CAP: 0.00% 0 0 0 0 0 0 0 0 0 0 0
Equity Minority Interest : f(Revenue)2022 Equity Minority Interest : f(Revenue)2023 Equity Minority Interest : f(Revenue)2024 Equity Minority Interest : f(Revenue)2025 Equity Minority Interest : f(Revenue)2026 Equity Minority Interest : f(Revenue)2027 Equity Minority Interest : f(Revenue)2028 Equity Minority Interest : f(Revenue)2029 Equity Minority Interest : f(Revenue)2030 Equity Minority Interest : f(Revenue)2031 Equity Minority Interest : f(Revenue)2032
0.000% 0.000% 0.000% 0.000% 0.000% 0.000% 0.000% 0.000% 0.000% 0.000% 0.000% 0.000% 0.000%
EARN AFFL: 0.00% 0 0 0 0 0 0 0 0 0 0 0
‐45,227 LESS CURRENT DEBT AND OTHER LONG-TERM LIABILITIES T₀ (Adjusted for Carrying Costs )
0 LESS PREFERRED AT PAR T₀
3,445 EXCESS CASH & SHORT-TERM SECURITIES T₀ GROWTH 2.500%
DCF analysis will deduct the total value of liabilities from the firm's cash position. PERPETUITY VALUE
FCF to Equity 3,983 2,769 2,419 3,418 4,659 2,285 5,456 4,285 4,263 4,798 1,019 39,704
WACC FOR SIMULATION
5.130% 0.103% To assess liquidity at T₀, DCF analysis will deduct Balance Sheet Liabilities from Cash + Short‐term securities.
5.069% DCF to the Investors 9,674 DCF analysis will deduct the total value of liabilities from the firm's cash position.
KHC: Kraft Heinz Co. | FEIN: 46-2078182: Monte Carlo: Valuation Per Share | $USD 7.881 PER SHARE
Beharry, Lyndon Martin W. 2022‐07‐22_KHC_MC‐Equity‐1Million|DCF All Variable_MC 07/22/2022 14:27 | Page 10E of 17
Equity Valuation 2022‐07‐22_KHC_MC‐Equity‐1Million Financial Statement Review
Type alternative annual growth rates here:
KHC: Kraft Heinz Co. | FEIN: 46‐2078182: Monte Carlo: Valuation Per Share |  $USD Mask Monetary Values In 1,000,000 $USD (Except Per Share Values).
1,000,000 $USD Revenue Growth Rate2022 Revenue Growth Rate2023 Revenue Growth Rate2024 Revenue Growth Rate2025 Revenue Growth Rate2026 Revenue Growth Rate2027 Revenue Growth Rate2028 Revenue Growth Rate2029 Revenue Growth Rate2030 Revenue Growth Rate2031 Revenue Growth Rate2032
Projection Base [FY] Year T0  2021 2021 2022 2023 2024 2025 2026 2027 2028 2029 2030 2031 2032
Mean STDEV 0 1 2 3 4 5 6 7 8 9 10
Revenue Growth Rate 2022 00.0% Revenue Growth Rate 2023 00.0% Revenue Growth Rate 2024 00.0% Revenue Growth Rate 2025 00.0% Revenue Growth Rate 2026 00.0% Revenue Growth Rate 2027 00.0% Revenue Growth Rate 2028 00.0% Revenue Growth Rate 2029 00.0% Revenue Growth Rate 2030 00.0% Revenue Growth Rate 2031 00.0% Revenue Growth Rate 2032 00.0%
0.000% 0.000% Random Growth Rate 0.00% 0.00% 0.00% 0.00% 0.00% 0.00% 0.00% 0.00% 0.00% 0.00% 0.00%
Sequential Reduction 0.000% Alternate Coefficient of Variability 10.00% 0.00% 0.00% 0.00% 0.00% 0.00% 0.00% 0.00% 0.00% 0.00% 0.00% 0.00%
Timet0 Timet+1 Timet+2 Timet+3 Timet+4 Timet+5 Timet+6 Timet+7 Timet+8 Timet+9 Timet+10 Timet+11
Projection TimeT1
26,042 MONTE CARLO REVENUE 26,042 26,042 26,042 26,042 26,042 26,042 26,042 26,042 26,042 26,042 26,042
CoGS : f(Revenue)2022 CoGS : f(Revenue)2023 CoGS : f(Revenue)2024 CoGS : f(Revenue)2025 CoGS : f(Revenue)2026 CoGS : f(Revenue)2027 CoGS : f(Revenue)2028 CoGS : f(Revenue)2029 CoGS : f(Revenue)2030 CoGS : f(Revenue)2031 CoGS : f(Revenue)2032
63.266% 6.327% 52.242% 70.054% 68.734% 54.907% 71.351% 51.717% 67.694% 67.896% 72.049% 64.562% 56.633%
CoGS: 63.44% ‐13,605 ‐18,243 ‐17,900 ‐14,299 ‐18,581 ‐13,468 ‐17,629 ‐17,681 ‐18,763 ‐16,813 ‐14,748
Depreciation/Amortization [COGs] : f(Revenue)2022 Depreciation/Amortization [COGs] : f(Revenue)2023 Depreciation/Amortization [COGs] : f(Revenue)2024 Depreciation/Amortization [COGs] : f(Revenue)2025 Depreciation/Amortization [COGs] : f(Revenue)2026 Depreciation/Amortization [COGs] : f(Revenue)2027 Depreciation/Amortization [COGs] : f(Revenue)2028 Depreciation/Amortization [COGs] : f(Revenue)2029 Depreciation/Amortization [COGs] : f(Revenue)2030 Depreciation/Amortization [COGs] : f(Revenue)2031 Depreciation/Amortization [COGs] : f(Revenue)2032
9.221% 0.922% 9.064% 7.913% 9.236% 9.863% 10.311% 9.014% 7.308% 6.860% 8.992% 10.622% 8.122%
D&A (Production): 8.85% ‐2,360 ‐2,061 ‐2,405 ‐2,569 ‐2,685 ‐2,347 ‐1,903 ‐1,787 ‐2,342 ‐2,766 ‐2,115
GROSS MARGIN: 27.71% 10,077 5,738 5,737 9,174 4,775 10,226 6,510 6,574 4,937 6,463 9,179
SGA (Only) : f(Revenue)2022 SGA (Only) : f(Revenue)2023 SGA (Only) : f(Revenue)2024 SGA (Only) : f(Revenue)2025 SGA (Only) : f(Revenue)2026 SGA (Only) : f(Revenue)2027 SGA (Only) : f(Revenue)2028 SGA (Only) : f(Revenue)2029 SGA (Only) : f(Revenue)2030 SGA (Only) : f(Revenue)2031 SGA (Only) : f(Revenue)2032
16.383% 1.638% Administrative Costs: 16.569% 16.966% 19.665% 16.265% 16.581% 16.292% 18.066% 17.002% 16.569% 17.768% 14.172%
SGA: 16.57% ‐4,315 ‐4,315 ‐4,315 ‐4,315 ‐4,315 ‐4,315 ‐4,315 ‐4,315 ‐4,315 ‐4,315 ‐4,315
R&D : f(Revenue)2022 R&D : f(Revenue)2023 R&D : f(Revenue)2024 R&D : f(Revenue)2025 R&D : f(Revenue)2026 R&D : f(Revenue)2027 R&D : f(Revenue)2028 R&D : f(Revenue)2029 R&D : f(Revenue)2030 R&D : f(Revenue)2031 R&D : f(Revenue)2032
0.000% 0.000% 0.000% 0.000% 0.000% 0.000% 0.000% 0.000% 0.000% 0.000% 0.000% 0.000% 0.000%
R & D: 0.00% 0 0 0 0 0 0 0 0 0 0 0
Depreciation/Amortization [SGA] : f(Revenue)2022 Depreciation/Amortization [SGA] : f(Revenue)2023 Depreciation/Amortization [SGA] : f(Revenue)2024 Depreciation/Amortization [SGA] : f(Revenue)2025 Depreciation/Amortization [SGA] : f(Revenue)2026 Depreciation/Amortization [SGA] : f(Revenue)2027 Depreciation/Amortization [SGA] : f(Revenue)2028 Depreciation/Amortization [SGA] : f(Revenue)2029 Depreciation/Amortization [SGA] : f(Revenue)2030 Depreciation/Amortization [SGA] : f(Revenue)2031 Depreciation/Amortization [SGA] : f(Revenue)2032
6.179% 0.618% 6.594% 7.010% 6.222% 6.288% 7.303% 5.454% 5.647% 6.726% 5.797% 5.984% 6.175%
D & A [SGA]: 6.29% ‐1,717 ‐1,826 ‐1,620 ‐1,637 ‐1,902 ‐1,420 ‐1,471 ‐1,752 ‐1,510 ‐1,558 ‐1,608
Admin Expenses: 22.86% ‐6,032 ‐6,141 ‐5,935 ‐5,953 ‐6,217 ‐5,735 ‐5,786 ‐6,067 ‐5,825 ‐5,873 ‐5,923
Other Expense (Income) : f(Revenue)2022 Other Expense (Income) : f(Revenue)2023 Other Expense (Income) : f(Revenue)2024 Other Expense (Income) : f(Revenue)2025 Other Expense (Income) : f(Revenue)2026 Other Expense (Income) : f(Revenue)2027 Other Expense (Income) : f(Revenue)2028 Other Expense (Income) : f(Revenue)2029 Other Expense (Income) : f(Revenue)2030 Other Expense (Income) : f(Revenue)2031 Other Expense (Income) : f(Revenue)2032
-0.570% 0.057% ‐0.667% ‐0.525% ‐0.549% ‐0.571% ‐0.585% ‐0.594% ‐0.528% ‐0.534% ‐0.730% ‐0.565% ‐0.531%
Other: ‐0.58% 174 137 143 149 152 155 137 139 190 147 138
EBIT: 5.43% 4,218 ‐266 ‐55 3,371 ‐1,289 4,646 862 646 ‐697 736 3,394
Interest Expense (Income) : f(Revenue)2022 Interest Expense (Income) : f(Revenue)2023 Interest Expense (Income) : f(Revenue)2024 Interest Expense (Income) : f(Revenue)2025 Interest Expense (Income) : f(Revenue)2026 Interest Expense (Income) : f(Revenue)2027 Interest Expense (Income) : f(Revenue)2028 Interest Expense (Income) : f(Revenue)2029 Interest Expense (Income) : f(Revenue)2030 Interest Expense (Income) : f(Revenue)2031 Interest Expense (Income) : f(Revenue)2032
1.250% 0.125% 1.052% 1.295% 1.004% 1.268% 1.383% 1.338% 1.321% 1.183% 1.163% 1.238% 1.316%
Interest Expense: 1.23% ‐274 ‐337 ‐262 ‐330 ‐360 ‐348 ‐344 ‐308 ‐303 ‐322 ‐343
EBT: 4.20% 3,944 ‐603 ‐317 3,040 ‐1,649 4,297 518 338 ‐1,000 414 3,051
Tax Rate : f(EBT)2022 Tax Rate : f(EBT)2023 Tax Rate : f(EBT)2024 Tax Rate : f(EBT)2025 Tax Rate : f(EBT)2026 Tax Rate : f(EBT)2027 Tax Rate : f(EBT)2028 Tax Rate : f(EBT)2029 Tax Rate : f(EBT)2030 Tax Rate : f(EBT)2031 Tax Rate : f(EBT)2032
21.000% 2.100% 17.293% 22.508% 22.327% 17.475% 21.303% 17.948% 21.928% 17.796% 19.187% 20.474% 22.277%
Taxes: 15.23% ‐682 136 7 ‐378 351 ‐504 ‐114 ‐60 192 ‐102 ‐680
Tax Payable Tax Payable Tax Payable Tax Payable Tax Payable Tax Payable Tax Payable Tax Payable Tax Payable Tax Payable Tax Payable
NET EARNINGS: 3.56% 3,262 ‐467 ‐310 2,663 ‐1,298 3,793 404 278 ‐808 313 2,371
D&A Add‐Back: 15.14% 4,078 3,886 4,025 4,206 4,587 3,768 3,374 3,538 3,851 4,325 3,723
Capital Expenditures : f(Revenue)2022 Capital Expenditures : f(Revenue)2023 Capital Expenditures : f(Revenue)2024 Capital Expenditures : f(Revenue)2025 Capital Expenditures : f(Revenue)2026 Capital Expenditures : f(Revenue)2027 Capital Expenditures : f(Revenue)2028 Capital Expenditures : f(Revenue)2029 Capital Expenditures : f(Revenue)2030 Capital Expenditures : f(Revenue)2031 Capital Expenditures : f(Revenue)2032
8.079% 0.808% 7.639% 6.214% 9.714% 8.299% 8.828% 8.283% 8.912% 8.171% 7.816% 8.186% 9.188%
CAP EX: 8.30% ‐1,989 ‐1,618 ‐2,530 ‐2,161 ‐2,299 ‐2,157 ‐2,321 ‐2,128 ‐2,035 ‐2,132 ‐2,393
Δ  Working Capital : f(Revenue)2022 Δ  Working Capital : f(Revenue)2023 Δ  Working Capital : f(Revenue)2024 Δ  Working Capital : f(Revenue)2025 Δ  Working Capital : f(Revenue)2026 Δ  Working Capital : f(Revenue)2027 Δ  Working Capital : f(Revenue)2028 Δ  Working Capital : f(Revenue)2029 Δ  Working Capital : f(Revenue)2030 Δ  Working Capital : f(Revenue)2031 Δ  Working Capital : f(Revenue)2032
0.000% 0.000% 0.000% 0.000% 0.000% 0.000% 0.000% 0.000% 0.000% 0.000% 0.000% 0.000% 0.000%
Δ WRK CAP: 0.00% 0 0 0 0 0 0 0 0 0 0 0
Equity Minority Interest : f(Revenue)2022 Equity Minority Interest : f(Revenue)2023 Equity Minority Interest : f(Revenue)2024 Equity Minority Interest : f(Revenue)2025 Equity Minority Interest : f(Revenue)2026 Equity Minority Interest : f(Revenue)2027 Equity Minority Interest : f(Revenue)2028 Equity Minority Interest : f(Revenue)2029 Equity Minority Interest : f(Revenue)2030 Equity Minority Interest : f(Revenue)2031 Equity Minority Interest : f(Revenue)2032
0.000% 0.000% 0.000% 0.000% 0.000% 0.000% 0.000% 0.000% 0.000% 0.000% 0.000% 0.000% 0.000%
EARN AFFL: 0.00% 0 0 0 0 0 0 0 0 0 0 0
‐45,227 LESS CURRENT DEBT AND OTHER LONG-TERM LIABILITIES T₀ (Adjusted for Carrying Costs )
0 LESS PREFERRED AT PAR T₀
3,445 EXCESS CASH & SHORT-TERM SECURITIES T₀ GROWTH 2.500%
DCF analysis will deduct the total value of liabilities from the firm's cash position. PERPETUITY VALUE
FCF to Equity 5,350 1,801 1,186 4,708 990 5,404 1,457 1,688 1,008 2,505 3,702 144,288
WACC FOR SIMULATION
5.130% 0.103% To assess liquidity at T₀, DCF analysis will deduct Balance Sheet Liabilities from Cash + Short‐term securities.
5.087% DCF to the Investors 60,635 DCF analysis will deduct the total value of liabilities from the firm's cash position.
KHC: Kraft Heinz Co. | FEIN: 46-2078182: Monte Carlo: Valuation Per Share | $USD 49.397 PER SHARE
Beharry, Lyndon Martin W. 2022‐07‐22_KHC_MC‐Equity‐1Million|DCF All Variable_MC 07/22/2022 14:28 | Page 10F of 17
2022-07-22_KHC_MC-Equity-1Million_July-Trials.pdf

More Related Content

More from Lyndon Martin W. Beharry

2022-07-18_DVN_MC-Equity-1Million_July-Trials.pdf
2022-07-18_DVN_MC-Equity-1Million_July-Trials.pdf2022-07-18_DVN_MC-Equity-1Million_July-Trials.pdf
2022-07-18_DVN_MC-Equity-1Million_July-Trials.pdfLyndon Martin W. Beharry
 
2022-07-16_MMM_MC-Equity-1Million_July-Trials.pdf
2022-07-16_MMM_MC-Equity-1Million_July-Trials.pdf2022-07-16_MMM_MC-Equity-1Million_July-Trials.pdf
2022-07-16_MMM_MC-Equity-1Million_July-Trials.pdfLyndon Martin W. Beharry
 
2022-07-15_LMT_MC-Equity_July-2022-Trials.pdf
2022-07-15_LMT_MC-Equity_July-2022-Trials.pdf2022-07-15_LMT_MC-Equity_July-2022-Trials.pdf
2022-07-15_LMT_MC-Equity_July-2022-Trials.pdfLyndon Martin W. Beharry
 
2022-07-13_AAPL-MC-Equity_July-2022-Trials.pdf
2022-07-13_AAPL-MC-Equity_July-2022-Trials.pdf2022-07-13_AAPL-MC-Equity_July-2022-Trials.pdf
2022-07-13_AAPL-MC-Equity_July-2022-Trials.pdfLyndon Martin W. Beharry
 
2022-BeharryLyndonMartinW-CV-References.pdf
2022-BeharryLyndonMartinW-CV-References.pdf2022-BeharryLyndonMartinW-CV-References.pdf
2022-BeharryLyndonMartinW-CV-References.pdfLyndon Martin W. Beharry
 
2021 12-06 biib-mc-sample-valuation-reduced
2021 12-06 biib-mc-sample-valuation-reduced2021 12-06 biib-mc-sample-valuation-reduced
2021 12-06 biib-mc-sample-valuation-reducedLyndon Martin W. Beharry
 

More from Lyndon Martin W. Beharry (20)

2022-07-18_DVN_MC-Equity-1Million_July-Trials.pdf
2022-07-18_DVN_MC-Equity-1Million_July-Trials.pdf2022-07-18_DVN_MC-Equity-1Million_July-Trials.pdf
2022-07-18_DVN_MC-Equity-1Million_July-Trials.pdf
 
2022-07-16_MMM_MC-Equity-1Million_July-Trials.pdf
2022-07-16_MMM_MC-Equity-1Million_July-Trials.pdf2022-07-16_MMM_MC-Equity-1Million_July-Trials.pdf
2022-07-16_MMM_MC-Equity-1Million_July-Trials.pdf
 
2022-07-15_BIIB_MC-Equity-July-Trials.pdf
2022-07-15_BIIB_MC-Equity-July-Trials.pdf2022-07-15_BIIB_MC-Equity-July-Trials.pdf
2022-07-15_BIIB_MC-Equity-July-Trials.pdf
 
2022-07-15_LMT_MC-Equity_July-2022-Trials.pdf
2022-07-15_LMT_MC-Equity_July-2022-Trials.pdf2022-07-15_LMT_MC-Equity_July-2022-Trials.pdf
2022-07-15_LMT_MC-Equity_July-2022-Trials.pdf
 
2022-07-13_AAPL-MC-Equity_July-2022-Trials.pdf
2022-07-13_AAPL-MC-Equity_July-2022-Trials.pdf2022-07-13_AAPL-MC-Equity_July-2022-Trials.pdf
2022-07-13_AAPL-MC-Equity_July-2022-Trials.pdf
 
2022-BeharryLyndonMartinW-CV-References.pdf
2022-BeharryLyndonMartinW-CV-References.pdf2022-BeharryLyndonMartinW-CV-References.pdf
2022-BeharryLyndonMartinW-CV-References.pdf
 
2022-05-05_AAPL-MC-VLTN.pdf
2022-05-05_AAPL-MC-VLTN.pdf2022-05-05_AAPL-MC-VLTN.pdf
2022-05-05_AAPL-MC-VLTN.pdf
 
2022 01-28 lmt-mc-equity-wkbk-trial
2022 01-28 lmt-mc-equity-wkbk-trial2022 01-28 lmt-mc-equity-wkbk-trial
2022 01-28 lmt-mc-equity-wkbk-trial
 
2022 01-04 l-mw_b_exc-report
2022 01-04 l-mw_b_exc-report2022 01-04 l-mw_b_exc-report
2022 01-04 l-mw_b_exc-report
 
2022 01-03 l-mw_b_exc-report
2022 01-03 l-mw_b_exc-report2022 01-03 l-mw_b_exc-report
2022 01-03 l-mw_b_exc-report
 
2021 12-13 l-mw_b_exc-report
2021 12-13 l-mw_b_exc-report2021 12-13 l-mw_b_exc-report
2021 12-13 l-mw_b_exc-report
 
2021 12-06 biib-mc-sample-valuation-reduced
2021 12-06 biib-mc-sample-valuation-reduced2021 12-06 biib-mc-sample-valuation-reduced
2021 12-06 biib-mc-sample-valuation-reduced
 
2021 12-18 exc-mc-models
2021 12-18 exc-mc-models2021 12-18 exc-mc-models
2021 12-18 exc-mc-models
 
2017 12-07 apu-draft03-signed
2017 12-07 apu-draft03-signed2017 12-07 apu-draft03-signed
2017 12-07 apu-draft03-signed
 
2017 12-07 apu-draft02-signed
2017 12-07 apu-draft02-signed2017 12-07 apu-draft02-signed
2017 12-07 apu-draft02-signed
 
2017 11-28 apu-draft01-nov29-signed
2017 11-28 apu-draft01-nov29-signed2017 11-28 apu-draft01-nov29-signed
2017 11-28 apu-draft01-nov29-signed
 
2017 06-10_LMwB_SuuReport
2017 06-10_LMwB_SuuReport2017 06-10_LMwB_SuuReport
2017 06-10_LMwB_SuuReport
 
2015 09-13 mcs-apb-spent_grains
2015 09-13 mcs-apb-spent_grains2015 09-13 mcs-apb-spent_grains
2015 09-13 mcs-apb-spent_grains
 
2016 03-18 sample-graphics
2016 03-18 sample-graphics2016 03-18 sample-graphics
2016 03-18 sample-graphics
 
2016 03-18 mongol-forex
2016 03-18 mongol-forex2016 03-18 mongol-forex
2016 03-18 mongol-forex
 

2022-07-22_KHC_MC-Equity-1Million_July-Trials.pdf

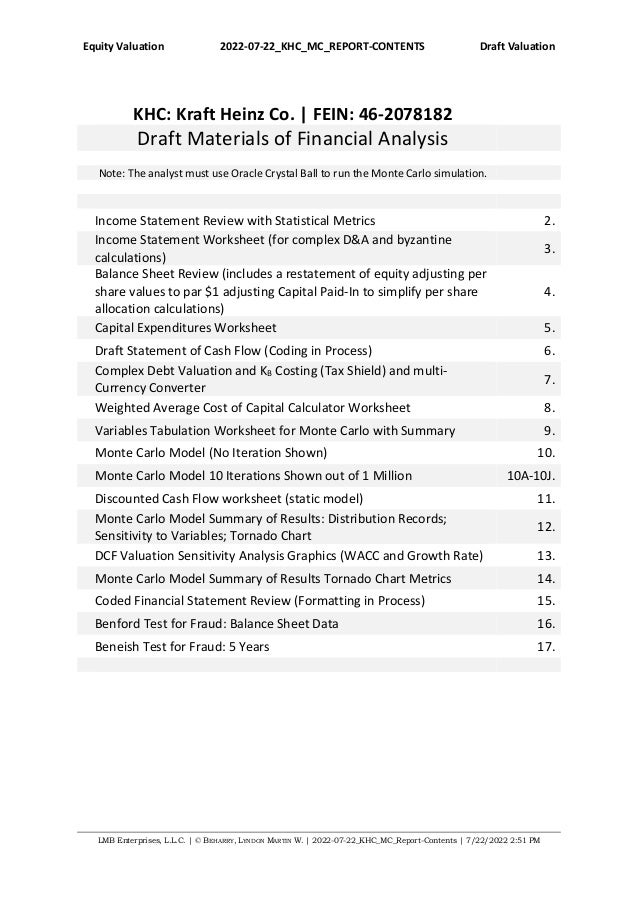
  • 1. Equity Valuation 2022-07-22_KHC_MC_REPORT-CONTENTS Draft Valuation LMB Enterprises, L.L.C. | © BEHARRY, LYNDON MARTIN W. | 2022-07-22_KHC_MC_Report-Contents | 7/22/2022 2:51 PM KHC: Kraft Heinz Co. | FEIN: 46-2078182 Draft Materials of Financial Analysis Note: The analyst must use Oracle Crystal Ball to run the Monte Carlo simulation. Income Statement Review with Statistical Metrics 2. Income Statement Worksheet (for complex D&A and byzantine calculations) 3. Balance Sheet Review (includes a restatement of equity adjusting per share values to par $1 adjusting Capital Paid-In to simplify per share allocation calculations) 4. Capital Expenditures Worksheet 5. Draft Statement of Cash Flow (Coding in Process) 6. Complex Debt Valuation and KB Costing (Tax Shield) and multi- Currency Converter 7. Weighted Average Cost of Capital Calculator Worksheet 8. Variables Tabulation Worksheet for Monte Carlo with Summary 9. Monte Carlo Model (No Iteration Shown) 10. Monte Carlo Model 10 Iterations Shown out of 1 Million 10A-10J. Discounted Cash Flow worksheet (static model) 11. Monte Carlo Model Summary of Results: Distribution Records; Sensitivity to Variables; Tornado Chart 12. DCF Valuation Sensitivity Analysis Graphics (WACC and Growth Rate) 13. Monte Carlo Model Summary of Results Tornado Chart Metrics 14. Coded Financial Statement Review (Formatting in Process) 15. Benford Test for Fraud: Balance Sheet Data 16. Beneish Test for Fraud: 5 Years 17.
  • 2. Equity Valuation 2022‐07‐22_KHC_MC‐Equity‐1Million Financial Statement Review KHC: Kraft Heinz Co. | FEIN: 46‐2078182 BalShtReview 1,000,000 $USD 2007 2008 2009 2010 2011 2012 2013 2014 2015 2016 2017 2018 2019 2020 2021 CURRENT ASSETS Cash 567 1,244 2,101 2 0 1,255 1,686 2,298 4,837 4,204 1,629 1,130 2,279 3,417 3,445 Trade Accounts Receivable 5,197 4,704 5,197 1,196 903 1,089 1,048 690 871 769 921 2,129 1,973 2,063 1,957 Short Term Factor Financing Receivable 161 583 129 353 Accounts Receivable 5,197 4,704 5,197 1,196 903 1,089 1,048 851 1,454 898 1,274 2,129 1,973 2,063 1,957 Inventories 4,096 3,881 3,775 1,773 1,943 1,928 1,616 1,185 2,618 2,684 2,815 2,667 2,721 2,773 2,729 Investments in Securities / Short‐term Securities Deferred Tax 575 804 730 171 232 420 360 260 582 152 173 Prepaid Expenses 400 384 132 136 Other Current Assets 302 828 651 165 194 131 198 581 871 707 966 1,221 445 574 716 Assets held for sale 1,376 122 1,863 11 TOTAL CURRENT ASSETS 10,737 11,461 12,454 3,307 3,272 4,823 4,908 4,915 9,780 8,753 7,266 9,075 8,097 10,822 8,994 NON-CURRENT ASSETS (i.e. LONG-TERM ASSETS) Property Plant and Equipment (Acquisition Basis) 19,204 17,815 19,423 7,957 8,169 8,402 7,822 2,796 7,430 8,518 9,214 9,662 10,242 10,439 10,674 Accumulated Depreciation 8,426 7,898 8,730 3,674 3,891 4,198 3,707 431 906 1,830 2,094 2,584 3,187 3,563 3,868 Property Plant and Equipment (Net of Depreciation) PPE (Net) 10,778 9,917 10,693 4,283 4,278 4,204 4,115 2,365 6,524 6,688 7,120 7,078 7,055 6,876 6,806 Goodwill 31,193 27,581 28,764 11,338 11,316 11,346 11,505 14,959 43,051 44,125 44,824 36,503 35,546 33,089 31,296 Intangible (Other Intangible) 12,200 12,926 13,429 2,630 2,630 2,631 2,229 13,188 62,120 59,297 59,449 49,468 48,652 46,667 43,542 TOTAL GOODWILL AND INTANGIBLE OTHER 43,393 40,507 42,193 13,968 13,946 13,977 13,734 28,147 105,171 103,422 104,273 85,971 84,198 79,756 74,838 Long‐term Marketable Securities Other non‐current (non‐specified) 1,437 1,232 1,259 23 43 325 391 1,144 1,498 1,617 1,573 1,337 2,100 2,376 2,756 PrePaid pension assets 1,648 56 115 17 TOTAL NON-CURRENT ASSETS 57,256 51,712 54,260 18,291 18,267 18,506 18,240 31,656 113,193 111,727 112,966 94,386 93,353 89,008 84,400 TOTAL ASSETS 67,993 63,173 66,714 21,598 21,539 23,329 23,148 36,571 122,973 120,480 120,232 103,461 101,450 99,830 93,394 CURRENT LIABILITIES Accounts Payable 4,065 3,373 3,766 1,285 1,447 1,556 1,548 1,651 2,844 3,996 4,449 4,153 4,003 4,304 4,753 Current Portion of Debt 8,107 1,662 966 8 8 5 4 2,691 3,203 398 1,028 236 754 Accrued Expenses 2,746 2,754 3,356 751 817 934 869 297 856 749 680 722 647 946 804 Accrued Taxes Payable 100 232 417 255 152 114 541 Interest Payable 167 401 415 419 408 384 358 268 Other Current Liabilities 1,654 3,255 3,403 322 300 579 479 730 1,324 1,238 1,178 1,767 1,804 2,086 1,944 Liabilities Held for Sale 55 9 17 Accrued postemployment costs 0 236 197 15 328 157 51 Due to Altria Group, Inc. and affiliates 0 Dividend Payable 414 296 313 762 TOTAL CURRENT LIABILITIES 17,086 11,044 11,491 2,366 2,572 3,606 3,410 3,092 6,932 9,501 10,132 7,503 7,875 8,061 9,064 LONG-TERM LIABILITIES Notes payable / Long‐term Debt 12,902 18,589 18,024 31 27 9,966 9,976 13,358 25,151 29,713 28,333 30,770 28,216 28,070 21,061 Long‐term Tax Liabilities 4,876 4,064 4,508 1,524 1,594 288 662 3,867 21,497 20,848 14,076 12,202 11,878 11,462 10,536 Accrued post‐Employment Costs 3,656 5,045 4,581 55 117 5,492 3,485 287 2,405 2,038 427 306 273 243 205 Long‐term Deferred Income 6 1,534 Other non‐current 2,178 2,075 2,138 583 641 405 428 282 752 806 1,017 902 1,459 1,745 1,542 TOTAL LONG-TERM LIABILITIES 23,612 29,773 29,251 2,193 2,379 16,151 14,551 17,794 49,805 53,405 43,853 44,180 41,826 41,526 34,878 TOTAL LIABILITIES 40,698 40,817 40,742 4,559 4,951 19,757 17,961 20,886 56,737 62,906 53,985 51,683 49,701 49,587 43,942 SHAREHOLDERS EQUITY Goal‐Seek Adjust Capital Paid‐In and Share count total to Par  $USD 1.00 Preferred Stock:A @ par  $USD 1.00 0 0 Preferred Stock:B @ par  $USD 1.00 Preferred Stock:C @ par  $USD 1.00 Preferred Stock:D @ par  $USD 1.00 Common Stock @ par  $USD 1.00 1,735 1,735 1,735 593 593 597 744 1,214 1,217 1,219 1,224 1,221 1,228 1,224 Treasury Stock @ par  $USD 1.00 2 2 4 3 5 11 Additional Capital Paid‐In 15,186 13,114 13,460 ‐593 3,645 3,808 15,287 65,462 57,179 57,278 57,225 55,345 53,531 51,569 Deferred Compensation Accumulated Comprehensive Income / (Loss) ‐1,835 ‐5,994 ‐3,955 ‐171 ‐499 ‐574 ‐671 ‐1,628 ‐1,054 ‐1,943 ‐1,886 ‐1,967 ‐1,824 Retained Earnings / Accumulated Other Comprehensive Income 12,209 13,440 14,636 ‐125 ‐460 1,281 0 0 588 8,589 ‐4,853 ‐3,060 ‐2,694 ‐1,682 Other Equity 17,210 16,713 0 NonControlling Interests 61 96 0 ‐206 228 231 216 213 121 126 140 154 TOTAL SHAREHOLDERS EQUITY 27,295 22,356 25,972 17,039 16,588 3,572 5,187 15,685 66,236 57,574 66,247 51,778 51,749 50,243 49,452 TOTAL LIABILITIES AND SE 67,993 63,173 66,714 21,598 21,539 23,329 23,148 36,571 122,973 120,480 120,232 103,461 101,450 99,830 93,394 Beharry, Lyndon Martin W. 2022‐07‐22_KHC_MC‐Equity‐1Million|BalShtReview 07/22/2022 15:04 | Page 4 of 17
  • 3. Equity Valuation 2022‐07‐22_KHC_MC‐Equity‐1Million Financial Statement Review KHC: Kraft Heinz Co. | FEIN: 46‐2078182 CAPEXCalc IRR; CAGR Aggregated 1,000,000 $USD 2007 2008 2009 2010 2011 2012 2013 2014 2015 2016 2017 2018 2019 2020 2021 1.285% Working Capital [Current Assets - Current Liabilities] ‐6,349 417 963 941 700 1,217 1,498 1,823 2,848 ‐748 ‐2,866 1,572 222 2,761 ‐70 PerCent of Revenue ‐17.706% 0.994% 2.384% 5.287% 3.752% 6.661% 8.223% 10.014% 15.531% ‐2.824% ‐10.991% 5.984% 0.889% 10.544% ‐0.269% -14.362%  Working Capital ‐6,766 ‐546 22 241 ‐517 ‐281 ‐325 ‐1,025 3,596 2,118 ‐4,438 1,350 ‐2,539 2,831 -1.174%  Working Capital %Rev ‐16.136% ‐1.352% 0.124% 1.292% ‐2.830% ‐1.542% ‐1.785% ‐5.589% 13.576% 8.122% ‐16.895% 5.405% ‐9.696% 10.871% 21.437% 6.370% CAPEX =  Total Assets -  Total Liabilities ‐4,939 3,616 ‐8,933 ‐451 ‐13,016 1,615 10,498 50,551 ‐8,662 8,673 ‐14,469 ‐29 ‐1,506 ‐791 10.863% CAPEX %Rev ‐11.779% 8.954% ‐50.194% ‐2.418% ‐71.239% 8.865% 57.665% 275.663% ‐32.703% 33.260% ‐55.082% ‐0.116% ‐5.751% ‐3.037% 29.566% 8.079% CAPEX = PPECurrent - PPELast + Depreciation 1,172 1,669 ‐6,064 357 495 412 ‐1,366 4,899 1,501 1,512 16,877 2,870 4,189 2,474 7.975% CAPEX %Rev 2.795% 4.133% ‐34.073% 1.914% 2.709% 2.261% ‐7.503% 26.715% 5.667% 5.798% 64.249% 11.491% 15.998% 9.500% 54.195% 44.592% CAPEX %FCFFirm 30.198% 42.566% ‐271.199% 16.706% 22.388% 12.811% ‐95.725% 353.208% 30.147% 12.587% 253.218% 59.470% 88.581% 69.339% [Agg CapEx]/[Agg Rev] 8.911% Net Operating Working Capital [Alt Calc] 2007 2008 2009 2010 2011 2012 2013 2014 2015 2016 2017 2018 2019 2020 2021 + Total Current Assets 10,737 11,461 12,454 3,307 3,272 4,823 4,908 4,915 9,780 8,753 7,266 9,075 8,097 10,822 8,994 ‐ Investments In Securities ‐ Factor Trade Financing  Receivable ‐161 ‐583 ‐129 ‐353 ‐ Current Liabilities ‐17,086 ‐11,044 ‐11,491 ‐2,366 ‐2,572 ‐3,606 ‐3,410 ‐3,092 ‐6,932 ‐9,501 ‐10,132 ‐7,503 ‐7,875 ‐8,061 ‐9,064 + Current Portion of Debt 8,107 1,662 966 8 8 5 4 2,691 3,203 398 1,028 236 754 5.935% Net Operating Working Capital 1,758 2,079 1,929 949 708 1,222 1,502 1,662 2,265 1,814 ‐16 1,970 1,250 2,997 684 PerCent of Revenue 4.903% 4.958% 4.776% 5.332% 3.795% 6.688% 8.245% 9.129% 12.351% 6.849% ‐0.061% 7.500% 5.005% 11.445% 2.627%  Working Capital ‐321 150 980 241 ‐514 ‐280 ‐160 ‐603 451 1,830 ‐1,986 720 ‐1,747 2,313 0.280% 0.296%  Working Capital %Rev ‐0.766% 0.371% 5.507% 1.292% ‐2.813% ‐1.537% ‐0.879% ‐3.288% 1.703% 7.018% ‐7.561% 2.883% ‐6.672% 8.882% Beharry, Lyndon Martin W. 2022‐07‐22_KHC_MC‐Equity‐1Million|CAPEXCalc 07/22/2022 15:04 | Page 5 of 17
  • 4. Equity Valuation 2022‐07‐22_KHC_MC‐Equity‐1Million Financial Statement Review Statement of Cash Flows CashFlows 1,000,000 $USD 2007 2008 2009 2010 2011 2012 2013 2014 2015 2016 2017 2018 2019 2020 2021 CashFlow from Operating Activities: CFO ‐1,645 4,612 2,264 2,385 1,952 3,436 1,586 1,683 9,709 15,364 3,511 7,537 3,584 8,446 Indirect Method Net Income 2,492 1,848 3,028 1,890 1,775 1,642 2,715 1,043 647 3,642 10,932 ‐10,254 1,933 361 1,024 Adjustments D&A 1,339 2,033 893 346 362 569 501 384 740 1,337 1,080 16,919 2,893 4,368 2,544 Deferred Taxes 575 804 730 171 232 420 360 0 0 260 582 152 173 0 0 Decrease / (Increase) in Accounts Receivables 493 ‐493 4,001 293 ‐186 41 197 ‐603 556 ‐376 ‐1,231 ‐1,075 ‐1,165 172 Increase / (Decrease) in Inventories 215 106 2,002 ‐170 15 312 431 ‐1,433 ‐66 ‐131 17 ‐37 ‐89 ‐62 Increase / (Decrease) in Accounts Payable 692 ‐393 2,481 ‐162 ‐109 8 ‐103 ‐1,193 ‐1,152 ‐453 ‐157 ‐7 ‐308 ‐600 Increase / (Decrease) in Accrued Interest Receivable Gain / (Loss) on Sale of Property CashFlow from Investing Activities: CFI 6,085 3,871 10,891 2,330 2,351 3,937 1,952 ‐1,842 4,577 11,634 5,446 3,880 3,167 Indirect Method Cash from Sale of Marketable Securities Cash from Sale of Land Cash from Sale of Other Assets 5,112 1,137 872 2,874 496 250 250 4,243 Purchase of Plant & Equipment ‐499 ‐85 ‐2,001 ‐4,608 ‐658 ‐71 CashFlow from Financing Activities: CFF ‐499 5,112 1,137 ‐85 872 2,874 ‐2,001 ‐4,608 496 ‐658 ‐71 250 250 Indirect Method Cash from Sale of Equity 0 0 0 0 0 0 0 0 0 0 0 0 0 0 0 Cash from Sale of Debt 0 0 0 0 0 0 0 0 0 0 0 0 0 0 0 Cash Interest Paid for Debt ‐604 ‐1,240 ‐1,237 ‐6 ‐7 ‐258 ‐501 ‐484 ‐1,321 ‐1,134 ‐1,234 ‐1,284 ‐1,361 ‐1,394 ‐2,047 Cash Paid to Redeem Debt ‐8,107 6,445 696 958 0 3 1 4 0 ‐2,691 ‐512 2,293 1,663 2,455 ‐356 Cash paid for Dividends 0 0 0 0 0 0 0 0 0 0 0 0 0 0 0 Beharry, Lyndon Martin W. 2022‐07‐22_KHC_MC‐Equity‐1Million|CashFlows 07/22/2022 15:04 | Page 6 of 17
  • 5. Equity Valuation 2022‐07‐22_KHC_MC‐Equity‐1Million Financial Statement Review Complex Debt ForEx Carrying Conversion 1,000,000 $USD Currency Purchases $USD Currency Value Rate Long-Term Debt British pound sterling UKL 1.20000 MatDate Coupon Value Annual Canadian Dollar CND NA USD 18,049.000 1.00000 2022‐12‐31 3.951% 18,049.000 713 Chinese Yuan CNY NA EUR 2,877.000 1.02000 2023‐12‐31 1.875% 2,934.540 55 European Union EUR 1.02000 UKL 172.000 1.20000 2030‐02‐18 6.250% 206.400 13 Korean Won KRW NA UKL 533.000 1.20000 2027‐07‐01 4.125% 639.600 26 South Africa Rand ZAR NA USD 42.000 1.00000 2022‐12‐31 6.925% 42.000 3 Swiss CHF NA USD 128.000 1.00000 Lease Obliga 3.250% 128.000 4 US Dollar USD 1.00000 USD 1.00000 2024‐12‐31 4.500% 0.000 0 USD 1.00000 2024‐12‐31 7.875% 0.000 0 USD 1.00000 2025‐12‐31 7.950% 0.000 0 USD 1.00000 2025‐12‐31 5.600% 0.000 0 USD 1.00000 2025‐12‐31 4.750% 0.000 0 USD 1.00000 2026‐12‐31 5.000% 0.000 0 USD 1.00000 2026‐12‐31 2.370% 0.000 0 USD 1.00000 2027‐12‐31 2.950% 0.000 0 USD 1.00000 2027‐12‐31 3.100% 0.000 0 USD 1.00000 2028‐12‐31 6.440% 0.000 0 USD 1.00000 2028‐12‐31 2.070% 0.000 0 USD 1.00000 2028‐12‐31 2.020% 0.000 0 USD 1.00000 2028‐12‐31 2.110% 0.000 0 USD 1.00000 2028‐12‐31 3.620% 0.000 0 USD 1.00000 2028‐12‐31 2.530% 0.000 0 USD 1.00000 2028‐12‐31 2.480% 0.000 0 USD 1.00000 2029‐12‐31 2.500% 0.000 0 USD 1.00000 2029‐12‐31 3.380% 0.000 0 EUR 1.02000 2030‐12‐31 1.900% 0.000 0 USD 1.00000 2030‐12‐31 3.090% 0.000 0 EUR 1.02000 2031‐12‐31 1.540% 0.000 0 USD 1.00000 2037‐12‐31 5.730% 0.000 0 USD 1.00000 2040‐12‐31 3.100% 0.000 0 USD 1.00000 2041‐12‐31 3.100% 0.000 0 USD 1.00000 2044‐12‐31 4.050% 0.000 0 USD 1.00000 2044‐12‐31 3.100% 0.000 0 USD 1.00000 2046‐12‐31 3.370% 0.000 0 USD 1.00000 2047‐12‐31 3.680% 0.000 0 USD 1.00000 2048‐12‐31 4.070% 0.000 0 USD 1.00000 2048‐12‐31 3.780% 0.000 0 USD 1.00000 2049‐12‐31 3.370% 0.000 0 USD 1.00000 2050‐12‐31 3.720% 0.000 0 USD 1.00000 2022‐12‐31 0.190% 0.000 0 USD 1.00000 0.000 0 USD 1.00000 0.000 0 USD 1.00000 0.000 0 USD 1.00000 0.000 0 USD 1.00000 0.000 0 0.00000 0.000 0 0.00000 0.000 0 0.00000 0.000 0 0.00000 0.000 0 0.00000 0.000 0 0.00000 0.000 0 0.00000 0.000 0 0.00000 0.000 0 0.00000 0.000 0 0.00000 0.000 0 0.00000 0.000 0 0.00000 0.000 0 0.00000 0.000 0 0.00000 0.000 0 0.00000 0.000 0 0.00000 0.000 0 0.00000 0.000 0 0.00000 0.000 0 0.00000 0.000 0 0.00000 0.000 0 0.00000 0.000 0 0.00000 0.000 0 0.00000 0.000 0 0.00000 0.000 0 0.00000 0.000 0 0.00000 0.000 0 0.00000 0.000 0 0.00000 0.000 0 0.00000 0.000 0 0.00000 0.000 0 0.00000 0.000 0 … 21,999.540 814 3.702% Beharry, Lyndon Martin W. 2022‐07‐22_KHC_MC‐Equity‐1Million|Complex Debt 07/22/2022 15:04 | Page 7 of 17
  • 6. Equity Valuation 2022‐07‐22_KHC_MC‐Equity‐1Million Financial Statement Review KHC: Kraft Heinz Co. | FEIN: 46‐2078182 WACCCalc ACCOUNT FOR CURRENT AND LONG‐TERM LIABILITIES Yes DCF analysis will deduct the total value of  liabilities from the firm's cash position. Functional Currency:  1,000,000 $USD DCF ACCOUNTS FOR CASH AND ALL OTHER ASSETS (YES); ONLY CASH AND SHORT‐TERM (NO) No To assess liquidity at T₀, DCF analysis will  deduct Balance Sheet Liabilities from Cash +  Short‐term securities. Debt B Calculations [for Weighted Average Cost of Debt]: FIRE SALE VALUE FOR ASSETS OTHER THAN CASH: 85.000% 1,000,000 Long-Term Debt COST OF DEBT 3.702% MatDate Coupon Value Annual TAX ADJUSTED 2.924% 2018‐09‐01 8.000% 0 OUTSTANDING DEBT OBLIGATIONS 43,942 2.700% 0 0 $USD CURRENCY COST OF DEBT ISSUE. 45,227 1.550% 0 0 6.800% 0 0 2.250% 0 0 COST OF PREFERRED STOCK 0.000% 2.960% 0 0 WEIGHTED MARKET PRICE OF PREFERRED STOCK 0.000 2.400% 0 0 WEIGHTED AVERAGE OF OUTSTANDING PREFERRED STOCK 0 2.150% 0 0 $USD CURRENCY COST OF PREFERRED CAPITAL. 0 2.400% 0 0 2.850% 0 0 2.550% 0 0 MARKET PRICE OF COMMON STOCK 38.490 3.500% 0 0 RECENT SHARES OUT 1,220 4.625% 0 0 OUTSTANDING COMMON STOCK: ESTIMATETTM = AVG(RECENT,10K FIGURE) 1,228 Adjusted for Treasury Stock 4.540% 0 RETAINED EARNINGS ‐1,682 4.580% 0 $USD CURRENCY COST OF COMMON CAPITAL: CAPITALIZATION. 47,102 49,452 BALANCE SHEET SE 1.920% 0 2.610% 0 DIVIDEND IN $USD 1.600 2.840% 0 DIVIDEND YIELD RATE 4.157% 4.150% 0 ONE YR EXPECTED $USD RETURN PER SHARE = [MARKET PRICE X (1+ER)] + DIVIDEND 42.879 1.890% 0 ACTUAL RETURN ON EQUITY: ER for TTM 2.071% 2.470% TTM VALUE EXPECTED RETURN ON EQUITYUPPER: Including Risk Premium 6.514% MEAN OF FINANCIALS AND TTM 0 0 GORDON DIVIDEND RoE IMPUTED ke  7.247% Cost of Long Term Debt 0.000% HISTORICAL 0.790 CAPM FOR COMMON STOCK E(ri) = rf + [E(rm)-rf] LOWER 7.247% Long Term Debt 22,000 ESTIMATE THE COST OF EQUITY ON EXPECTED RoE OR CAPM? WAAC  CAPMKe  Cost 3.70% WACC MEAN 5.130% Short Term Debt 0 Cost 0.00% ESTIMATED SHORT-TERM RISK FREE RATE: T-BILL OR OTHER 2.850% Revolving Debt 0 OVERALL HISTORIC MARKET RETURN 8.416% Cost 0.00% PERPETUITY GROWTH RATE = INFLATION 2.500% Average Debt Cost 3.702% PERPETUITY DISCOUNT FACTORWACC-PERPETUITY GROWTH RATE 2.630% WACC Monte 5.130% TIME HORIZON (YEARS) FOR SCENARIO 10 CAPM Target Price in 1 Years: 41.279 DCF PROJECTED PRICE PER SHARE AT THESE VARIABLES: 34.388 AVERAGE INTERNAL REVENUE GROWTH RATE TIMET-10,T -2.259% Beharry, Lyndon Martin W. 2022‐07‐22_KHC_MC‐Equity‐1Million|WACCCalc 07/22/2022 15:04 | Page 8 of 17
  • 7. Equity Valuation 2022‐07‐22_KHC_MC‐Equity‐1Million Financial Statement Review Variables Monetary Values In 1,000,000 $USD (Except Per Share Values). KHC: Kraft Heinz Co. | FEIN: 46‐2078182 Currency  $USD Note: This sheet carries decimals to 3 places: 0.000 . The Kraft Heinz Company, together with its subsidiaries, manufactures and markets food and beverage products in the United States, Canada, the United Kingdom, and internationally. Its products include condiments and sauces, cheese and dairy  products, meals, meats, refreshment beverages, coffee, and other grocery products. The company also offers dressings, healthy snacks, and other categories; and spices and other seasonings. It sells its products through its own sales organizations, as  well as through independent brokers, agents, and distributors to chain, wholesale, cooperative and independent grocery accounts, convenience stores, drug stores, value stores, bakeries, pharmacies, mass merchants, club stores, and foodservice  distributors and institutions, including hotels, restaurants, hospitals, health care facilities, and government agencies; and online through various e‐commerce platforms and retailers. The company was formerly known as H.J. Heinz Holding Corporation  and changed its name to The Kraft Heinz Company in July 2015. The Kraft Heinz Company was founded in 1869 and is headquartered in Pittsburgh, Pennsylvania. (FY: 2021‐12‐25) User may vary input into shaded cells. Complete the IncStmntReview and BalShtReview worksheets. Complete this page; then run your simulation here. The most recent FY end (type year): 2021 Adjust Base Year for TTM Estimate Yes Calculate Statistics through FY: 2021 Mean Historical Alternate 10.000% Coefficient of Variation Target Cut-off Variables Estimate STDEV Rate Revenue Growth Rate 0.246% 20.535% ‐2.259% High deviation. Coefficient of Variation=8335.09% Use an alternate rate. Alternative Revenue Growth RateDCF 0.00000% 0.000% 0.00% + / -  Growth Per Annum Monte Carlo DCF:  $USD KHC: Kraft Heinz Co. | FEIN: 46-2078182 Projected Growth Rate Y1     0.000% 0.000% Use Alternate Rates: Yes 0.000% 0.000% AGGR CoGS : f(Revenue) 63.544% 3.015% 63.266% 63.266% Depreciation/Amortization [COGs] : f(Revenue) 9.221% 15.837% 9.221% 3.047% High deviation. Coefficient of Variation=171.75% Use an alternate rate. SGA (Only) : f(Revenue) 15.757% 3.637% 16.383% 16.383% High deviation. Coefficient of Variation=23.08% Use an alternate rate. R&D : f(Revenue) 0.000% 0.000% 0.000% 0.000% 0.000% Depreciation/Amortization [SGA] : f(Revenue) 6.179% 15.543% 6.179% 6.416% High deviation. Coefficient of Variation=251.56% Use an alternate rate. Total Other Overhead : f(Revenue) 6.179% 15.543% 6.179% 6.416% Operating expense has a high deviation=251.56% Check rates of member elements. Other Expense (Income) : f(Revenue) -0.552% 1.244% ‐0.570% ‐0.570% High deviation. Coefficient of Variation=225.64% Use an alternate rate. Interest Expense (Income) : f(Revenue) 3.622% 2.347% 1.250% 3.678% 1.250% High deviation. Coefficient of Variation=64.79% Use an alternate rate. Tax Rate : f(EBT) 24.083% 36.336% 21.000% 17.201% High deviation. Coefficient of Variation=150.88% Use an alternate rate. Capital Expenditures : f(Revenue) 7.975% 21.037% 8.079% 8.079% High deviation. Coefficient of Variation=263.78% Use an alternate rate. Δ Working Capital : f(Revenue) 0.280% 4.759% 0.000% 0.296% High deviation. Coefficient of Variation=1700.04% Use an alternate rate. Working Capital : f(Revenue) 2.565% 8.425% 1.285% 1.285% High deviation. Coefficient of Variation=328.45% Use an alternate rate. Equity Minority Interest : f(Revenue) 0.000% 0.000% 0.000% 0.000% Financial Ratios | FY 2021 Current 0.99227714 Acid Test 0.38007502 No Include Accounts Receivable? Debt:Equity 0.88857882 Debt:Debt+Equity 0.47050132 RoA (Adjusted for D&A) 0.0109643 RoE 0.02070695 Gordon Dividend Payout Model: Book Value of the Firm $USD1,000,000 49,452 Book Value Per Share BV0 40.534 Dividend Growth Rate (Gordon Model) gn 160.962% 0.000% Δ KE : [CAPM - Gordon] ke = [(RoE - gn ) X (BV0 / P0)] + gn 7.247% No Actual RoE (Yes); Expected RoE (No) P0/BV0 = PBV = [(RoE-gn)/(ke-gn) 0.94956321 Price Multiple : BV0 0.950 Forecast Share Price From Multiple X BV0 38.490 Static Model: DCF Valuation Per Share 34.388 Growth Rate: 0.00% less 0.00% each subsequent year after T₁.  $USD 34.388 VARIABLES FOR WACC CALCULATIONS Market and CAPM Modelling 2.850% Risk‐Free Rate (T‐Bill/Bond/Note, LIBOR or other imputed rate) 8.416% Overall historic Market Return Equity Share Variables 38.490 Current Market Price of Common Stock 1.600 Dividend, if applicable 0.790  eta  2.470% Return on Equity TTM 15.000% Expected Return on Equity 1,220.000 Current Shares Outstanding (diluted) Including Treasury Holdings in 1,000,000's Preferred Share Variables Current Market Price of Preferred Stock: A, if applicable 0 Current shares outstanding 1,000,000 Preferred: A stock coupon Current Market Price of Preferred Stock: B, if applicable 0 Current shares outstanding 1,000,000 Preferred: B stock coupon Current Market Price of Preferred Stock: C, if applicable 0 Current shares outstanding 1,000,000 Preferred: C stock coupon Current Market Price of Preferred Stock: D, if applicable 0 Current shares outstanding 1,000,000 Preferred: D stock coupon 0 Weighted Number of Preferred Shares Outstanding 0.000% Weighted Cost (Coupon) of Preferred Shares Outstanding 0.000 Weighted Market Price of Preferred Perpetuity Growth Rate Inflation Long‐term Growth Rate (for perpetuity model) 2.500% Long‐Term Inflation Rate 3.580% Average Long‐Term Inflation Rate: U.S.A. 7.247% CAPM KE  Basis of WACC Calculation WAAC  CAPMKe  CALCULATE DISCOUNT RATE VARYING EQUITY WEIGHTING:  WACC, CAPM, GORDON RoE, AVERAGE OF CAPM AND GORDON RoE? Yes VARY WACC AROUND ITS MEAN? 2.000% AT THIS COEFFICIENT OF VARIATION (  PERCENT OF THE MEAN). 5.130% WACC FOR SIMULATION ALTERNATE PLUG FOR WACC DISCOUNT FACTOR Forecast Results Summary Per Share 37.770 P/E Valuation 45.000 PE Forward 42.879 CAPM Valuation No Revenue Growth 38.490 BV0 Multiple Valuation 34.388 Static DCF Valuation 35.496 Monte Carlo DCF  Valuation 37.805    of All Models Valuation Monte Carlo Analysis: 35.496 Monte Carlo DCF  2.500  155.517 Monte Carlo Upper 155.517 (112.956) Monte Carlo Lower (112.956) 268.473 Monte Carlo Range 756.342% Range:Mean Student's t Distribution The header (top) is higher | lower than the complement (left). Ratio Comparison of the Models P/E CAPM Gordon BV0  Static DCF MC DCF  Models P/E 0.000% 13.526% 1.905% ‐8.954% ‐6.021% 0.091% CAPM ‐11.915% 0.000% ‐10.237% ‐19.802% ‐17.218% ‐11.834% Gordon BV0  ‐1.869% 11.404% 0.000% ‐10.656% ‐7.778% ‐1.780% Static DCF 9.835% 24.691% 11.927% 0.000% 3.222% 9.935% MC DCF 6.407% 20.800% 8.434% ‐3.121% 0.000% 6.504%  Models ‐0.091% 13.423% 1.812% ‐9.037% ‐6.107% 0.000% Beharry, Lyndon Martin W. 2022‐07‐22_KHC_MC‐Equity‐1Million|Variables 07/22/2022 15:04 | Page 9 of 17
  • 8. Equity Valuation 2022‐07‐22_KHC_MC‐Equity‐1Million Financial Statement Review Type alternative annual growth rates here: KHC: Kraft Heinz Co. | FEIN: 46‐2078182: Monte Carlo: Valuation Per Share |  $USD Mask Monetary Values In 1,000,000 $USD (Except Per Share Values). 1,000,000 $USD Revenue Growth Rate2022 Revenue Growth Rate2023 Revenue Growth Rate2024 Revenue Growth Rate2025 Revenue Growth Rate2026 Revenue Growth Rate2027 Revenue Growth Rate2028 Revenue Growth Rate2029 Revenue Growth Rate2030 Revenue Growth Rate2031 Revenue Growth Rate2032 Projection Base [FY] Year T0  2021 2021 2022 2023 2024 2025 2026 2027 2028 2029 2030 2031 2032 Mean STDEV 0 1 2 3 4 5 6 7 8 9 10 Revenue Growth Rate 2022 00.0% Revenue Growth Rate 2023 00.0% Revenue Growth Rate 2024 00.0% Revenue Growth Rate 2025 00.0% Revenue Growth Rate 2026 00.0% Revenue Growth Rate 2027 00.0% Revenue Growth Rate 2028 00.0% Revenue Growth Rate 2029 00.0% Revenue Growth Rate 2030 00.0% Revenue Growth Rate 2031 00.0% Revenue Growth Rate 2032 00.0% 0.000% 0.000% Random Growth Rate Sequential Reduction 0.000% Alternate Coefficient of Variability 10.00% 0.00% 0.00% 0.00% 0.00% 0.00% 0.00% 0.00% 0.00% 0.00% 0.00% 0.00% Timet0 Timet+1 Timet+2 Timet+3 Timet+4 Timet+5 Timet+6 Timet+7 Timet+8 Timet+9 Timet+10 Timet+11 Projection TimeT1  26,042 MONTE CARLO REVENUE 26,042 26,042 26,042 26,042 26,042 26,042 26,042 26,042 26,042 26,042 26,042 CoGS : f(Revenue)2022 CoGS : f(Revenue)2023 CoGS : f(Revenue)2024 CoGS : f(Revenue)2025 CoGS : f(Revenue)2026 CoGS : f(Revenue)2027 CoGS : f(Revenue)2028 CoGS : f(Revenue)2029 CoGS : f(Revenue)2030 CoGS : f(Revenue)2031 CoGS : f(Revenue)2032 63.266% 6.327% CoGS: 0.00% 0 0 0 0 0 0 0 0 0 0 0 Depreciation/Amortization [COGs] : f(Revenue)2022 Depreciation/Amortization [COGs] : f(Revenue)2023 Depreciation/Amortization [COGs] : f(Revenue)2024 Depreciation/Amortization [COGs] : f(Revenue)2025 Depreciation/Amortization [COGs] : f(Revenue)2026 Depreciation/Amortization [COGs] : f(Revenue)2027 Depreciation/Amortization [COGs] : f(Revenue)2028 Depreciation/Amortization [COGs] : f(Revenue)2029 Depreciation/Amortization [COGs] : f(Revenue)2030 Depreciation/Amortization [COGs] : f(Revenue)2031 Depreciation/Amortization [COGs] : f(Revenue)2032 9.221% 0.922% D&A (Production): 0.00% 0 0 0 0 0 0 0 0 0 0 0 GROSS MARGIN: 100.00% 26,042 26,042 26,042 26,042 26,042 26,042 26,042 26,042 26,042 26,042 26,042 SGA (Only) : f(Revenue)2022 SGA (Only) : f(Revenue)2023 SGA (Only) : f(Revenue)2024 SGA (Only) : f(Revenue)2025 SGA (Only) : f(Revenue)2026 SGA (Only) : f(Revenue)2027 SGA (Only) : f(Revenue)2028 SGA (Only) : f(Revenue)2029 SGA (Only) : f(Revenue)2030 SGA (Only) : f(Revenue)2031 SGA (Only) : f(Revenue)2032 16.383% 1.638% Administrative Costs: SGA: 0.00% 0 0 0 0 0 0 0 0 0 0 0 R&D : f(Revenue)2022 R&D : f(Revenue)2023 R&D : f(Revenue)2024 R&D : f(Revenue)2025 R&D : f(Revenue)2026 R&D : f(Revenue)2027 R&D : f(Revenue)2028 R&D : f(Revenue)2029 R&D : f(Revenue)2030 R&D : f(Revenue)2031 R&D : f(Revenue)2032 0.000% 0.000% R & D: 0.00% 0 0 0 0 0 0 0 0 0 0 0 Depreciation/Amortization [SGA] : f(Revenue)2022 Depreciation/Amortization [SGA] : f(Revenue)2023 Depreciation/Amortization [SGA] : f(Revenue)2024 Depreciation/Amortization [SGA] : f(Revenue)2025 Depreciation/Amortization [SGA] : f(Revenue)2026 Depreciation/Amortization [SGA] : f(Revenue)2027 Depreciation/Amortization [SGA] : f(Revenue)2028 Depreciation/Amortization [SGA] : f(Revenue)2029 Depreciation/Amortization [SGA] : f(Revenue)2030 Depreciation/Amortization [SGA] : f(Revenue)2031 Depreciation/Amortization [SGA] : f(Revenue)2032 6.179% 0.618% D & A [SGA]: 0.00% 0 0 0 0 0 0 0 0 0 0 0 Admin Expenses: 0.00% 0 0 0 0 0 0 0 0 0 0 0 Other Expense (Income) : f(Revenue)2022 Other Expense (Income) : f(Revenue)2023 Other Expense (Income) : f(Revenue)2024 Other Expense (Income) : f(Revenue)2025 Other Expense (Income) : f(Revenue)2026 Other Expense (Income) : f(Revenue)2027 Other Expense (Income) : f(Revenue)2028 Other Expense (Income) : f(Revenue)2029 Other Expense (Income) : f(Revenue)2030 Other Expense (Income) : f(Revenue)2031 Other Expense (Income) : f(Revenue)2032 -0.570% 0.057% Other: 0.00% 0 0 0 0 0 0 0 0 0 0 0 EBIT: 100.00% 26,042 26,042 26,042 26,042 26,042 26,042 26,042 26,042 26,042 26,042 26,042 Interest Expense (Income) : f(Revenue)2022 Interest Expense (Income) : f(Revenue)2023 Interest Expense (Income) : f(Revenue)2024 Interest Expense (Income) : f(Revenue)2025 Interest Expense (Income) : f(Revenue)2026 Interest Expense (Income) : f(Revenue)2027 Interest Expense (Income) : f(Revenue)2028 Interest Expense (Income) : f(Revenue)2029 Interest Expense (Income) : f(Revenue)2030 Interest Expense (Income) : f(Revenue)2031 Interest Expense (Income) : f(Revenue)2032 1.250% 0.125% Interest Expense: 0.00% 0 0 0 0 0 0 0 0 0 0 0 EBT: 100.00% 26,042 26,042 26,042 26,042 26,042 26,042 26,042 26,042 26,042 26,042 26,042 Tax Rate : f(EBT)2022 Tax Rate : f(EBT)2023 Tax Rate : f(EBT)2024 Tax Rate : f(EBT)2025 Tax Rate : f(EBT)2026 Tax Rate : f(EBT)2027 Tax Rate : f(EBT)2028 Tax Rate : f(EBT)2029 Tax Rate : f(EBT)2030 Tax Rate : f(EBT)2031 Tax Rate : f(EBT)2032 21.000% 2.100% Taxes: 0.00% 0 0 0 0 0 0 0 0 0 0 0 Tax Payable Tax Payable Tax Payable Tax Payable Tax Payable Tax Payable Tax Payable Tax Payable Tax Payable Tax Payable Tax Payable NET EARNINGS: 100.00% 26,042 26,042 26,042 26,042 26,042 26,042 26,042 26,042 26,042 26,042 26,042 D&A Add‐Back: 0.00% 0 0 0 0 0 0 0 0 0 0 0 Capital Expenditures : f(Revenue)2022 Capital Expenditures : f(Revenue)2023 Capital Expenditures : f(Revenue)2024 Capital Expenditures : f(Revenue)2025 Capital Expenditures : f(Revenue)2026 Capital Expenditures : f(Revenue)2027 Capital Expenditures : f(Revenue)2028 Capital Expenditures : f(Revenue)2029 Capital Expenditures : f(Revenue)2030 Capital Expenditures : f(Revenue)2031 Capital Expenditures : f(Revenue)2032 8.079% 0.808% CAP EX: 0.00% 0 0 0 0 0 0 0 0 0 0 0 Δ  Working Capital : f(Revenue)2022 Δ  Working Capital : f(Revenue)2023 Δ  Working Capital : f(Revenue)2024 Δ  Working Capital : f(Revenue)2025 Δ  Working Capital : f(Revenue)2026 Δ  Working Capital : f(Revenue)2027 Δ  Working Capital : f(Revenue)2028 Δ  Working Capital : f(Revenue)2029 Δ  Working Capital : f(Revenue)2030 Δ  Working Capital : f(Revenue)2031 Δ  Working Capital : f(Revenue)2032 0.000% 0.000% Δ WRK CAP: 0.00% 0 0 0 0 0 0 0 0 0 0 0 Equity Minority Interest : f(Revenue)2022 Equity Minority Interest : f(Revenue)2023 Equity Minority Interest : f(Revenue)2024 Equity Minority Interest : f(Revenue)2025 Equity Minority Interest : f(Revenue)2026 Equity Minority Interest : f(Revenue)2027 Equity Minority Interest : f(Revenue)2028 Equity Minority Interest : f(Revenue)2029 Equity Minority Interest : f(Revenue)2030 Equity Minority Interest : f(Revenue)2031 Equity Minority Interest : f(Revenue)2032 0.000% 0.000% EARN AFFL: 0.00% 0 0 0 0 0 0 0 0 0 0 0 ‐45,227 LESS CURRENT DEBT AND OTHER LONG-TERM LIABILITIES T₀ (Adjusted for Carrying Costs ) 0 LESS PREFERRED AT PAR T₀ 3,445 EXCESS CASH & SHORT-TERM SECURITIES T₀ GROWTH 2.500% DCF analysis will deduct the total value of liabilities from the firm's cash position. PERPETUITY VALUE FCF to Equity 26,042 26,042 26,042 26,042 26,042 26,042 26,042 26,042 26,042 26,042 26,042 1,015,065 WACC FOR SIMULATION 5.130% 0.103% To assess liquidity at T₀, DCF analysis will deduct Balance Sheet Liabilities from Cash + Short‐term securities. DCF to the Investors 1,259,745 DCF analysis will deduct the total value of liabilities from the firm's cash position. KHC: Kraft Heinz Co. | FEIN: 46-2078182: Monte Carlo: Valuation Per Share | $USD PER SHARE Beharry, Lyndon Martin W. 2022‐07‐22_KHC_MC‐Equity‐1Million|DCF All Variable_MC 07/22/2022 15:04 | Page 10 of 17
  • 9. Equity Valuation 2022‐07‐22_KHC_MC‐Equity‐1Million Financial Statement Review Type alternative annual growth rates here: KHC: Kraft Heinz Co. | FEIN: 46‐2078182: Monte Carlo: Valuation Per Share |  $USD Mask Monetary Values In 1,000,000 $USD (Except Per Share Values). 1,000,000 $USD Revenue Growth Rate2022 Revenue Growth Rate2023 Revenue Growth Rate2024 Revenue Growth Rate2025 Revenue Growth Rate2026 Revenue Growth Rate2027 Revenue Growth Rate2028 Revenue Growth Rate2029 Revenue Growth Rate2030 Revenue Growth Rate2031 Revenue Growth Rate2032 Projection Base [FY] Year T0  2021 2021 2022 2023 2024 2025 2026 2027 2028 2029 2030 2031 2032 Mean STDEV 0 1 2 3 4 5 6 7 8 9 10 Revenue Growth Rate 2022 00.0% Revenue Growth Rate 2023 00.0% Revenue Growth Rate 2024 00.0% Revenue Growth Rate 2025 00.0% Revenue Growth Rate 2026 00.0% Revenue Growth Rate 2027 00.0% Revenue Growth Rate 2028 00.0% Revenue Growth Rate 2029 00.0% Revenue Growth Rate 2030 00.0% Revenue Growth Rate 2031 00.0% Revenue Growth Rate 2032 00.0% 0.000% 0.000% Random Growth Rate 0.00% 0.00% 0.00% 0.00% 0.00% 0.00% 0.00% 0.00% 0.00% 0.00% 0.00% Sequential Reduction 0.000% Alternate Coefficient of Variability 10.00% 0.00% 0.00% 0.00% 0.00% 0.00% 0.00% 0.00% 0.00% 0.00% 0.00% 0.00% Timet0 Timet+1 Timet+2 Timet+3 Timet+4 Timet+5 Timet+6 Timet+7 Timet+8 Timet+9 Timet+10 Timet+11 Projection TimeT1 26,042 MONTE CARLO REVENUE 26,042 26,042 26,042 26,042 26,042 26,042 26,042 26,042 26,042 26,042 26,042 CoGS : f(Revenue)2022 CoGS : f(Revenue)2023 CoGS : f(Revenue)2024 CoGS : f(Revenue)2025 CoGS : f(Revenue)2026 CoGS : f(Revenue)2027 CoGS : f(Revenue)2028 CoGS : f(Revenue)2029 CoGS : f(Revenue)2030 CoGS : f(Revenue)2031 CoGS : f(Revenue)2032 63.266% 6.327% 55.413% 60.845% 68.201% 72.433% 62.177% 72.800% 68.786% 62.963% 56.308% 54.551% 67.578% CoGS: 63.82% ‐14,431 ‐15,845 ‐17,761 ‐18,863 ‐16,192 ‐18,958 ‐17,913 ‐16,397 ‐14,664 ‐14,206 ‐17,599 Depreciation/Amortization [COGs] : f(Revenue)2022 Depreciation/Amortization [COGs] : f(Revenue)2023 Depreciation/Amortization [COGs] : f(Revenue)2024 Depreciation/Amortization [COGs] : f(Revenue)2025 Depreciation/Amortization [COGs] : f(Revenue)2026 Depreciation/Amortization [COGs] : f(Revenue)2027 Depreciation/Amortization [COGs] : f(Revenue)2028 Depreciation/Amortization [COGs] : f(Revenue)2029 Depreciation/Amortization [COGs] : f(Revenue)2030 Depreciation/Amortization [COGs] : f(Revenue)2031 Depreciation/Amortization [COGs] : f(Revenue)2032 9.221% 0.922% 9.437% 10.099% 8.328% 10.086% 9.329% 11.038% 10.339% 8.902% 8.651% 8.100% 8.455% D&A (Production): 9.34% ‐2,458 ‐2,630 ‐2,169 ‐2,626 ‐2,430 ‐2,875 ‐2,693 ‐2,318 ‐2,253 ‐2,109 ‐2,202 GROSS MARGIN: 26.83% 9,154 7,567 6,112 4,553 7,420 4,209 5,436 7,327 9,125 9,726 6,241 SGA (Only) : f(Revenue)2022 SGA (Only) : f(Revenue)2023 SGA (Only) : f(Revenue)2024 SGA (Only) : f(Revenue)2025 SGA (Only) : f(Revenue)2026 SGA (Only) : f(Revenue)2027 SGA (Only) : f(Revenue)2028 SGA (Only) : f(Revenue)2029 SGA (Only) : f(Revenue)2030 SGA (Only) : f(Revenue)2031 SGA (Only) : f(Revenue)2032 16.383% 1.638% Administrative Costs: 16.127% 15.860% 15.795% 17.675% 16.731% 16.543% 15.403% 18.667% 16.551% 17.521% 15.812% SGA: 16.13% ‐4,200 ‐4,200 ‐4,200 ‐4,200 ‐4,200 ‐4,200 ‐4,200 ‐4,200 ‐4,200 ‐4,200 ‐4,200 R&D : f(Revenue)2022 R&D : f(Revenue)2023 R&D : f(Revenue)2024 R&D : f(Revenue)2025 R&D : f(Revenue)2026 R&D : f(Revenue)2027 R&D : f(Revenue)2028 R&D : f(Revenue)2029 R&D : f(Revenue)2030 R&D : f(Revenue)2031 R&D : f(Revenue)2032 0.000% 0.000% 0.000% 0.000% 0.000% 0.000% 0.000% 0.000% 0.000% 0.000% 0.000% 0.000% 0.000% R & D: 0.00% 0 0 0 0 0 0 0 0 0 0 0 Depreciation/Amortization [SGA] : f(Revenue)2022 Depreciation/Amortization [SGA] : f(Revenue)2023 Depreciation/Amortization [SGA] : f(Revenue)2024 Depreciation/Amortization [SGA] : f(Revenue)2025 Depreciation/Amortization [SGA] : f(Revenue)2026 Depreciation/Amortization [SGA] : f(Revenue)2027 Depreciation/Amortization [SGA] : f(Revenue)2028 Depreciation/Amortization [SGA] : f(Revenue)2029 Depreciation/Amortization [SGA] : f(Revenue)2030 Depreciation/Amortization [SGA] : f(Revenue)2031 Depreciation/Amortization [SGA] : f(Revenue)2032 6.179% 0.618% 5.920% 5.770% 6.297% 5.786% 6.291% 6.960% 6.602% 5.918% 7.110% 6.718% 6.263% D & A [SGA]: 6.33% ‐1,542 ‐1,503 ‐1,640 ‐1,507 ‐1,638 ‐1,812 ‐1,719 ‐1,541 ‐1,851 ‐1,749 ‐1,631 Admin Expenses: 22.46% ‐5,741 ‐5,702 ‐5,840 ‐5,707 ‐5,838 ‐6,012 ‐5,919 ‐5,741 ‐6,051 ‐5,949 ‐5,831 Other Expense (Income) : f(Revenue)2022 Other Expense (Income) : f(Revenue)2023 Other Expense (Income) : f(Revenue)2024 Other Expense (Income) : f(Revenue)2025 Other Expense (Income) : f(Revenue)2026 Other Expense (Income) : f(Revenue)2027 Other Expense (Income) : f(Revenue)2028 Other Expense (Income) : f(Revenue)2029 Other Expense (Income) : f(Revenue)2030 Other Expense (Income) : f(Revenue)2031 Other Expense (Income) : f(Revenue)2032 -0.570% 0.057% ‐0.576% ‐0.630% ‐0.583% ‐0.585% ‐0.550% ‐0.599% ‐0.576% ‐0.636% ‐0.552% ‐0.575% ‐0.505% Other: ‐0.58% 150 164 152 152 143 156 150 166 144 150 132 EBIT: 4.96% 3,562 2,028 424 ‐1,002 1,726 ‐1,647 ‐333 1,752 3,218 3,927 542 Interest Expense (Income) : f(Revenue)2022 Interest Expense (Income) : f(Revenue)2023 Interest Expense (Income) : f(Revenue)2024 Interest Expense (Income) : f(Revenue)2025 Interest Expense (Income) : f(Revenue)2026 Interest Expense (Income) : f(Revenue)2027 Interest Expense (Income) : f(Revenue)2028 Interest Expense (Income) : f(Revenue)2029 Interest Expense (Income) : f(Revenue)2030 Interest Expense (Income) : f(Revenue)2031 Interest Expense (Income) : f(Revenue)2032 1.250% 0.125% 1.248% 1.289% 1.302% 1.356% 1.163% 1.358% 1.206% 1.140% 1.418% 1.303% 1.312% Interest Expense: 1.28% ‐325 ‐336 ‐339 ‐353 ‐303 ‐354 ‐314 ‐297 ‐369 ‐339 ‐342 EBT: 3.68% 3,237 1,693 85 ‐1,355 1,423 ‐2,001 ‐647 1,455 2,849 3,588 201 Tax Rate : f(EBT)2022 Tax Rate : f(EBT)2023 Tax Rate : f(EBT)2024 Tax Rate : f(EBT)2025 Tax Rate : f(EBT)2026 Tax Rate : f(EBT)2027 Tax Rate : f(EBT)2028 Tax Rate : f(EBT)2029 Tax Rate : f(EBT)2030 Tax Rate : f(EBT)2031 Tax Rate : f(EBT)2032 21.000% 2.100% 23.804% 19.014% 24.301% 20.969% 21.004% 22.875% 21.585% 22.852% 19.911% 21.130% 22.226% Taxes: 5.65% ‐771 ‐322 ‐21 284 46 408 587 224 ‐229 ‐758 ‐45 Tax Payable Tax Payable Tax Payable Tax Payable Tax Payable Tax Payable Tax Payable Tax Payable Tax Payable Tax Payable Tax Payable NET EARNINGS: 3.47% 2,467 1,371 65 ‐1,071 1,468 ‐1,593 ‐60 1,679 2,620 2,830 156 D&A Add‐Back: 15.67% 3,999 4,133 3,809 4,133 4,068 4,687 4,412 3,859 4,104 3,859 3,833 Capital Expenditures : f(Revenue)2022 Capital Expenditures : f(Revenue)2023 Capital Expenditures : f(Revenue)2024 Capital Expenditures : f(Revenue)2025 Capital Expenditures : f(Revenue)2026 Capital Expenditures : f(Revenue)2027 Capital Expenditures : f(Revenue)2028 Capital Expenditures : f(Revenue)2029 Capital Expenditures : f(Revenue)2030 Capital Expenditures : f(Revenue)2031 Capital Expenditures : f(Revenue)2032 8.079% 0.808% 8.369% 8.267% 7.144% 9.248% 9.353% 6.908% 7.738% 8.069% 8.503% 8.383% 6.651% CAP EX: 8.06% ‐2,179 ‐2,153 ‐1,861 ‐2,408 ‐2,436 ‐1,799 ‐2,015 ‐2,101 ‐2,214 ‐2,183 ‐1,732 Δ  Working Capital : f(Revenue)2022 Δ  Working Capital : f(Revenue)2023 Δ  Working Capital : f(Revenue)2024 Δ  Working Capital : f(Revenue)2025 Δ  Working Capital : f(Revenue)2026 Δ  Working Capital : f(Revenue)2027 Δ  Working Capital : f(Revenue)2028 Δ  Working Capital : f(Revenue)2029 Δ  Working Capital : f(Revenue)2030 Δ  Working Capital : f(Revenue)2031 Δ  Working Capital : f(Revenue)2032 0.000% 0.000% 0.000% 0.000% 0.000% 0.000% 0.000% 0.000% 0.000% 0.000% 0.000% 0.000% 0.000% Δ WRK CAP: 0.00% 0 0 0 0 0 0 0 0 0 0 0 Equity Minority Interest : f(Revenue)2022 Equity Minority Interest : f(Revenue)2023 Equity Minority Interest : f(Revenue)2024 Equity Minority Interest : f(Revenue)2025 Equity Minority Interest : f(Revenue)2026 Equity Minority Interest : f(Revenue)2027 Equity Minority Interest : f(Revenue)2028 Equity Minority Interest : f(Revenue)2029 Equity Minority Interest : f(Revenue)2030 Equity Minority Interest : f(Revenue)2031 Equity Minority Interest : f(Revenue)2032 0.000% 0.000% 0.000% 0.000% 0.000% 0.000% 0.000% 0.000% 0.000% 0.000% 0.000% 0.000% 0.000% EARN AFFL: 0.00% 0 0 0 0 0 0 0 0 0 0 0 ‐45,227 LESS CURRENT DEBT AND OTHER LONG-TERM LIABILITIES T₀ (Adjusted for Carrying Costs ) 0 LESS PREFERRED AT PAR T₀ 3,445 EXCESS CASH & SHORT-TERM SECURITIES T₀ GROWTH 2.500% DCF analysis will deduct the total value of liabilities from the firm's cash position. PERPETUITY VALUE FCF to Equity 4,287 3,351 2,013 654 3,100 1,295 2,337 3,437 4,510 4,505 2,257 87,966 WACC FOR SIMULATION 5.130% 0.103% To assess liquidity at T₀, DCF analysis will deduct Balance Sheet Liabilities from Cash + Short‐term securities. 5.056% DCF to the Investors 30,589 DCF analysis will deduct the total value of liabilities from the firm's cash position. KHC: Kraft Heinz Co. | FEIN: 46-2078182: Monte Carlo: Valuation Per Share | $USD 24.919 PER SHARE Beharry, Lyndon Martin W. 2022‐07‐22_KHC_MC‐Equity‐1Million|DCF All Variable_MC 07/22/2022 14:25 | Page 10A of 17
  • 10. Equity Valuation 2022‐07‐22_KHC_MC‐Equity‐1Million Financial Statement Review Type alternative annual growth rates here: KHC: Kraft Heinz Co. | FEIN: 46‐2078182: Monte Carlo: Valuation Per Share |  $USD Mask Monetary Values In 1,000,000 $USD (Except Per Share Values). 1,000,000 $USD Revenue Growth Rate2022 Revenue Growth Rate2023 Revenue Growth Rate2024 Revenue Growth Rate2025 Revenue Growth Rate2026 Revenue Growth Rate2027 Revenue Growth Rate2028 Revenue Growth Rate2029 Revenue Growth Rate2030 Revenue Growth Rate2031 Revenue Growth Rate2032 Projection Base [FY] Year T0  2021 2021 2022 2023 2024 2025 2026 2027 2028 2029 2030 2031 2032 Mean STDEV 0 1 2 3 4 5 6 7 8 9 10 Revenue Growth Rate 2022 00.0% Revenue Growth Rate 2023 00.0% Revenue Growth Rate 2024 00.0% Revenue Growth Rate 2025 00.0% Revenue Growth Rate 2026 00.0% Revenue Growth Rate 2027 00.0% Revenue Growth Rate 2028 00.0% Revenue Growth Rate 2029 00.0% Revenue Growth Rate 2030 00.0% Revenue Growth Rate 2031 00.0% Revenue Growth Rate 2032 00.0% 0.000% 0.000% Random Growth Rate 0.00% 0.00% 0.00% 0.00% 0.00% 0.00% 0.00% 0.00% 0.00% 0.00% 0.00% Sequential Reduction 0.000% Alternate Coefficient of Variability 10.00% 0.00% 0.00% 0.00% 0.00% 0.00% 0.00% 0.00% 0.00% 0.00% 0.00% 0.00% Timet0 Timet+1 Timet+2 Timet+3 Timet+4 Timet+5 Timet+6 Timet+7 Timet+8 Timet+9 Timet+10 Timet+11 Projection TimeT1 26,042 MONTE CARLO REVENUE 26,042 26,042 26,042 26,042 26,042 26,042 26,042 26,042 26,042 26,042 26,042 CoGS : f(Revenue)2022 CoGS : f(Revenue)2023 CoGS : f(Revenue)2024 CoGS : f(Revenue)2025 CoGS : f(Revenue)2026 CoGS : f(Revenue)2027 CoGS : f(Revenue)2028 CoGS : f(Revenue)2029 CoGS : f(Revenue)2030 CoGS : f(Revenue)2031 CoGS : f(Revenue)2032 63.266% 6.327% 57.182% 59.210% 74.837% 68.070% 67.817% 53.935% 66.437% 63.980% 65.936% 62.659% 66.957% CoGS: 64.27% ‐14,891 ‐15,419 ‐19,489 ‐17,727 ‐17,661 ‐14,046 ‐17,301 ‐16,662 ‐17,171 ‐16,318 ‐17,437 Depreciation/Amortization [COGs] : f(Revenue)2022 Depreciation/Amortization [COGs] : f(Revenue)2023 Depreciation/Amortization [COGs] : f(Revenue)2024 Depreciation/Amortization [COGs] : f(Revenue)2025 Depreciation/Amortization [COGs] : f(Revenue)2026 Depreciation/Amortization [COGs] : f(Revenue)2027 Depreciation/Amortization [COGs] : f(Revenue)2028 Depreciation/Amortization [COGs] : f(Revenue)2029 Depreciation/Amortization [COGs] : f(Revenue)2030 Depreciation/Amortization [COGs] : f(Revenue)2031 Depreciation/Amortization [COGs] : f(Revenue)2032 9.221% 0.922% 9.672% 9.960% 10.275% 9.717% 9.497% 10.385% 9.982% 9.989% 7.926% 9.421% 8.088% D&A (Production): 9.54% ‐2,519 ‐2,594 ‐2,676 ‐2,531 ‐2,473 ‐2,704 ‐2,599 ‐2,601 ‐2,064 ‐2,454 ‐2,106 GROSS MARGIN: 26.19% 8,632 8,029 3,877 5,785 5,908 9,292 6,141 6,779 6,807 7,271 6,499 SGA (Only) : f(Revenue)2022 SGA (Only) : f(Revenue)2023 SGA (Only) : f(Revenue)2024 SGA (Only) : f(Revenue)2025 SGA (Only) : f(Revenue)2026 SGA (Only) : f(Revenue)2027 SGA (Only) : f(Revenue)2028 SGA (Only) : f(Revenue)2029 SGA (Only) : f(Revenue)2030 SGA (Only) : f(Revenue)2031 SGA (Only) : f(Revenue)2032 16.383% 1.638% Administrative Costs: 17.248% 16.391% 14.507% 18.390% 14.610% 12.232% 16.796% 15.864% 16.149% 16.546% 15.182% SGA: 17.25% ‐4,492 ‐4,492 ‐4,492 ‐4,492 ‐4,492 ‐4,492 ‐4,492 ‐4,492 ‐4,492 ‐4,492 ‐4,492 R&D : f(Revenue)2022 R&D : f(Revenue)2023 R&D : f(Revenue)2024 R&D : f(Revenue)2025 R&D : f(Revenue)2026 R&D : f(Revenue)2027 R&D : f(Revenue)2028 R&D : f(Revenue)2029 R&D : f(Revenue)2030 R&D : f(Revenue)2031 R&D : f(Revenue)2032 0.000% 0.000% 0.000% 0.000% 0.000% 0.000% 0.000% 0.000% 0.000% 0.000% 0.000% 0.000% 0.000% R & D: 0.00% 0 0 0 0 0 0 0 0 0 0 0 Depreciation/Amortization [SGA] : f(Revenue)2022 Depreciation/Amortization [SGA] : f(Revenue)2023 Depreciation/Amortization [SGA] : f(Revenue)2024 Depreciation/Amortization [SGA] : f(Revenue)2025 Depreciation/Amortization [SGA] : f(Revenue)2026 Depreciation/Amortization [SGA] : f(Revenue)2027 Depreciation/Amortization [SGA] : f(Revenue)2028 Depreciation/Amortization [SGA] : f(Revenue)2029 Depreciation/Amortization [SGA] : f(Revenue)2030 Depreciation/Amortization [SGA] : f(Revenue)2031 Depreciation/Amortization [SGA] : f(Revenue)2032 6.179% 0.618% 6.544% 6.149% 6.274% 6.670% 7.642% 6.661% 5.578% 6.147% 5.438% 5.130% 6.896% D & A [SGA]: 6.28% ‐1,704 ‐1,601 ‐1,634 ‐1,737 ‐1,990 ‐1,735 ‐1,453 ‐1,601 ‐1,416 ‐1,336 ‐1,796 Admin Expenses: 23.53% ‐6,196 ‐6,093 ‐6,126 ‐6,229 ‐6,482 ‐6,227 ‐5,944 ‐6,093 ‐5,908 ‐5,828 ‐6,288 Other Expense (Income) : f(Revenue)2022 Other Expense (Income) : f(Revenue)2023 Other Expense (Income) : f(Revenue)2024 Other Expense (Income) : f(Revenue)2025 Other Expense (Income) : f(Revenue)2026 Other Expense (Income) : f(Revenue)2027 Other Expense (Income) : f(Revenue)2028 Other Expense (Income) : f(Revenue)2029 Other Expense (Income) : f(Revenue)2030 Other Expense (Income) : f(Revenue)2031 Other Expense (Income) : f(Revenue)2032 -0.570% 0.057% ‐0.493% ‐0.615% ‐0.560% ‐0.589% ‐0.649% ‐0.607% ‐0.592% ‐0.597% ‐0.553% ‐0.530% ‐0.470% Other: ‐0.57% 128 160 146 153 169 158 154 156 144 138 122 EBIT: 3.22% 2,564 2,096 ‐2,103 ‐291 ‐405 3,224 351 842 1,043 1,581 334 Interest Expense (Income) : f(Revenue)2022 Interest Expense (Income) : f(Revenue)2023 Interest Expense (Income) : f(Revenue)2024 Interest Expense (Income) : f(Revenue)2025 Interest Expense (Income) : f(Revenue)2026 Interest Expense (Income) : f(Revenue)2027 Interest Expense (Income) : f(Revenue)2028 Interest Expense (Income) : f(Revenue)2029 Interest Expense (Income) : f(Revenue)2030 Interest Expense (Income) : f(Revenue)2031 Interest Expense (Income) : f(Revenue)2032 1.250% 0.125% 1.408% 1.265% 1.303% 1.473% 1.178% 1.372% 1.275% 1.235% 1.279% 1.446% 1.292% Interest Expense: 1.32% ‐367 ‐329 ‐339 ‐384 ‐307 ‐357 ‐332 ‐322 ‐333 ‐376 ‐336 EBT: 1.90% 2,197 1,766 ‐2,442 ‐674 ‐712 2,866 19 520 710 1,204 ‐3 Tax Rate : f(EBT)2022 Tax Rate : f(EBT)2023 Tax Rate : f(EBT)2024 Tax Rate : f(EBT)2025 Tax Rate : f(EBT)2026 Tax Rate : f(EBT)2027 Tax Rate : f(EBT)2028 Tax Rate : f(EBT)2029 Tax Rate : f(EBT)2030 Tax Rate : f(EBT)2031 Tax Rate : f(EBT)2032 21.000% 2.100% 21.843% 22.227% 21.040% 21.069% 16.987% 21.929% 22.826% 20.053% 17.735% 20.979% 24.416% Taxes: 29.19% ‐480 ‐393 514 694 850 214 183 162 119 ‐272 1 Tax Payable Tax Payable Tax Payable Tax Payable Tax Payable Tax Payable Tax Payable Tax Payable Tax Payable Tax Payable Tax Payable NET EARNINGS: 2.46% 1,717 1,374 ‐1,928 20 138 3,081 202 683 828 933 ‐2 D&A Add‐Back: 15.82% 4,223 4,195 4,310 4,268 4,463 4,439 4,052 4,202 3,480 3,790 3,902 Capital Expenditures : f(Revenue)2022 Capital Expenditures : f(Revenue)2023 Capital Expenditures : f(Revenue)2024 Capital Expenditures : f(Revenue)2025 Capital Expenditures : f(Revenue)2026 Capital Expenditures : f(Revenue)2027 Capital Expenditures : f(Revenue)2028 Capital Expenditures : f(Revenue)2029 Capital Expenditures : f(Revenue)2030 Capital Expenditures : f(Revenue)2031 Capital Expenditures : f(Revenue)2032 8.079% 0.808% 10.405% 7.157% 8.311% 8.393% 8.589% 9.343% 8.120% 8.880% 6.539% 8.420% 9.039% CAP EX: 8.47% ‐2,710 ‐1,864 ‐2,164 ‐2,186 ‐2,237 ‐2,433 ‐2,115 ‐2,313 ‐1,703 ‐2,193 ‐2,354 Δ  Working Capital : f(Revenue)2022 Δ  Working Capital : f(Revenue)2023 Δ  Working Capital : f(Revenue)2024 Δ  Working Capital : f(Revenue)2025 Δ  Working Capital : f(Revenue)2026 Δ  Working Capital : f(Revenue)2027 Δ  Working Capital : f(Revenue)2028 Δ  Working Capital : f(Revenue)2029 Δ  Working Capital : f(Revenue)2030 Δ  Working Capital : f(Revenue)2031 Δ  Working Capital : f(Revenue)2032 0.000% 0.000% 0.000% 0.000% 0.000% 0.000% 0.000% 0.000% 0.000% 0.000% 0.000% 0.000% 0.000% Δ WRK CAP: 0.00% 0 0 0 0 0 0 0 0 0 0 0 Equity Minority Interest : f(Revenue)2022 Equity Minority Interest : f(Revenue)2023 Equity Minority Interest : f(Revenue)2024 Equity Minority Interest : f(Revenue)2025 Equity Minority Interest : f(Revenue)2026 Equity Minority Interest : f(Revenue)2027 Equity Minority Interest : f(Revenue)2028 Equity Minority Interest : f(Revenue)2029 Equity Minority Interest : f(Revenue)2030 Equity Minority Interest : f(Revenue)2031 Equity Minority Interest : f(Revenue)2032 0.000% 0.000% 0.000% 0.000% 0.000% 0.000% 0.000% 0.000% 0.000% 0.000% 0.000% 0.000% 0.000% EARN AFFL: 0.00% 0 0 0 0 0 0 0 0 0 0 0 ‐45,227 LESS CURRENT DEBT AND OTHER LONG-TERM LIABILITIES T₀ (Adjusted for Carrying Costs ) 0 LESS PREFERRED AT PAR T₀ 3,445 EXCESS CASH & SHORT-TERM SECURITIES T₀ GROWTH 2.500% DCF analysis will deduct the total value of liabilities from the firm's cash position. PERPETUITY VALUE FCF to Equity 3,231 3,705 217 2,101 2,364 5,086 2,139 2,572 2,606 2,529 1,546 60,267 WACC FOR SIMULATION 5.130% 0.103% To assess liquidity at T₀, DCF analysis will deduct Balance Sheet Liabilities from Cash + Short‐term securities. 5.039% DCF to the Investors 12,986 DCF analysis will deduct the total value of liabilities from the firm's cash position. KHC: Kraft Heinz Co. | FEIN: 46-2078182: Monte Carlo: Valuation Per Share | $USD 10.579 PER SHARE Beharry, Lyndon Martin W. 2022‐07‐22_KHC_MC‐Equity‐1Million|DCF All Variable_MC 07/22/2022 14:26 | Page 10B of 17
  • 11. Equity Valuation 2022‐07‐22_KHC_MC‐Equity‐1Million Financial Statement Review Type alternative annual growth rates here: KHC: Kraft Heinz Co. | FEIN: 46‐2078182: Monte Carlo: Valuation Per Share |  $USD Mask Monetary Values In 1,000,000 $USD (Except Per Share Values). 1,000,000 $USD Revenue Growth Rate2022 Revenue Growth Rate2023 Revenue Growth Rate2024 Revenue Growth Rate2025 Revenue Growth Rate2026 Revenue Growth Rate2027 Revenue Growth Rate2028 Revenue Growth Rate2029 Revenue Growth Rate2030 Revenue Growth Rate2031 Revenue Growth Rate2032 Projection Base [FY] Year T0  2021 2021 2022 2023 2024 2025 2026 2027 2028 2029 2030 2031 2032 Mean STDEV 0 1 2 3 4 5 6 7 8 9 10 Revenue Growth Rate 2022 00.0% Revenue Growth Rate 2023 00.0% Revenue Growth Rate 2024 00.0% Revenue Growth Rate 2025 00.0% Revenue Growth Rate 2026 00.0% Revenue Growth Rate 2027 00.0% Revenue Growth Rate 2028 00.0% Revenue Growth Rate 2029 00.0% Revenue Growth Rate 2030 00.0% Revenue Growth Rate 2031 00.0% Revenue Growth Rate 2032 00.0% 0.000% 0.000% Random Growth Rate 0.00% 0.00% 0.00% 0.00% 0.00% 0.00% 0.00% 0.00% 0.00% 0.00% 0.00% Sequential Reduction 0.000% Alternate Coefficient of Variability 10.00% 0.00% 0.00% 0.00% 0.00% 0.00% 0.00% 0.00% 0.00% 0.00% 0.00% 0.00% Timet0 Timet+1 Timet+2 Timet+3 Timet+4 Timet+5 Timet+6 Timet+7 Timet+8 Timet+9 Timet+10 Timet+11 Projection TimeT1 26,042 MONTE CARLO REVENUE 26,042 26,042 26,042 26,042 26,042 26,042 26,042 26,042 26,042 26,042 26,042 CoGS : f(Revenue)2022 CoGS : f(Revenue)2023 CoGS : f(Revenue)2024 CoGS : f(Revenue)2025 CoGS : f(Revenue)2026 CoGS : f(Revenue)2027 CoGS : f(Revenue)2028 CoGS : f(Revenue)2029 CoGS : f(Revenue)2030 CoGS : f(Revenue)2031 CoGS : f(Revenue)2032 63.266% 6.327% 69.209% 64.312% 57.547% 64.532% 62.114% 61.800% 62.350% 71.018% 61.739% 68.454% 52.417% CoGS: 63.23% ‐18,023 ‐16,748 ‐14,986 ‐16,805 ‐16,176 ‐16,094 ‐16,237 ‐18,494 ‐16,078 ‐17,827 ‐13,650 Depreciation/Amortization [COGs] : f(Revenue)2022 Depreciation/Amortization [COGs] : f(Revenue)2023 Depreciation/Amortization [COGs] : f(Revenue)2024 Depreciation/Amortization [COGs] : f(Revenue)2025 Depreciation/Amortization [COGs] : f(Revenue)2026 Depreciation/Amortization [COGs] : f(Revenue)2027 Depreciation/Amortization [COGs] : f(Revenue)2028 Depreciation/Amortization [COGs] : f(Revenue)2029 Depreciation/Amortization [COGs] : f(Revenue)2030 Depreciation/Amortization [COGs] : f(Revenue)2031 Depreciation/Amortization [COGs] : f(Revenue)2032 9.221% 0.922% 9.284% 10.122% 9.636% 9.848% 7.522% 8.840% 9.809% 8.246% 10.115% 9.752% 8.524% D&A (Production): 9.25% ‐2,418 ‐2,636 ‐2,509 ‐2,565 ‐1,959 ‐2,302 ‐2,554 ‐2,147 ‐2,634 ‐2,540 ‐2,220 GROSS MARGIN: 27.53% 5,601 6,658 8,546 6,672 7,907 7,646 7,251 5,400 7,330 5,676 10,172 SGA (Only) : f(Revenue)2022 SGA (Only) : f(Revenue)2023 SGA (Only) : f(Revenue)2024 SGA (Only) : f(Revenue)2025 SGA (Only) : f(Revenue)2026 SGA (Only) : f(Revenue)2027 SGA (Only) : f(Revenue)2028 SGA (Only) : f(Revenue)2029 SGA (Only) : f(Revenue)2030 SGA (Only) : f(Revenue)2031 SGA (Only) : f(Revenue)2032 16.383% 1.638% Administrative Costs: 14.726% 17.172% 16.847% 15.081% 15.246% 16.760% 14.575% 15.960% 18.479% 13.607% 17.097% SGA: 14.73% ‐3,835 ‐3,835 ‐3,835 ‐3,835 ‐3,835 ‐3,835 ‐3,835 ‐3,835 ‐3,835 ‐3,835 ‐3,835 R&D : f(Revenue)2022 R&D : f(Revenue)2023 R&D : f(Revenue)2024 R&D : f(Revenue)2025 R&D : f(Revenue)2026 R&D : f(Revenue)2027 R&D : f(Revenue)2028 R&D : f(Revenue)2029 R&D : f(Revenue)2030 R&D : f(Revenue)2031 R&D : f(Revenue)2032 0.000% 0.000% 0.000% 0.000% 0.000% 0.000% 0.000% 0.000% 0.000% 0.000% 0.000% 0.000% 0.000% R & D: 0.00% 0 0 0 0 0 0 0 0 0 0 0 Depreciation/Amortization [SGA] : f(Revenue)2022 Depreciation/Amortization [SGA] : f(Revenue)2023 Depreciation/Amortization [SGA] : f(Revenue)2024 Depreciation/Amortization [SGA] : f(Revenue)2025 Depreciation/Amortization [SGA] : f(Revenue)2026 Depreciation/Amortization [SGA] : f(Revenue)2027 Depreciation/Amortization [SGA] : f(Revenue)2028 Depreciation/Amortization [SGA] : f(Revenue)2029 Depreciation/Amortization [SGA] : f(Revenue)2030 Depreciation/Amortization [SGA] : f(Revenue)2031 Depreciation/Amortization [SGA] : f(Revenue)2032 6.179% 0.618% 6.835% 5.809% 5.891% 5.537% 5.660% 6.148% 6.813% 5.523% 7.782% 6.204% 5.972% D & A [SGA]: 6.20% ‐1,780 ‐1,513 ‐1,534 ‐1,442 ‐1,474 ‐1,601 ‐1,774 ‐1,438 ‐2,027 ‐1,616 ‐1,555 Admin Expenses: 20.92% ‐5,615 ‐5,348 ‐5,369 ‐5,277 ‐5,309 ‐5,436 ‐5,609 ‐5,273 ‐5,862 ‐5,451 ‐5,390 Other Expense (Income) : f(Revenue)2022 Other Expense (Income) : f(Revenue)2023 Other Expense (Income) : f(Revenue)2024 Other Expense (Income) : f(Revenue)2025 Other Expense (Income) : f(Revenue)2026 Other Expense (Income) : f(Revenue)2027 Other Expense (Income) : f(Revenue)2028 Other Expense (Income) : f(Revenue)2029 Other Expense (Income) : f(Revenue)2030 Other Expense (Income) : f(Revenue)2031 Other Expense (Income) : f(Revenue)2032 -0.570% 0.057% ‐0.593% ‐0.532% ‐0.568% ‐0.454% ‐0.610% ‐0.667% ‐0.458% ‐0.598% ‐0.561% ‐0.548% ‐0.498% Other: ‐0.55% 154 138 148 118 159 174 119 156 146 143 130 EBIT: 7.16% 140 1,448 3,325 1,513 2,757 2,383 1,760 283 1,614 368 4,911 Interest Expense (Income) : f(Revenue)2022 Interest Expense (Income) : f(Revenue)2023 Interest Expense (Income) : f(Revenue)2024 Interest Expense (Income) : f(Revenue)2025 Interest Expense (Income) : f(Revenue)2026 Interest Expense (Income) : f(Revenue)2027 Interest Expense (Income) : f(Revenue)2028 Interest Expense (Income) : f(Revenue)2029 Interest Expense (Income) : f(Revenue)2030 Interest Expense (Income) : f(Revenue)2031 Interest Expense (Income) : f(Revenue)2032 1.250% 0.125% 1.196% 1.257% 1.195% 1.435% 1.068% 1.469% 1.168% 1.110% 1.323% 1.250% 1.463% Interest Expense: 1.27% ‐312 ‐327 ‐311 ‐374 ‐278 ‐383 ‐304 ‐289 ‐345 ‐325 ‐381 EBT: 5.89% ‐171 1,121 3,014 1,140 2,479 2,001 1,456 ‐7 1,270 42 4,530 Tax Rate : f(EBT)2022 Tax Rate : f(EBT)2023 Tax Rate : f(EBT)2024 Tax Rate : f(EBT)2025 Tax Rate : f(EBT)2026 Tax Rate : f(EBT)2027 Tax Rate : f(EBT)2028 Tax Rate : f(EBT)2029 Tax Rate : f(EBT)2030 Tax Rate : f(EBT)2031 Tax Rate : f(EBT)2032 21.000% 2.100% 22.894% 21.531% 23.779% 18.175% 20.340% 22.585% 20.941% 18.484% 20.297% 23.970% 23.073% Taxes: 21.04% 0 ‐205 ‐717 ‐207 ‐504 ‐452 ‐305 1 ‐108 ‐10 ‐1,045 Forward Credit Tax Payable Tax Payable Tax Payable Tax Payable Tax Payable Tax Payable Tax Payable Tax Payable Tax Payable Tax Payable NET EARNINGS: 4.65% ‐171 917 2,297 932 1,975 1,549 1,151 ‐5 1,162 32 3,485 D&A Add‐Back: 15.44% 4,198 4,149 4,044 4,007 3,433 3,903 4,329 3,586 4,661 4,155 3,775 Capital Expenditures : f(Revenue)2022 Capital Expenditures : f(Revenue)2023 Capital Expenditures : f(Revenue)2024 Capital Expenditures : f(Revenue)2025 Capital Expenditures : f(Revenue)2026 Capital Expenditures : f(Revenue)2027 Capital Expenditures : f(Revenue)2028 Capital Expenditures : f(Revenue)2029 Capital Expenditures : f(Revenue)2030 Capital Expenditures : f(Revenue)2031 Capital Expenditures : f(Revenue)2032 8.079% 0.808% 7.580% 8.183% 7.311% 6.796% 8.323% 8.275% 7.904% 8.394% 8.792% 9.115% 8.847% CAP EX: 8.14% ‐1,974 ‐2,131 ‐1,904 ‐1,770 ‐2,168 ‐2,155 ‐2,058 ‐2,186 ‐2,289 ‐2,374 ‐2,304 Δ  Working Capital : f(Revenue)2022 Δ  Working Capital : f(Revenue)2023 Δ  Working Capital : f(Revenue)2024 Δ  Working Capital : f(Revenue)2025 Δ  Working Capital : f(Revenue)2026 Δ  Working Capital : f(Revenue)2027 Δ  Working Capital : f(Revenue)2028 Δ  Working Capital : f(Revenue)2029 Δ  Working Capital : f(Revenue)2030 Δ  Working Capital : f(Revenue)2031 Δ  Working Capital : f(Revenue)2032 0.000% 0.000% 0.000% 0.000% 0.000% 0.000% 0.000% 0.000% 0.000% 0.000% 0.000% 0.000% 0.000% Δ WRK CAP: 0.00% 0 0 0 0 0 0 0 0 0 0 0 Equity Minority Interest : f(Revenue)2022 Equity Minority Interest : f(Revenue)2023 Equity Minority Interest : f(Revenue)2024 Equity Minority Interest : f(Revenue)2025 Equity Minority Interest : f(Revenue)2026 Equity Minority Interest : f(Revenue)2027 Equity Minority Interest : f(Revenue)2028 Equity Minority Interest : f(Revenue)2029 Equity Minority Interest : f(Revenue)2030 Equity Minority Interest : f(Revenue)2031 Equity Minority Interest : f(Revenue)2032 0.000% 0.000% 0.000% 0.000% 0.000% 0.000% 0.000% 0.000% 0.000% 0.000% 0.000% 0.000% 0.000% EARN AFFL: 0.00% 0 0 0 0 0 0 0 0 0 0 0 ‐45,227 LESS CURRENT DEBT AND OTHER LONG-TERM LIABILITIES T₀ (Adjusted for Carrying Costs ) 0 LESS PREFERRED AT PAR T₀ 3,445 EXCESS CASH & SHORT-TERM SECURITIES T₀ GROWTH 2.500% DCF analysis will deduct the total value of liabilities from the firm's cash position. PERPETUITY VALUE FCF to Equity 2,052 2,934 4,437 3,169 3,240 3,297 3,422 1,394 3,533 1,813 4,956 193,177 WACC FOR SIMULATION 5.130% 0.103% To assess liquidity at T₀, DCF analysis will deduct Balance Sheet Liabilities from Cash + Short‐term securities. 5.140% DCF to the Investors 89,605 DCF analysis will deduct the total value of liabilities from the firm's cash position. KHC: Kraft Heinz Co. | FEIN: 46-2078182: Monte Carlo: Valuation Per Share | $USD 72.998 PER SHARE Beharry, Lyndon Martin W. 2022‐07‐22_KHC_MC‐Equity‐1Million|DCF All Variable_MC 07/22/2022 14:26 | Page 10C of 17
  • 12. Equity Valuation 2022‐07‐22_KHC_MC‐Equity‐1Million Financial Statement Review Type alternative annual growth rates here: KHC: Kraft Heinz Co. | FEIN: 46‐2078182: Monte Carlo: Valuation Per Share |  $USD Mask Monetary Values In 1,000,000 $USD (Except Per Share Values). 1,000,000 $USD Revenue Growth Rate2022 Revenue Growth Rate2023 Revenue Growth Rate2024 Revenue Growth Rate2025 Revenue Growth Rate2026 Revenue Growth Rate2027 Revenue Growth Rate2028 Revenue Growth Rate2029 Revenue Growth Rate2030 Revenue Growth Rate2031 Revenue Growth Rate2032 Projection Base [FY] Year T0  2021 2021 2022 2023 2024 2025 2026 2027 2028 2029 2030 2031 2032 Mean STDEV 0 1 2 3 4 5 6 7 8 9 10 Revenue Growth Rate 2022 00.0% Revenue Growth Rate 2023 00.0% Revenue Growth Rate 2024 00.0% Revenue Growth Rate 2025 00.0% Revenue Growth Rate 2026 00.0% Revenue Growth Rate 2027 00.0% Revenue Growth Rate 2028 00.0% Revenue Growth Rate 2029 00.0% Revenue Growth Rate 2030 00.0% Revenue Growth Rate 2031 00.0% Revenue Growth Rate 2032 00.0% 0.000% 0.000% Random Growth Rate 0.00% 0.00% 0.00% 0.00% 0.00% 0.00% 0.00% 0.00% 0.00% 0.00% 0.00% Sequential Reduction 0.000% Alternate Coefficient of Variability 10.00% 0.00% 0.00% 0.00% 0.00% 0.00% 0.00% 0.00% 0.00% 0.00% 0.00% 0.00% Timet0 Timet+1 Timet+2 Timet+3 Timet+4 Timet+5 Timet+6 Timet+7 Timet+8 Timet+9 Timet+10 Timet+11 Projection TimeT1 26,042 MONTE CARLO REVENUE 26,042 26,042 26,042 26,042 26,042 26,042 26,042 26,042 26,042 26,042 26,042 CoGS : f(Revenue)2022 CoGS : f(Revenue)2023 CoGS : f(Revenue)2024 CoGS : f(Revenue)2025 CoGS : f(Revenue)2026 CoGS : f(Revenue)2027 CoGS : f(Revenue)2028 CoGS : f(Revenue)2029 CoGS : f(Revenue)2030 CoGS : f(Revenue)2031 CoGS : f(Revenue)2032 63.266% 6.327% 57.659% 82.042% 69.062% 69.958% 61.162% 56.368% 58.168% 65.497% 76.855% 71.271% 65.274% CoGS: 66.67% ‐15,016 ‐21,365 ‐17,985 ‐18,218 ‐15,928 ‐14,679 ‐15,148 ‐17,057 ‐20,015 ‐18,560 ‐16,999 Depreciation/Amortization [COGs] : f(Revenue)2022 Depreciation/Amortization [COGs] : f(Revenue)2023 Depreciation/Amortization [COGs] : f(Revenue)2024 Depreciation/Amortization [COGs] : f(Revenue)2025 Depreciation/Amortization [COGs] : f(Revenue)2026 Depreciation/Amortization [COGs] : f(Revenue)2027 Depreciation/Amortization [COGs] : f(Revenue)2028 Depreciation/Amortization [COGs] : f(Revenue)2029 Depreciation/Amortization [COGs] : f(Revenue)2030 Depreciation/Amortization [COGs] : f(Revenue)2031 Depreciation/Amortization [COGs] : f(Revenue)2032 9.221% 0.922% 8.514% 8.327% 8.148% 9.338% 10.132% 7.242% 9.358% 8.550% 8.333% 8.377% 7.946% D&A (Production): 8.57% ‐2,217 ‐2,169 ‐2,122 ‐2,432 ‐2,638 ‐1,886 ‐2,437 ‐2,227 ‐2,170 ‐2,182 ‐2,069 GROSS MARGIN: 24.77% 8,809 2,508 5,935 5,392 7,476 9,477 8,457 6,759 3,857 5,300 6,974 SGA (Only) : f(Revenue)2022 SGA (Only) : f(Revenue)2023 SGA (Only) : f(Revenue)2024 SGA (Only) : f(Revenue)2025 SGA (Only) : f(Revenue)2026 SGA (Only) : f(Revenue)2027 SGA (Only) : f(Revenue)2028 SGA (Only) : f(Revenue)2029 SGA (Only) : f(Revenue)2030 SGA (Only) : f(Revenue)2031 SGA (Only) : f(Revenue)2032 16.383% 1.638% Administrative Costs: 15.383% 17.603% 17.565% 17.104% 14.669% 18.280% 15.422% 17.115% 15.456% 19.778% 20.878% SGA: 15.38% ‐4,006 ‐4,006 ‐4,006 ‐4,006 ‐4,006 ‐4,006 ‐4,006 ‐4,006 ‐4,006 ‐4,006 ‐4,006 R&D : f(Revenue)2022 R&D : f(Revenue)2023 R&D : f(Revenue)2024 R&D : f(Revenue)2025 R&D : f(Revenue)2026 R&D : f(Revenue)2027 R&D : f(Revenue)2028 R&D : f(Revenue)2029 R&D : f(Revenue)2030 R&D : f(Revenue)2031 R&D : f(Revenue)2032 0.000% 0.000% 0.000% 0.000% 0.000% 0.000% 0.000% 0.000% 0.000% 0.000% 0.000% 0.000% 0.000% R & D: 0.00% 0 0 0 0 0 0 0 0 0 0 0 Depreciation/Amortization [SGA] : f(Revenue)2022 Depreciation/Amortization [SGA] : f(Revenue)2023 Depreciation/Amortization [SGA] : f(Revenue)2024 Depreciation/Amortization [SGA] : f(Revenue)2025 Depreciation/Amortization [SGA] : f(Revenue)2026 Depreciation/Amortization [SGA] : f(Revenue)2027 Depreciation/Amortization [SGA] : f(Revenue)2028 Depreciation/Amortization [SGA] : f(Revenue)2029 Depreciation/Amortization [SGA] : f(Revenue)2030 Depreciation/Amortization [SGA] : f(Revenue)2031 Depreciation/Amortization [SGA] : f(Revenue)2032 6.179% 0.618% 5.652% 6.196% 5.709% 7.543% 6.117% 4.982% 7.076% 6.287% 5.619% 6.716% 5.989% D & A [SGA]: 6.17% ‐1,472 ‐1,614 ‐1,487 ‐1,964 ‐1,593 ‐1,297 ‐1,843 ‐1,637 ‐1,463 ‐1,749 ‐1,560 Admin Expenses: 21.55% ‐5,478 ‐5,620 ‐5,493 ‐5,970 ‐5,599 ‐5,303 ‐5,849 ‐5,643 ‐5,469 ‐5,755 ‐5,566 Other Expense (Income) : f(Revenue)2022 Other Expense (Income) : f(Revenue)2023 Other Expense (Income) : f(Revenue)2024 Other Expense (Income) : f(Revenue)2025 Other Expense (Income) : f(Revenue)2026 Other Expense (Income) : f(Revenue)2027 Other Expense (Income) : f(Revenue)2028 Other Expense (Income) : f(Revenue)2029 Other Expense (Income) : f(Revenue)2030 Other Expense (Income) : f(Revenue)2031 Other Expense (Income) : f(Revenue)2032 -0.570% 0.057% ‐0.569% ‐0.509% ‐0.552% ‐0.446% ‐0.584% ‐0.627% ‐0.512% ‐0.549% ‐0.644% ‐0.621% ‐0.491% Other: ‐0.56% 148 133 144 116 152 163 133 143 168 162 128 EBIT: 3.77% 3,480 ‐2,979 586 ‐462 2,029 4,337 2,741 1,259 ‐1,444 ‐293 1,536 Interest Expense (Income) : f(Revenue)2022 Interest Expense (Income) : f(Revenue)2023 Interest Expense (Income) : f(Revenue)2024 Interest Expense (Income) : f(Revenue)2025 Interest Expense (Income) : f(Revenue)2026 Interest Expense (Income) : f(Revenue)2027 Interest Expense (Income) : f(Revenue)2028 Interest Expense (Income) : f(Revenue)2029 Interest Expense (Income) : f(Revenue)2030 Interest Expense (Income) : f(Revenue)2031 Interest Expense (Income) : f(Revenue)2032 1.250% 0.125% 1.306% 1.235% 1.392% 1.061% 1.278% 1.297% 1.324% 1.056% 1.175% 1.300% 1.282% Interest Expense: 1.25% ‐340 ‐322 ‐362 ‐276 ‐333 ‐338 ‐345 ‐275 ‐306 ‐339 ‐334 EBT: 2.52% 3,140 ‐3,300 224 ‐739 1,696 3,999 2,397 984 ‐1,750 ‐632 1,202 Tax Rate : f(EBT)2022 Tax Rate : f(EBT)2023 Tax Rate : f(EBT)2024 Tax Rate : f(EBT)2025 Tax Rate : f(EBT)2026 Tax Rate : f(EBT)2027 Tax Rate : f(EBT)2028 Tax Rate : f(EBT)2029 Tax Rate : f(EBT)2030 Tax Rate : f(EBT)2031 Tax Rate : f(EBT)2032 21.000% 2.100% 21.122% 21.517% 23.124% 20.811% 20.555% 21.725% 20.521% 19.475% 19.695% 19.466% 22.722% Taxes: 15.49% ‐663 710 649 0 453 ‐427 ‐492 ‐192 345 602 133 Tax Payable Forward Credit Tax Payable Forward Credit Tax Payable Tax Payable Tax Payable Tax Payable Tax Payable Tax Payable Tax Payable NET EARNINGS: 2.91% 2,476 ‐2,590 872 ‐739 2,149 3,572 1,905 792 ‐1,405 ‐30 1,336 D&A Add‐Back: 14.74% 3,689 3,782 3,608 4,396 4,231 3,183 4,280 3,864 3,633 3,931 3,629 Capital Expenditures : f(Revenue)2022 Capital Expenditures : f(Revenue)2023 Capital Expenditures : f(Revenue)2024 Capital Expenditures : f(Revenue)2025 Capital Expenditures : f(Revenue)2026 Capital Expenditures : f(Revenue)2027 Capital Expenditures : f(Revenue)2028 Capital Expenditures : f(Revenue)2029 Capital Expenditures : f(Revenue)2030 Capital Expenditures : f(Revenue)2031 Capital Expenditures : f(Revenue)2032 8.079% 0.808% 8.763% 8.229% 9.242% 7.401% 6.450% 8.274% 9.174% 7.532% 8.247% 7.881% 7.916% CAP EX: 8.10% ‐2,282 ‐2,143 ‐2,407 ‐1,927 ‐1,680 ‐2,155 ‐2,389 ‐1,962 ‐2,148 ‐2,052 ‐2,061 Δ  Working Capital : f(Revenue)2022 Δ  Working Capital : f(Revenue)2023 Δ  Working Capital : f(Revenue)2024 Δ  Working Capital : f(Revenue)2025 Δ  Working Capital : f(Revenue)2026 Δ  Working Capital : f(Revenue)2027 Δ  Working Capital : f(Revenue)2028 Δ  Working Capital : f(Revenue)2029 Δ  Working Capital : f(Revenue)2030 Δ  Working Capital : f(Revenue)2031 Δ  Working Capital : f(Revenue)2032 0.000% 0.000% 0.000% 0.000% 0.000% 0.000% 0.000% 0.000% 0.000% 0.000% 0.000% 0.000% 0.000% Δ WRK CAP: 0.00% 0 0 0 0 0 0 0 0 0 0 0 Equity Minority Interest : f(Revenue)2022 Equity Minority Interest : f(Revenue)2023 Equity Minority Interest : f(Revenue)2024 Equity Minority Interest : f(Revenue)2025 Equity Minority Interest : f(Revenue)2026 Equity Minority Interest : f(Revenue)2027 Equity Minority Interest : f(Revenue)2028 Equity Minority Interest : f(Revenue)2029 Equity Minority Interest : f(Revenue)2030 Equity Minority Interest : f(Revenue)2031 Equity Minority Interest : f(Revenue)2032 0.000% 0.000% 0.000% 0.000% 0.000% 0.000% 0.000% 0.000% 0.000% 0.000% 0.000% 0.000% 0.000% EARN AFFL: 0.00% 0 0 0 0 0 0 0 0 0 0 0 ‐45,227 LESS CURRENT DEBT AND OTHER LONG-TERM LIABILITIES T₀ (Adjusted for Carrying Costs ) 0 LESS PREFERRED AT PAR T₀ 3,445 EXCESS CASH & SHORT-TERM SECURITIES T₀ GROWTH 2.500% DCF analysis will deduct the total value of liabilities from the firm's cash position. PERPETUITY VALUE FCF to Equity 3,883 ‐951 2,074 1,730 4,701 4,600 3,796 2,694 80 1,849 2,903 113,171 WACC FOR SIMULATION 5.130% 0.103% To assess liquidity at T₀, DCF analysis will deduct Balance Sheet Liabilities from Cash + Short‐term securities. 5.070% DCF to the Investors 41,228 DCF analysis will deduct the total value of liabilities from the firm's cash position. KHC: Kraft Heinz Co. | FEIN: 46-2078182: Monte Carlo: Valuation Per Share | $USD 33.587 PER SHARE Beharry, Lyndon Martin W. 2022‐07‐22_KHC_MC‐Equity‐1Million|DCF All Variable_MC 07/22/2022 14:27 | Page 10D of 17
  • 13. Equity Valuation 2022‐07‐22_KHC_MC‐Equity‐1Million Financial Statement Review Type alternative annual growth rates here: KHC: Kraft Heinz Co. | FEIN: 46‐2078182: Monte Carlo: Valuation Per Share |  $USD Mask Monetary Values In 1,000,000 $USD (Except Per Share Values). 1,000,000 $USD Revenue Growth Rate2022 Revenue Growth Rate2023 Revenue Growth Rate2024 Revenue Growth Rate2025 Revenue Growth Rate2026 Revenue Growth Rate2027 Revenue Growth Rate2028 Revenue Growth Rate2029 Revenue Growth Rate2030 Revenue Growth Rate2031 Revenue Growth Rate2032 Projection Base [FY] Year T0  2021 2021 2022 2023 2024 2025 2026 2027 2028 2029 2030 2031 2032 Mean STDEV 0 1 2 3 4 5 6 7 8 9 10 Revenue Growth Rate 2022 00.0% Revenue Growth Rate 2023 00.0% Revenue Growth Rate 2024 00.0% Revenue Growth Rate 2025 00.0% Revenue Growth Rate 2026 00.0% Revenue Growth Rate 2027 00.0% Revenue Growth Rate 2028 00.0% Revenue Growth Rate 2029 00.0% Revenue Growth Rate 2030 00.0% Revenue Growth Rate 2031 00.0% Revenue Growth Rate 2032 00.0% 0.000% 0.000% Random Growth Rate 0.00% 0.00% 0.00% 0.00% 0.00% 0.00% 0.00% 0.00% 0.00% 0.00% 0.00% Sequential Reduction 0.000% Alternate Coefficient of Variability 10.00% 0.00% 0.00% 0.00% 0.00% 0.00% 0.00% 0.00% 0.00% 0.00% 0.00% 0.00% Timet0 Timet+1 Timet+2 Timet+3 Timet+4 Timet+5 Timet+6 Timet+7 Timet+8 Timet+9 Timet+10 Timet+11 Projection TimeT1 26,042 MONTE CARLO REVENUE 26,042 26,042 26,042 26,042 26,042 26,042 26,042 26,042 26,042 26,042 26,042 CoGS : f(Revenue)2022 CoGS : f(Revenue)2023 CoGS : f(Revenue)2024 CoGS : f(Revenue)2025 CoGS : f(Revenue)2026 CoGS : f(Revenue)2027 CoGS : f(Revenue)2028 CoGS : f(Revenue)2029 CoGS : f(Revenue)2030 CoGS : f(Revenue)2031 CoGS : f(Revenue)2032 63.266% 6.327% 59.100% 63.084% 66.711% 63.948% 55.796% 65.027% 52.289% 57.695% 56.189% 54.535% 73.020% CoGS: 60.67% ‐15,391 ‐16,428 ‐17,373 ‐16,653 ‐14,530 ‐16,934 ‐13,617 ‐15,025 ‐14,633 ‐14,202 ‐19,016 Depreciation/Amortization [COGs] : f(Revenue)2022 Depreciation/Amortization [COGs] : f(Revenue)2023 Depreciation/Amortization [COGs] : f(Revenue)2024 Depreciation/Amortization [COGs] : f(Revenue)2025 Depreciation/Amortization [COGs] : f(Revenue)2026 Depreciation/Amortization [COGs] : f(Revenue)2027 Depreciation/Amortization [COGs] : f(Revenue)2028 Depreciation/Amortization [COGs] : f(Revenue)2029 Depreciation/Amortization [COGs] : f(Revenue)2030 Depreciation/Amortization [COGs] : f(Revenue)2031 Depreciation/Amortization [COGs] : f(Revenue)2032 9.221% 0.922% 9.383% 10.467% 9.795% 9.701% 10.215% 8.636% 10.530% 8.255% 7.498% 8.692% 8.833% D&A (Production): 9.27% ‐2,443 ‐2,726 ‐2,551 ‐2,526 ‐2,660 ‐2,249 ‐2,742 ‐2,150 ‐1,953 ‐2,264 ‐2,300 GROSS MARGIN: 30.05% 8,208 6,888 6,118 6,862 8,851 6,859 9,683 8,867 9,457 9,577 4,726 SGA (Only) : f(Revenue)2022 SGA (Only) : f(Revenue)2023 SGA (Only) : f(Revenue)2024 SGA (Only) : f(Revenue)2025 SGA (Only) : f(Revenue)2026 SGA (Only) : f(Revenue)2027 SGA (Only) : f(Revenue)2028 SGA (Only) : f(Revenue)2029 SGA (Only) : f(Revenue)2030 SGA (Only) : f(Revenue)2031 SGA (Only) : f(Revenue)2032 16.383% 1.638% Administrative Costs: 15.228% 20.412% 14.219% 17.003% 16.445% 15.741% 15.934% 15.309% 14.578% 17.488% 18.738% SGA: 15.23% ‐3,966 ‐3,966 ‐3,966 ‐3,966 ‐3,966 ‐3,966 ‐3,966 ‐3,966 ‐3,966 ‐3,966 ‐3,966 R&D : f(Revenue)2022 R&D : f(Revenue)2023 R&D : f(Revenue)2024 R&D : f(Revenue)2025 R&D : f(Revenue)2026 R&D : f(Revenue)2027 R&D : f(Revenue)2028 R&D : f(Revenue)2029 R&D : f(Revenue)2030 R&D : f(Revenue)2031 R&D : f(Revenue)2032 0.000% 0.000% 0.000% 0.000% 0.000% 0.000% 0.000% 0.000% 0.000% 0.000% 0.000% 0.000% 0.000% R & D: 0.00% 0 0 0 0 0 0 0 0 0 0 0 Depreciation/Amortization [SGA] : f(Revenue)2022 Depreciation/Amortization [SGA] : f(Revenue)2023 Depreciation/Amortization [SGA] : f(Revenue)2024 Depreciation/Amortization [SGA] : f(Revenue)2025 Depreciation/Amortization [SGA] : f(Revenue)2026 Depreciation/Amortization [SGA] : f(Revenue)2027 Depreciation/Amortization [SGA] : f(Revenue)2028 Depreciation/Amortization [SGA] : f(Revenue)2029 Depreciation/Amortization [SGA] : f(Revenue)2030 Depreciation/Amortization [SGA] : f(Revenue)2031 Depreciation/Amortization [SGA] : f(Revenue)2032 6.179% 0.618% 6.307% 6.052% 5.540% 5.314% 6.252% 5.536% 5.398% 5.582% 7.281% 6.801% 6.728% D & A [SGA]: 6.07% ‐1,642 ‐1,576 ‐1,443 ‐1,384 ‐1,628 ‐1,442 ‐1,406 ‐1,454 ‐1,896 ‐1,771 ‐1,752 Admin Expenses: 21.30% ‐5,608 ‐5,542 ‐5,408 ‐5,349 ‐5,594 ‐5,407 ‐5,371 ‐5,419 ‐5,862 ‐5,737 ‐5,718 Other Expense (Income) : f(Revenue)2022 Other Expense (Income) : f(Revenue)2023 Other Expense (Income) : f(Revenue)2024 Other Expense (Income) : f(Revenue)2025 Other Expense (Income) : f(Revenue)2026 Other Expense (Income) : f(Revenue)2027 Other Expense (Income) : f(Revenue)2028 Other Expense (Income) : f(Revenue)2029 Other Expense (Income) : f(Revenue)2030 Other Expense (Income) : f(Revenue)2031 Other Expense (Income) : f(Revenue)2032 -0.570% 0.057% ‐0.614% ‐0.564% ‐0.470% ‐0.512% ‐0.588% ‐0.612% ‐0.594% ‐0.557% ‐0.631% ‐0.553% ‐0.570% Other: ‐0.57% 160 147 122 133 153 159 155 145 164 144 148 EBIT: 9.32% 2,760 1,493 832 1,646 3,411 1,611 4,466 3,593 3,759 3,984 ‐844 Interest Expense (Income) : f(Revenue)2022 Interest Expense (Income) : f(Revenue)2023 Interest Expense (Income) : f(Revenue)2024 Interest Expense (Income) : f(Revenue)2025 Interest Expense (Income) : f(Revenue)2026 Interest Expense (Income) : f(Revenue)2027 Interest Expense (Income) : f(Revenue)2028 Interest Expense (Income) : f(Revenue)2029 Interest Expense (Income) : f(Revenue)2030 Interest Expense (Income) : f(Revenue)2031 Interest Expense (Income) : f(Revenue)2032 1.250% 0.125% 1.314% 1.201% 1.323% 1.489% 1.183% 1.132% 1.301% 1.404% 1.295% 1.310% 1.276% Interest Expense: 1.29% ‐342 ‐313 ‐344 ‐388 ‐308 ‐295 ‐339 ‐366 ‐337 ‐341 ‐332 EBT: 8.03% 2,418 1,180 488 1,259 3,103 1,316 4,127 3,228 3,422 3,643 ‐1,176 Tax Rate : f(EBT)2022 Tax Rate : f(EBT)2023 Tax Rate : f(EBT)2024 Tax Rate : f(EBT)2025 Tax Rate : f(EBT)2026 Tax Rate : f(EBT)2027 Tax Rate : f(EBT)2028 Tax Rate : f(EBT)2029 Tax Rate : f(EBT)2030 Tax Rate : f(EBT)2031 Tax Rate : f(EBT)2032 21.000% 2.100% 21.320% 21.794% 21.589% 23.261% 23.400% 21.828% 18.027% 21.094% 23.358% 23.680% 21.770% Taxes: 21.80% ‐515 ‐257 ‐105 ‐293 ‐726 ‐287 ‐744 ‐681 ‐799 ‐863 256 Tax Payable Tax Payable Tax Payable Tax Payable Tax Payable Tax Payable Tax Payable Tax Payable Tax Payable Tax Payable Tax Payable NET EARNINGS: 6.28% 1,902 923 383 966 2,377 1,029 3,383 2,547 2,623 2,780 ‐920 D&A Add‐Back: 15.35% 4,086 4,302 3,993 3,910 4,288 3,691 4,148 3,603 3,849 4,035 4,052 Capital Expenditures : f(Revenue)2022 Capital Expenditures : f(Revenue)2023 Capital Expenditures : f(Revenue)2024 Capital Expenditures : f(Revenue)2025 Capital Expenditures : f(Revenue)2026 Capital Expenditures : f(Revenue)2027 Capital Expenditures : f(Revenue)2028 Capital Expenditures : f(Revenue)2029 Capital Expenditures : f(Revenue)2030 Capital Expenditures : f(Revenue)2031 Capital Expenditures : f(Revenue)2032 8.079% 0.808% 7.698% 9.431% 7.515% 5.597% 7.706% 9.347% 7.971% 7.163% 8.481% 7.744% 8.117% CAP EX: 7.89% ‐2,005 ‐2,456 ‐1,957 ‐1,458 ‐2,007 ‐2,434 ‐2,076 ‐1,865 ‐2,209 ‐2,017 ‐2,114 Δ  Working Capital : f(Revenue)2022 Δ  Working Capital : f(Revenue)2023 Δ  Working Capital : f(Revenue)2024 Δ  Working Capital : f(Revenue)2025 Δ  Working Capital : f(Revenue)2026 Δ  Working Capital : f(Revenue)2027 Δ  Working Capital : f(Revenue)2028 Δ  Working Capital : f(Revenue)2029 Δ  Working Capital : f(Revenue)2030 Δ  Working Capital : f(Revenue)2031 Δ  Working Capital : f(Revenue)2032 0.000% 0.000% 0.000% 0.000% 0.000% 0.000% 0.000% 0.000% 0.000% 0.000% 0.000% 0.000% 0.000% Δ WRK CAP: 0.00% 0 0 0 0 0 0 0 0 0 0 0 Equity Minority Interest : f(Revenue)2022 Equity Minority Interest : f(Revenue)2023 Equity Minority Interest : f(Revenue)2024 Equity Minority Interest : f(Revenue)2025 Equity Minority Interest : f(Revenue)2026 Equity Minority Interest : f(Revenue)2027 Equity Minority Interest : f(Revenue)2028 Equity Minority Interest : f(Revenue)2029 Equity Minority Interest : f(Revenue)2030 Equity Minority Interest : f(Revenue)2031 Equity Minority Interest : f(Revenue)2032 0.000% 0.000% 0.000% 0.000% 0.000% 0.000% 0.000% 0.000% 0.000% 0.000% 0.000% 0.000% 0.000% EARN AFFL: 0.00% 0 0 0 0 0 0 0 0 0 0 0 ‐45,227 LESS CURRENT DEBT AND OTHER LONG-TERM LIABILITIES T₀ (Adjusted for Carrying Costs ) 0 LESS PREFERRED AT PAR T₀ 3,445 EXCESS CASH & SHORT-TERM SECURITIES T₀ GROWTH 2.500% DCF analysis will deduct the total value of liabilities from the firm's cash position. PERPETUITY VALUE FCF to Equity 3,983 2,769 2,419 3,418 4,659 2,285 5,456 4,285 4,263 4,798 1,019 39,704 WACC FOR SIMULATION 5.130% 0.103% To assess liquidity at T₀, DCF analysis will deduct Balance Sheet Liabilities from Cash + Short‐term securities. 5.069% DCF to the Investors 9,674 DCF analysis will deduct the total value of liabilities from the firm's cash position. KHC: Kraft Heinz Co. | FEIN: 46-2078182: Monte Carlo: Valuation Per Share | $USD 7.881 PER SHARE Beharry, Lyndon Martin W. 2022‐07‐22_KHC_MC‐Equity‐1Million|DCF All Variable_MC 07/22/2022 14:27 | Page 10E of 17
  • 14. Equity Valuation 2022‐07‐22_KHC_MC‐Equity‐1Million Financial Statement Review Type alternative annual growth rates here: KHC: Kraft Heinz Co. | FEIN: 46‐2078182: Monte Carlo: Valuation Per Share |  $USD Mask Monetary Values In 1,000,000 $USD (Except Per Share Values). 1,000,000 $USD Revenue Growth Rate2022 Revenue Growth Rate2023 Revenue Growth Rate2024 Revenue Growth Rate2025 Revenue Growth Rate2026 Revenue Growth Rate2027 Revenue Growth Rate2028 Revenue Growth Rate2029 Revenue Growth Rate2030 Revenue Growth Rate2031 Revenue Growth Rate2032 Projection Base [FY] Year T0  2021 2021 2022 2023 2024 2025 2026 2027 2028 2029 2030 2031 2032 Mean STDEV 0 1 2 3 4 5 6 7 8 9 10 Revenue Growth Rate 2022 00.0% Revenue Growth Rate 2023 00.0% Revenue Growth Rate 2024 00.0% Revenue Growth Rate 2025 00.0% Revenue Growth Rate 2026 00.0% Revenue Growth Rate 2027 00.0% Revenue Growth Rate 2028 00.0% Revenue Growth Rate 2029 00.0% Revenue Growth Rate 2030 00.0% Revenue Growth Rate 2031 00.0% Revenue Growth Rate 2032 00.0% 0.000% 0.000% Random Growth Rate 0.00% 0.00% 0.00% 0.00% 0.00% 0.00% 0.00% 0.00% 0.00% 0.00% 0.00% Sequential Reduction 0.000% Alternate Coefficient of Variability 10.00% 0.00% 0.00% 0.00% 0.00% 0.00% 0.00% 0.00% 0.00% 0.00% 0.00% 0.00% Timet0 Timet+1 Timet+2 Timet+3 Timet+4 Timet+5 Timet+6 Timet+7 Timet+8 Timet+9 Timet+10 Timet+11 Projection TimeT1 26,042 MONTE CARLO REVENUE 26,042 26,042 26,042 26,042 26,042 26,042 26,042 26,042 26,042 26,042 26,042 CoGS : f(Revenue)2022 CoGS : f(Revenue)2023 CoGS : f(Revenue)2024 CoGS : f(Revenue)2025 CoGS : f(Revenue)2026 CoGS : f(Revenue)2027 CoGS : f(Revenue)2028 CoGS : f(Revenue)2029 CoGS : f(Revenue)2030 CoGS : f(Revenue)2031 CoGS : f(Revenue)2032 63.266% 6.327% 52.242% 70.054% 68.734% 54.907% 71.351% 51.717% 67.694% 67.896% 72.049% 64.562% 56.633% CoGS: 63.44% ‐13,605 ‐18,243 ‐17,900 ‐14,299 ‐18,581 ‐13,468 ‐17,629 ‐17,681 ‐18,763 ‐16,813 ‐14,748 Depreciation/Amortization [COGs] : f(Revenue)2022 Depreciation/Amortization [COGs] : f(Revenue)2023 Depreciation/Amortization [COGs] : f(Revenue)2024 Depreciation/Amortization [COGs] : f(Revenue)2025 Depreciation/Amortization [COGs] : f(Revenue)2026 Depreciation/Amortization [COGs] : f(Revenue)2027 Depreciation/Amortization [COGs] : f(Revenue)2028 Depreciation/Amortization [COGs] : f(Revenue)2029 Depreciation/Amortization [COGs] : f(Revenue)2030 Depreciation/Amortization [COGs] : f(Revenue)2031 Depreciation/Amortization [COGs] : f(Revenue)2032 9.221% 0.922% 9.064% 7.913% 9.236% 9.863% 10.311% 9.014% 7.308% 6.860% 8.992% 10.622% 8.122% D&A (Production): 8.85% ‐2,360 ‐2,061 ‐2,405 ‐2,569 ‐2,685 ‐2,347 ‐1,903 ‐1,787 ‐2,342 ‐2,766 ‐2,115 GROSS MARGIN: 27.71% 10,077 5,738 5,737 9,174 4,775 10,226 6,510 6,574 4,937 6,463 9,179 SGA (Only) : f(Revenue)2022 SGA (Only) : f(Revenue)2023 SGA (Only) : f(Revenue)2024 SGA (Only) : f(Revenue)2025 SGA (Only) : f(Revenue)2026 SGA (Only) : f(Revenue)2027 SGA (Only) : f(Revenue)2028 SGA (Only) : f(Revenue)2029 SGA (Only) : f(Revenue)2030 SGA (Only) : f(Revenue)2031 SGA (Only) : f(Revenue)2032 16.383% 1.638% Administrative Costs: 16.569% 16.966% 19.665% 16.265% 16.581% 16.292% 18.066% 17.002% 16.569% 17.768% 14.172% SGA: 16.57% ‐4,315 ‐4,315 ‐4,315 ‐4,315 ‐4,315 ‐4,315 ‐4,315 ‐4,315 ‐4,315 ‐4,315 ‐4,315 R&D : f(Revenue)2022 R&D : f(Revenue)2023 R&D : f(Revenue)2024 R&D : f(Revenue)2025 R&D : f(Revenue)2026 R&D : f(Revenue)2027 R&D : f(Revenue)2028 R&D : f(Revenue)2029 R&D : f(Revenue)2030 R&D : f(Revenue)2031 R&D : f(Revenue)2032 0.000% 0.000% 0.000% 0.000% 0.000% 0.000% 0.000% 0.000% 0.000% 0.000% 0.000% 0.000% 0.000% R & D: 0.00% 0 0 0 0 0 0 0 0 0 0 0 Depreciation/Amortization [SGA] : f(Revenue)2022 Depreciation/Amortization [SGA] : f(Revenue)2023 Depreciation/Amortization [SGA] : f(Revenue)2024 Depreciation/Amortization [SGA] : f(Revenue)2025 Depreciation/Amortization [SGA] : f(Revenue)2026 Depreciation/Amortization [SGA] : f(Revenue)2027 Depreciation/Amortization [SGA] : f(Revenue)2028 Depreciation/Amortization [SGA] : f(Revenue)2029 Depreciation/Amortization [SGA] : f(Revenue)2030 Depreciation/Amortization [SGA] : f(Revenue)2031 Depreciation/Amortization [SGA] : f(Revenue)2032 6.179% 0.618% 6.594% 7.010% 6.222% 6.288% 7.303% 5.454% 5.647% 6.726% 5.797% 5.984% 6.175% D & A [SGA]: 6.29% ‐1,717 ‐1,826 ‐1,620 ‐1,637 ‐1,902 ‐1,420 ‐1,471 ‐1,752 ‐1,510 ‐1,558 ‐1,608 Admin Expenses: 22.86% ‐6,032 ‐6,141 ‐5,935 ‐5,953 ‐6,217 ‐5,735 ‐5,786 ‐6,067 ‐5,825 ‐5,873 ‐5,923 Other Expense (Income) : f(Revenue)2022 Other Expense (Income) : f(Revenue)2023 Other Expense (Income) : f(Revenue)2024 Other Expense (Income) : f(Revenue)2025 Other Expense (Income) : f(Revenue)2026 Other Expense (Income) : f(Revenue)2027 Other Expense (Income) : f(Revenue)2028 Other Expense (Income) : f(Revenue)2029 Other Expense (Income) : f(Revenue)2030 Other Expense (Income) : f(Revenue)2031 Other Expense (Income) : f(Revenue)2032 -0.570% 0.057% ‐0.667% ‐0.525% ‐0.549% ‐0.571% ‐0.585% ‐0.594% ‐0.528% ‐0.534% ‐0.730% ‐0.565% ‐0.531% Other: ‐0.58% 174 137 143 149 152 155 137 139 190 147 138 EBIT: 5.43% 4,218 ‐266 ‐55 3,371 ‐1,289 4,646 862 646 ‐697 736 3,394 Interest Expense (Income) : f(Revenue)2022 Interest Expense (Income) : f(Revenue)2023 Interest Expense (Income) : f(Revenue)2024 Interest Expense (Income) : f(Revenue)2025 Interest Expense (Income) : f(Revenue)2026 Interest Expense (Income) : f(Revenue)2027 Interest Expense (Income) : f(Revenue)2028 Interest Expense (Income) : f(Revenue)2029 Interest Expense (Income) : f(Revenue)2030 Interest Expense (Income) : f(Revenue)2031 Interest Expense (Income) : f(Revenue)2032 1.250% 0.125% 1.052% 1.295% 1.004% 1.268% 1.383% 1.338% 1.321% 1.183% 1.163% 1.238% 1.316% Interest Expense: 1.23% ‐274 ‐337 ‐262 ‐330 ‐360 ‐348 ‐344 ‐308 ‐303 ‐322 ‐343 EBT: 4.20% 3,944 ‐603 ‐317 3,040 ‐1,649 4,297 518 338 ‐1,000 414 3,051 Tax Rate : f(EBT)2022 Tax Rate : f(EBT)2023 Tax Rate : f(EBT)2024 Tax Rate : f(EBT)2025 Tax Rate : f(EBT)2026 Tax Rate : f(EBT)2027 Tax Rate : f(EBT)2028 Tax Rate : f(EBT)2029 Tax Rate : f(EBT)2030 Tax Rate : f(EBT)2031 Tax Rate : f(EBT)2032 21.000% 2.100% 17.293% 22.508% 22.327% 17.475% 21.303% 17.948% 21.928% 17.796% 19.187% 20.474% 22.277% Taxes: 15.23% ‐682 136 7 ‐378 351 ‐504 ‐114 ‐60 192 ‐102 ‐680 Tax Payable Tax Payable Tax Payable Tax Payable Tax Payable Tax Payable Tax Payable Tax Payable Tax Payable Tax Payable Tax Payable NET EARNINGS: 3.56% 3,262 ‐467 ‐310 2,663 ‐1,298 3,793 404 278 ‐808 313 2,371 D&A Add‐Back: 15.14% 4,078 3,886 4,025 4,206 4,587 3,768 3,374 3,538 3,851 4,325 3,723 Capital Expenditures : f(Revenue)2022 Capital Expenditures : f(Revenue)2023 Capital Expenditures : f(Revenue)2024 Capital Expenditures : f(Revenue)2025 Capital Expenditures : f(Revenue)2026 Capital Expenditures : f(Revenue)2027 Capital Expenditures : f(Revenue)2028 Capital Expenditures : f(Revenue)2029 Capital Expenditures : f(Revenue)2030 Capital Expenditures : f(Revenue)2031 Capital Expenditures : f(Revenue)2032 8.079% 0.808% 7.639% 6.214% 9.714% 8.299% 8.828% 8.283% 8.912% 8.171% 7.816% 8.186% 9.188% CAP EX: 8.30% ‐1,989 ‐1,618 ‐2,530 ‐2,161 ‐2,299 ‐2,157 ‐2,321 ‐2,128 ‐2,035 ‐2,132 ‐2,393 Δ  Working Capital : f(Revenue)2022 Δ  Working Capital : f(Revenue)2023 Δ  Working Capital : f(Revenue)2024 Δ  Working Capital : f(Revenue)2025 Δ  Working Capital : f(Revenue)2026 Δ  Working Capital : f(Revenue)2027 Δ  Working Capital : f(Revenue)2028 Δ  Working Capital : f(Revenue)2029 Δ  Working Capital : f(Revenue)2030 Δ  Working Capital : f(Revenue)2031 Δ  Working Capital : f(Revenue)2032 0.000% 0.000% 0.000% 0.000% 0.000% 0.000% 0.000% 0.000% 0.000% 0.000% 0.000% 0.000% 0.000% Δ WRK CAP: 0.00% 0 0 0 0 0 0 0 0 0 0 0 Equity Minority Interest : f(Revenue)2022 Equity Minority Interest : f(Revenue)2023 Equity Minority Interest : f(Revenue)2024 Equity Minority Interest : f(Revenue)2025 Equity Minority Interest : f(Revenue)2026 Equity Minority Interest : f(Revenue)2027 Equity Minority Interest : f(Revenue)2028 Equity Minority Interest : f(Revenue)2029 Equity Minority Interest : f(Revenue)2030 Equity Minority Interest : f(Revenue)2031 Equity Minority Interest : f(Revenue)2032 0.000% 0.000% 0.000% 0.000% 0.000% 0.000% 0.000% 0.000% 0.000% 0.000% 0.000% 0.000% 0.000% EARN AFFL: 0.00% 0 0 0 0 0 0 0 0 0 0 0 ‐45,227 LESS CURRENT DEBT AND OTHER LONG-TERM LIABILITIES T₀ (Adjusted for Carrying Costs ) 0 LESS PREFERRED AT PAR T₀ 3,445 EXCESS CASH & SHORT-TERM SECURITIES T₀ GROWTH 2.500% DCF analysis will deduct the total value of liabilities from the firm's cash position. PERPETUITY VALUE FCF to Equity 5,350 1,801 1,186 4,708 990 5,404 1,457 1,688 1,008 2,505 3,702 144,288 WACC FOR SIMULATION 5.130% 0.103% To assess liquidity at T₀, DCF analysis will deduct Balance Sheet Liabilities from Cash + Short‐term securities. 5.087% DCF to the Investors 60,635 DCF analysis will deduct the total value of liabilities from the firm's cash position. KHC: Kraft Heinz Co. | FEIN: 46-2078182: Monte Carlo: Valuation Per Share | $USD 49.397 PER SHARE Beharry, Lyndon Martin W. 2022‐07‐22_KHC_MC‐Equity‐1Million|DCF All Variable_MC 07/22/2022 14:28 | Page 10F of 17