2021 12-18 exc-mc-models
•
0 likes•107 views

Exelon Corporation draft equity valuation modeling
![Equity Valuation 2021‐12‐10_EXC‐MC‐Equity Financial Statement Review
EXC: Exelon Corporation 1,000,000 $USD
Aggregate Notes: D&A includes Amortization of acquired Intellectual Properties (i.e. Patents etc.) and D&A on PPE.
1,000,000 2008 2009 2010 2011 2012 2013 2014 2015 2016 2017 2018 2019 2020
Timet-12 Timet-11 Timet-10 Timet-9 Timet-8 Timet-7 Timet-6 Timet-5 Timet-4 Timet-3 Timet-2 Timet-1 Timet
OPERATING REVENUE
100.000% Revenue From Income‐Expense Worksheet 0 0 0 19,063 23,489 24,888 27,429 29,447 31,366 33,565 35,978 34,438 33,039
0.000%
0.000%
0.000%
0.000%
0.000%
0.000%
0.000%
0.000%
0.000%
100.000% TOTAL REVENUE 0 0 0 19,063 23,489 24,888 27,429 29,447 31,366 33,565 35,978 34,438 33,039
Average PerCent Change 6.568% 23.218% 5.956% 10.210% 7.357% 6.517% 7.011% 7.189% ‐4.280% ‐4.062%
Revenue 12‐Yr CAGRBase‐to‐Terminal 2.329% 5‐Yr CAGR
PRODUCTION COSTS:
0.000% CoGSIncome Statement
77.080% CoGS from Income‐Expense Worksheet (If Applicable) 0 0 0 13,236 19,137 19,089 22,725 22,606 24,170 25,791 27,790 25,844 25,226
D&A from Income‐Expense Worksheet (If Applicable) 0 0 0 1,347 1,881 2,153 2,314 2,450 3,936 3,828 4,353 4,252 5,014
0.000% D&ACashFlows
No Deduct D&ACashFlows from CoGSIncome Statement
Amortization Patents Intangibles
10.771% D&A PPE 0 0 0 1,347 1,881 2,153 2,314 2,450 3,936 3,828 4,353 4,252 5,014
77.080% CoGS [Adj for D&A, and Depletion] 0 0 0 13,236 19,137 19,089 22,725 22,606 24,170 25,791 27,790 25,844 25,226
87.851% COST OF SALES (Incl D&A) 0 0 0 14,583 21,018 21,242 25,039 25,056 28,106 29,619 32,143 30,096 30,240
CoGs (Adj for D&A) PerCent of Revenue 69.433% 81.472% 76.700% 82.850% 76.768% 77.058% 76.839% 77.242% 75.045% 76.352%
12.149% GROSS MARGIN 0 0 0 4,480 2,471 3,646 2,390 4,391 3,260 3,946 3,835 4,342 2,799
12.618% PerCent of Revenue 23.501% 10.520% 14.650% 8.713% 14.912% 10.393% 11.756% 10.659% 12.608% 8.472%
See Income Expense Worksheet Row 46
0 0 0 4,480 2,471 3,646 2,390 4,391 3,260 3,946 3,835 4,342 2,799
ADMINISTRATIVE COSTS:
0.000% SGAIncome Statement
SGAWorksheet (If Applicable) 0 0 0 0 0 0 0 0 0 0 0 0 0
D&A from Income‐Expense Worksheet (If Applicable) 0 0 0 0 0 0 0 0 0 0 0 0 0
0.000% D&ACashFlows
No Deduct D&ACashFlows from SGAIncome Statement
0.000% SGA [Adj for D&A] 0 0 0 0 0 0 0 0 0 0 0 0 0
0.000% R&D
0.000% Amortization Patents Intangibles
0.000% D&A SGA 0 0 0 0 0 0 0 0 0 0 0 0 0
0.000%
0.000%
0.000% Restructuring / Other
0.000% TOTAL OPERATING / OVERHEAD EXPENSE 0 0 0 0 0 0 0 0 0 0 0 0 0
Average PerCent of Revenue 0.000% 0.000% 0.000% 0.000% 0.000% 0.000% 0.000% 0.000% 0.000% 0.000%
PerCent Change
12.149% EARNINGS BEFORE EXTRAORDINARY ITEMS: 0 0 0 4,480 2,471 3,646 2,390 4,391 3,260 3,946 3,835 4,342 2,799
Other Items from Income-Expense Worksheet 0 0 0 ‐202 ‐255 ‐483 ‐1,161 28 ‐249 ‐1,396 56 ‐1,259 ‐1,169
Agg μ -2.081% Other Expense | (Income) | Royalty or Extraordinary Items
μ -2.021% ‐1.060% ‐1.086% ‐1.941% ‐4.233% 0.095% ‐0.794% ‐4.159% 0.156% ‐3.656% ‐3.538%
14.229% EBIT 0 0 0 4,682 2,726 4,129 3,551 4,363 3,509 5,342 3,779 5,601 3,968
Average %Rev 14.640% 24.561% 11.605% 16.590% 12.946% 14.816% 11.187% 15.915% 10.504% 16.264% 12.010%
PerCent Change 4.558% ‐41.777% 51.467% ‐13.999% 22.867% ‐19.574% 52.237% ‐29.259% 48.214% ‐29.156%
INTEREST PAYMENTS
Interest Accounting from Income‐Expense Worksheet 0 0 0 726 928 1,356 1,065 1,033 1,536 1,560 1,554 1,616 1,635
Agg μ 4.444% Interest Expense
μ 0 Estimated Cost of Debt 4.513% 0 0 0 0 0 0 0 0 0 0
TOTAL INTEREST 0 0 0 726 928 1,356 1,065 1,033 1,536 1,560 1,554 1,616 1,635
PerCent Change 11.613% 27.824% 46.121% ‐21.460% ‐3.005% 48.693% 1.563% ‐0.385% 3.990% 1.176%
28,641 EARNINGS BEFORE TAXES 0 0 0 3,956 1,798 2,773 2,486 3,330 1,973 3,782 2,225 3,985 2,333
PROVISION FOR TAXES
6,760 1,457 627 1,044 666 1,073 753 ‐125 118 774 373
PerCent Change 65.172% ‐56.966% 66.507% ‐36.207% 61.111% ‐29.823% ‐116.600% 194.400% 555.932% ‐51.809%
23.603% PerCent of EBT 36.830% 34.872% 37.649% 26.790% 32.222% 38.165% ‐3.305% 5.303% 19.423% 15.988%
Dividends on Preferred Stock
1,013 Extraneous Provisions 27 317 ‐727 644 ‐72 122 ‐36 61 474 203
0.346% 0.142% 1.350% ‐2.921% 2.348% ‐0.245% 0.389% ‐0.107% 0.170% 1.376% 0.614%
7.129% NET EARNINGS 0 0 0 2,472 854 2,456 1,176 2,329 1,098 3,943 2,046 2,737 1,757
PerCent Change ‐65.453% 187.588% ‐52.117% 98.044% ‐52.855% 259.107% ‐48.111% 33.773% ‐35.806%
Net Earnings CAGR or IRR
Use row 96 and 97 to force adjustments in Worksheet
See Income‐Expense Worksheet Row 86 0 0 0 2,472 854 2,456 1,176 2,329 1,098 3,943 2,046 2,737 1,757
10.771% 10.771% D&A Add Back 0 0 0 1,347 1,881 2,153 2,314 2,450 3,936 3,828 4,353 4,252 5,014
D&A %Rev 7.066% 8.008% 8.651% 8.436% 8.320% 12.549% 11.405% 12.099% 12.347% 15.176%
17.901% Net CashFlow to Firm 0 0 0 3,819 2,735 4,609 3,490 4,779 5,034 7,771 6,399 6,989 6,771
Net FCFFirm %Revenue 20.034% 11.644% 18.519% 12.724% 16.229% 16.049% 23.152% 17.786% 20.294% 20.494%
Estimated Capital Expenditure 0 0 0 4,279 5,272 5,586 6,157 6,609 7,040 7,534 8,075 7,730 7,416
-4.545% Estimated Net Earnings | FCFInvestors 0 0 0 ‐460 ‐2,537 ‐977 ‐2,667 ‐1,830 ‐2,006 237 ‐1,676 ‐741 ‐645
Net FCFInvestors %Revenue ‐2.412% ‐10.802% ‐3.926% ‐9.722% ‐6.216% ‐6.396% 0.707% ‐4.659% ‐2.151% ‐1.951%
CAGR or IRR Estimated Net Earnings | FCFInvestors
Beharry, Lyndon Martin W. 2021‐12‐10_EXC‐MC‐Equity|IncStmntReview 12/13/2021 09:07 Page 1 of 1](data:image/gif;base64,R0lGODlhAQABAIAAAAAAAP///yH5BAEAAAAALAAAAAABAAEAAAIBRAA7)
Recommended
Recommended
More Related Content
More from Lyndon Martin W. Beharry
More from Lyndon Martin W. Beharry (20)
2021 12-18 exc-mc-models
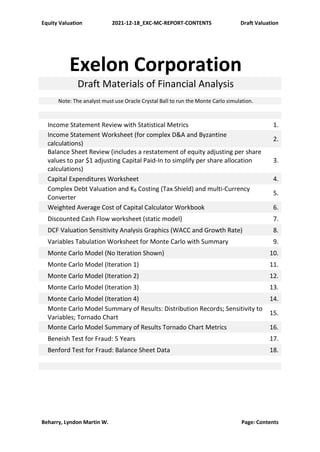
- 1. Equity Valuation 2021-12-18_EXC-MC-REPORT-CONTENTS Draft Valuation Beharry, Lyndon Martin W. Page: Contents Exelon Corporation Draft Materials of Financial Analysis Note: The analyst must use Oracle Crystal Ball to run the Monte Carlo simulation. Income Statement Review with Statistical Metrics 1. Income Statement Worksheet (for complex D&A and Byzantine calculations) 2. Balance Sheet Review (includes a restatement of equity adjusting per share values to par $1 adjusting Capital Paid-In to simplify per share allocation calculations) 3. Capital Expenditures Worksheet 4. Complex Debt Valuation and KB Costing (Tax Shield) and multi-Currency Converter 5. Weighted Average Cost of Capital Calculator Workbook 6. Discounted Cash Flow worksheet (static model) 7. DCF Valuation Sensitivity Analysis Graphics (WACC and Growth Rate) 8. Variables Tabulation Worksheet for Monte Carlo with Summary 9. Monte Carlo Model (No Iteration Shown) 10. Monte Carlo Model (Iteration 1) 11. Monte Carlo Model (Iteration 2) 12. Monte Carlo Model (Iteration 3) 13. Monte Carlo Model (Iteration 4) 14. Monte Carlo Model Summary of Results: Distribution Records; Sensitivity to Variables; Tornado Chart 15. Monte Carlo Model Summary of Results Tornado Chart Metrics 16. Beneish Test for Fraud: 5 Years 17. Benford Test for Fraud: Balance Sheet Data 18.
- 2. Equity Valuation 2021‐12‐10_EXC‐MC‐Equity Financial Statement Review EXC: Exelon Corporation 1,000,000 $USD Aggregate Notes: D&A includes Amortization of acquired Intellectual Properties (i.e. Patents etc.) and D&A on PPE. 1,000,000 2008 2009 2010 2011 2012 2013 2014 2015 2016 2017 2018 2019 2020 Timet-12 Timet-11 Timet-10 Timet-9 Timet-8 Timet-7 Timet-6 Timet-5 Timet-4 Timet-3 Timet-2 Timet-1 Timet OPERATING REVENUE 100.000% Revenue From Income‐Expense Worksheet 0 0 0 19,063 23,489 24,888 27,429 29,447 31,366 33,565 35,978 34,438 33,039 0.000% 0.000% 0.000% 0.000% 0.000% 0.000% 0.000% 0.000% 0.000% 100.000% TOTAL REVENUE 0 0 0 19,063 23,489 24,888 27,429 29,447 31,366 33,565 35,978 34,438 33,039 Average PerCent Change 6.568% 23.218% 5.956% 10.210% 7.357% 6.517% 7.011% 7.189% ‐4.280% ‐4.062% Revenue 12‐Yr CAGRBase‐to‐Terminal 2.329% 5‐Yr CAGR PRODUCTION COSTS: 0.000% CoGSIncome Statement 77.080% CoGS from Income‐Expense Worksheet (If Applicable) 0 0 0 13,236 19,137 19,089 22,725 22,606 24,170 25,791 27,790 25,844 25,226 D&A from Income‐Expense Worksheet (If Applicable) 0 0 0 1,347 1,881 2,153 2,314 2,450 3,936 3,828 4,353 4,252 5,014 0.000% D&ACashFlows No Deduct D&ACashFlows from CoGSIncome Statement Amortization Patents Intangibles 10.771% D&A PPE 0 0 0 1,347 1,881 2,153 2,314 2,450 3,936 3,828 4,353 4,252 5,014 77.080% CoGS [Adj for D&A, and Depletion] 0 0 0 13,236 19,137 19,089 22,725 22,606 24,170 25,791 27,790 25,844 25,226 87.851% COST OF SALES (Incl D&A) 0 0 0 14,583 21,018 21,242 25,039 25,056 28,106 29,619 32,143 30,096 30,240 CoGs (Adj for D&A) PerCent of Revenue 69.433% 81.472% 76.700% 82.850% 76.768% 77.058% 76.839% 77.242% 75.045% 76.352% 12.149% GROSS MARGIN 0 0 0 4,480 2,471 3,646 2,390 4,391 3,260 3,946 3,835 4,342 2,799 12.618% PerCent of Revenue 23.501% 10.520% 14.650% 8.713% 14.912% 10.393% 11.756% 10.659% 12.608% 8.472% See Income Expense Worksheet Row 46 0 0 0 4,480 2,471 3,646 2,390 4,391 3,260 3,946 3,835 4,342 2,799 ADMINISTRATIVE COSTS: 0.000% SGAIncome Statement SGAWorksheet (If Applicable) 0 0 0 0 0 0 0 0 0 0 0 0 0 D&A from Income‐Expense Worksheet (If Applicable) 0 0 0 0 0 0 0 0 0 0 0 0 0 0.000% D&ACashFlows No Deduct D&ACashFlows from SGAIncome Statement 0.000% SGA [Adj for D&A] 0 0 0 0 0 0 0 0 0 0 0 0 0 0.000% R&D 0.000% Amortization Patents Intangibles 0.000% D&A SGA 0 0 0 0 0 0 0 0 0 0 0 0 0 0.000% 0.000% 0.000% Restructuring / Other 0.000% TOTAL OPERATING / OVERHEAD EXPENSE 0 0 0 0 0 0 0 0 0 0 0 0 0 Average PerCent of Revenue 0.000% 0.000% 0.000% 0.000% 0.000% 0.000% 0.000% 0.000% 0.000% 0.000% PerCent Change 12.149% EARNINGS BEFORE EXTRAORDINARY ITEMS: 0 0 0 4,480 2,471 3,646 2,390 4,391 3,260 3,946 3,835 4,342 2,799 Other Items from Income-Expense Worksheet 0 0 0 ‐202 ‐255 ‐483 ‐1,161 28 ‐249 ‐1,396 56 ‐1,259 ‐1,169 Agg μ -2.081% Other Expense | (Income) | Royalty or Extraordinary Items μ -2.021% ‐1.060% ‐1.086% ‐1.941% ‐4.233% 0.095% ‐0.794% ‐4.159% 0.156% ‐3.656% ‐3.538% 14.229% EBIT 0 0 0 4,682 2,726 4,129 3,551 4,363 3,509 5,342 3,779 5,601 3,968 Average %Rev 14.640% 24.561% 11.605% 16.590% 12.946% 14.816% 11.187% 15.915% 10.504% 16.264% 12.010% PerCent Change 4.558% ‐41.777% 51.467% ‐13.999% 22.867% ‐19.574% 52.237% ‐29.259% 48.214% ‐29.156% INTEREST PAYMENTS Interest Accounting from Income‐Expense Worksheet 0 0 0 726 928 1,356 1,065 1,033 1,536 1,560 1,554 1,616 1,635 Agg μ 4.444% Interest Expense μ 0 Estimated Cost of Debt 4.513% 0 0 0 0 0 0 0 0 0 0 TOTAL INTEREST 0 0 0 726 928 1,356 1,065 1,033 1,536 1,560 1,554 1,616 1,635 PerCent Change 11.613% 27.824% 46.121% ‐21.460% ‐3.005% 48.693% 1.563% ‐0.385% 3.990% 1.176% 28,641 EARNINGS BEFORE TAXES 0 0 0 3,956 1,798 2,773 2,486 3,330 1,973 3,782 2,225 3,985 2,333 PROVISION FOR TAXES 6,760 1,457 627 1,044 666 1,073 753 ‐125 118 774 373 PerCent Change 65.172% ‐56.966% 66.507% ‐36.207% 61.111% ‐29.823% ‐116.600% 194.400% 555.932% ‐51.809% 23.603% PerCent of EBT 36.830% 34.872% 37.649% 26.790% 32.222% 38.165% ‐3.305% 5.303% 19.423% 15.988% Dividends on Preferred Stock 1,013 Extraneous Provisions 27 317 ‐727 644 ‐72 122 ‐36 61 474 203 0.346% 0.142% 1.350% ‐2.921% 2.348% ‐0.245% 0.389% ‐0.107% 0.170% 1.376% 0.614% 7.129% NET EARNINGS 0 0 0 2,472 854 2,456 1,176 2,329 1,098 3,943 2,046 2,737 1,757 PerCent Change ‐65.453% 187.588% ‐52.117% 98.044% ‐52.855% 259.107% ‐48.111% 33.773% ‐35.806% Net Earnings CAGR or IRR Use row 96 and 97 to force adjustments in Worksheet See Income‐Expense Worksheet Row 86 0 0 0 2,472 854 2,456 1,176 2,329 1,098 3,943 2,046 2,737 1,757 10.771% 10.771% D&A Add Back 0 0 0 1,347 1,881 2,153 2,314 2,450 3,936 3,828 4,353 4,252 5,014 D&A %Rev 7.066% 8.008% 8.651% 8.436% 8.320% 12.549% 11.405% 12.099% 12.347% 15.176% 17.901% Net CashFlow to Firm 0 0 0 3,819 2,735 4,609 3,490 4,779 5,034 7,771 6,399 6,989 6,771 Net FCFFirm %Revenue 20.034% 11.644% 18.519% 12.724% 16.229% 16.049% 23.152% 17.786% 20.294% 20.494% Estimated Capital Expenditure 0 0 0 4,279 5,272 5,586 6,157 6,609 7,040 7,534 8,075 7,730 7,416 -4.545% Estimated Net Earnings | FCFInvestors 0 0 0 ‐460 ‐2,537 ‐977 ‐2,667 ‐1,830 ‐2,006 237 ‐1,676 ‐741 ‐645 Net FCFInvestors %Revenue ‐2.412% ‐10.802% ‐3.926% ‐9.722% ‐6.216% ‐6.396% 0.707% ‐4.659% ‐2.151% ‐1.951% CAGR or IRR Estimated Net Earnings | FCFInvestors Beharry, Lyndon Martin W. 2021‐12‐10_EXC‐MC‐Equity|IncStmntReview 12/13/2021 09:07 Page 1 of 1
- 3. Equity Valuation 2021‐12‐10_EXC‐MC‐Equity Financial Statement Review Income‐Expense Worksheet EXC: Exelon Corporation 2008 2009 2010 2011 2012 2013 2014 2015 2016 2017 2018 2019 2020 1,000,000 $USD Revenue Worksheet Competitive business revenues 19,063 23,489 24,888 16,637 18,395 16,330 17,394 19,168 17,754 16,400 Rate‐regulated utility revenues 10,792 11,052 14,988 15,964 16,879 16,839 16,633 Revenue from alternative revenue programs 48 207 ‐69 ‐155 6 REVENUE CALCULATION 0 0 0 19,063 23,489 24,888 27,429 29,447 31,366 33,565 35,978 34,438 33,039 CoGS Worksheet Line Worker Wage (If Applicable) Competitive business purchased power and fuel 7,130 9,121 9,468 9,369 10,007 8,817 9,668 11,679 10,849 9,592 Rate‐regulated utility purchased power and fuel 3,103 3,077 3,823 4,367 4,991 4,648 4,512 Operating and Maintenance 5,184 7,961 7,270 8,568 8,322 9,954 10,025 9,337 8,615 9,408 Taxes other than income taxes 785 1,019 1,095 1,154 1,200 1,576 1,731 1,783 1,732 1,714 Purchased Power and Fuel 531 Purchased Power and Fuel from Affiliates 137 1,036 1,256 CoGS CALCULATION 0 0 0 13,236 19,137 19,089 22,725 22,606 24,170 25,791 27,790 25,844 25,226 0 0 0 4,480 2,471 3,646 2,390 4,391 3,260 3,946 3,835 4,342 2,799 COMPLEX D&A CoGS (Production Capital) *****Check CashFlow statement notes***** 1,347 1,881 2,153 2,314 2,450 3,936 3,828 4,353 4,252 5,014 TOTAL COMPLEX D&A (Posts to CoGS) 0 0 0 1,347 1,881 2,153 2,314 2,450 3,936 3,828 4,353 4,252 5,014 COMPLEX SGA (Administrative Expense) TOTAL COMPLEX SGA (Posts to Administrative Expense) 0 0 0 0 0 0 0 0 0 0 0 0 0 0 0 0 2,472 854 2,456 1,176 2,329 1,098 3,943 2,046 2,737 1,757 COMPLEX D&A SGA (Administrative Capital) TOTAL OTHER COMPLEX D&A SGA 0 0 0 0 0 0 0 0 0 0 0 0 0 OTHER INCOME / (LOSS) Gain / (Loss) on Sale of Property and/or Facility (If Applicable ) Interest Receivable (If Applicable ) Gain on sales of assets and businesses ‐7 13 437 18 ‐48 3 56 31 24 Gain on deconsolidation of business 0 0 289 213 0 1 0 Bargain Purchase Gain 233 Other, net 203 353 460 455 ‐46 297 947 ‐112 1,227 1,145 Equity in Losses of unconsolidated affiliates ‐1 ‐91 10 ‐20 TOTAL OTHER INCOME (LOSS) 0 0 0 202 255 483 1,161 ‐28 249 1,396 ‐56 1,259 1,169 INTEREST EXPENSE Interest Expense, net 701 891 1,315 1,024 992 1,495 1,524 1,529 1,591 1,610 Interest Expense to Affiliates 25 37 41 41 41 41 36 25 25 25 TOTAL INTEREST EXPENSE 0 0 0 726 928 1,356 1,065 1,033 1,536 1,560 1,554 1,616 1,635 Beharry, Lyndon Martin W. 2021‐12‐10_EXC‐MC‐Equity|Income‐Expense Worksheet 12/13/2021 09:07 Page 1 of 1
- 4. Equity Valuation 2021‐12‐10_EXC‐MC‐Equity Financial Statement Review EXC: Exelon Corporation BalShtReview 1,000,000 $USD 2008 2009 2010 2011 2012 2013 2014 2015 2016 2017 2018 2019 2020 CURRENT ASSETS Cash 1,486 1,609 1,878 6,502 635 898 1,349 587 663 Trade Accounts Receivable 4,228 4,156 4,709 4,099 5,359 5,577 5,863 6,175 4,629 Short Term Factor Financing Receivable Accounts Receivable 0 0 0 0 4,228 4,156 4,709 4,099 5,359 5,577 5,863 6,175 4,629 Inventories 1,014 1,105 1,603 1,566 1,638 1,651 1,685 1,768 1,722 Investments in Securities / Short‐term Securities 938 727 1,279 1,365 917 976 804 679 644 Deferred Tax 573 244 Restricted Cash and Equivalents 133 167 271 205 253 207 247 358 438 Mark‐to‐market derivative assets (see securities) Unamortized energy contract assets 886 374 254 86 88 60 48 47 38 Regulatory Assets 764 760 847 759 1,342 1,267 1,222 1,170 1,228 Renewable energy credits 348 633 Assets held for sale 14 147 0 904 958 Other 560 652 865 752 930 1,260 1,238 905 1,609 Deposit with IRS 131 1,250 TOTAL CURRENT ASSETS 0 0 0 0 10,140 10,137 12,097 15,334 12,412 11,896 13,360 12,037 12,562 NON-CURRENT ASSETS (i.e. LONG-TERM ASSETS) Property Plant and Equipment (Acquisition Basis) 57,370 61,043 66,829 73,814 90,724 95,266 99,609 104,212 109,311 Accumulated Depreciation 12,184 13,713 14,742 16,375 19,169 21,064 22,902 23,979 26,727 Property Plant and Equipment (Net of Depreciation) PPE (Net) 0 0 0 0 45,186 47,330 52,087 57,439 71,555 74,202 76,707 80,233 82,584 Goodwill 2,625 2,625 2,672 2,672 6,677 6,677 6,677 6,677 6,677 Intangible (Other Intangible) TOTAL GOODWILL AND INTANGIBLE OTHER 0 0 0 0 2,625 2,625 2,672 2,672 6,677 6,677 6,677 6,677 6,677 Long‐term Marketable Securities 2,121 1,794 1,317 1,397 1,121 977 1,077 972 995 Regulatory Assets 6,497 5,910 6,076 6,065 10,046 8,021 8,237 8,335 8,759 Nuclear decommissioning trust funds 7,248 8,071 10,537 10,342 11,061 13,272 11,661 13,190 14,464 Investments (see securities) Unamortized energy contract assets 1,073 710 549 484 447 395 372 336 294 Other 1,128 964 1,160 1,445 1,472 1,330 1,575 3,197 2,982 Deferred Income Taxes 58 Pledged assets for Zion Station decommissioning 614 458 319 206 113 Investment in CENG 1,849 1,925 0 Investments in affiliates 22 TOTAL NON-CURRENT ASSETS 0 0 0 0 68,421 69,787 74,717 80,050 102,492 104,874 106,306 112,940 116,755 TOTAL ASSETS 0 0 0 0 78,561 79,924 86,814 95,384 114,904 116,770 119,666 124,977 129,317 CURRENT LIABILITIES Accounts Payable 2,580 2,484 3,048 3,532 3,800 3,532 3,800 3,560 3,562 Current Portion of Debt 1,047 1,509 1,802 2,088 1,349 2,088 1,349 4,710 1,819 Accrued Expenses 1,796 1,633 1,539 1,837 2,112 1,837 2,112 1,981 2,078 Accrued Taxes Payable 58 40 0 Short‐term borrowings 0 341 460 929 714 929 714 1,370 2,031 Payables to Affiliates 112 116 8 5 5 5 5 5 5 Regulatory Liabilities 368 327 310 523 644 523 644 406 581 Mark‐to‐market derivative liabilities 352 159 234 232 475 232 475 247 295 Unamortized Energy Contract liabilities 455 261 238 231 149 231 149 132 100 Renewable energy credit obligation 352 344 352 344 443 661 Liabilities held for sale 777 777 375 Other 813 858 1,123 1,069 1,035 1,069 1,035 1,331 1,264 Short‐term notes payable: A/R agreement 210 Dividend Payable TOTAL CURRENT LIABILITIES 0 0 0 0 7,791 7,728 8,762 10,798 11,404 10,798 11,404 14,185 12,771 LONG-TERM LIABILITIES Notes payable / Long‐term Debt 18,346 18,271 20,010 32,565 34,465 32,565 34,465 31,719 35,483 Long‐term Tax Liabilities 11,551 12,905 13,019 11,235 11,330 11,235 11,330 12,351 13,035 Asset retirement obligations 5,074 5,194 7,295 10,029 9,679 10,029 9,679 10,846 12,300 Pension obligations 3,428 1,876 3,366 3,736 3,988 3,736 3,988 4,247 4,503 Non‐pension post‐retirement benefit obligations 2,662 2,190 1,742 2,093 1,928 2,093 1,928 2,076 2,011 Spent nuclear fuel obligation 1,020 1,021 1,021 1,147 1,171 1,147 1,171 1,199 1,208 Regulatory liabilities 3,981 4,388 4,550 9,865 9,559 9,865 9,559 9,986 9,485 Mark‐to‐market derivative liabilities 281 300 403 409 479 409 479 393 473 Unamortized energy contract liabilities 528 266 211 609 463 609 463 338 238 Other 1,650 2,540 2,147 2,097 2,130 2,097 2,130 3,064 2,942 Payable to Zion Station decommissioning 432 305 155 TOTAL LONG-TERM LIABILITIES 0 0 0 0 48,953 49,256 53,919 73,785 75,192 73,785 75,192 76,219 81,678 TOTAL LIABILITIES 0 0 0 0 56,744 56,984 62,681 84,583 86,596 84,583 86,596 90,404 94,449 SHAREHOLDERS EQUITY Goal‐Seek Adjust Capital Paid‐In and Share count total to Par $USD 1.00 Preferred Stock:A @ par $USD 1.00 Preferred Stock:B @ par $USD 1.00 Preferred Stock:C @ par $USD 1.00 Preferred Stock:D @ par $USD 1.00 Common Stock @ par $USD 1.00 855 857 860 963 968 963 968 973 976 Treasury Stock @ par $USD 1.00 35 35 35 2 2 2 2 2 2 Additional Capital Paid‐In 13,421 13,522 13,487 17,876 18,023 17,876 18,023 18,176 18,272 Deferred Compensation Accumulated Comprehensive Income / (Loss) ‐2,767 ‐2,040 ‐2,684 ‐3,026 ‐2,995 ‐3,026 ‐2,995 ‐3,194 ‐3,400 Retained Earnings / Accumulated Other Comprehensive Income 9,893 10,358 10,910 14,081 14,766 14,081 14,766 16,267 16,735 Non‐controlling Interests 100 15 1,332 2,291 2,306 2,291 2,306 2,349 2,283 BGE preference stock not subject to mandatory redemption 193 193 193 TOTAL SHAREHOLDERS EQUITY 0 0 0 0 21,730 22,940 24,133 32,187 33,070 32,187 33,070 34,573 34,868 TOTAL LIABILITIES AND SE 0 0 0 0 78,474 79,924 86,814 116,770 119,666 116,770 119,666 124,977 129,317 Beharry, Lyndon Martin W. 2021‐12‐10_EXC‐MC‐Equity|BalShtReview 12/13/2021 09:08 Page 1 of 1
- 5. Equity Valuation 2021‐12‐10_EXC‐MC‐Equity Financial Statement Review EXC: Exelon Corporation CAPEXCalc IRR; CAGR Aggregated 1,000,000 $USD 2008 2009 2010 2011 2012 2013 2014 2015 2016 2017 2018 2019 2020 4.095% Working Capital [Current Assets - Current Liabilities] 2,409 3,335 4,536 1,008 1,098 1,956 ‐2,148 ‐209 PerCent of Revenue 9.679% 12.159% 15.404% 3.214% 3.271% 5.437% ‐6.237% ‐0.633% 50.716% Working Capital ‐926 ‐1,201 3,528 ‐90 ‐858 4,104 ‐1,939 1.027% Working Capital %Rev ‐3.376% ‐4.079% 11.248% ‐0.268% ‐2.385% 11.917% ‐5.869% 4.459% CAPEX = Total Assets - Total Liabilities 1,123 1,193 ‐13,332 17,507 3,879 883 1,503 295 4.834% CAPEX %Rev 4.512% 4.349% ‐45.275% 55.815% 11.557% 2.454% 4.364% 0.893% 22.445% CAPEX = PPECurrent - PPELast + Depreciation 4,297 7,071 7,802 18,052 6,475 6,858 7,778 7,365 26.290% CAPEX %Rev 17.265% 25.779% 26.495% 57.553% 19.291% 19.062% 22.586% 22.292% 125.387% 153.532% CAPEX %FCFFirm 93.231% 202.607% 163.256% 358.602% 83.323% 107.173% 111.289% 108.773% [Agg CapEx]/[Agg Rev] 22.445% Net Operating Working Capital [Alt Calc] 2008 2009 2010 2011 2012 2013 2014 2015 2016 2017 2018 2019 2020 + Total Current Assets 10,140 10,137 12,097 15,334 12,412 11,896 13,360 12,037 12,562 ‐ Investments In Securities ‐938 ‐727 ‐1,279 ‐1,365 ‐917 ‐976 ‐804 ‐679 ‐644 ‐ Factor Trade Financing Receivable ‐ Current Liabilities ‐7,791 ‐7,728 ‐8,762 ‐10,798 ‐11,404 ‐10,798 ‐11,404 ‐14,185 ‐12,771 + Current Portion of Debt 1,047 1,509 1,802 2,088 1,349 2,088 1,349 4,710 1,819 8.120% Net Operating Working Capital 2,458 3,191 3,858 5,259 1,440 2,210 2,501 1,883 966 PerCent of Revenue 10.464% 12.821% 14.065% 17.859% 4.591% 6.584% 6.951% 5.468% 2.924% Working Capital ‐733 ‐667 ‐1,401 3,819 ‐770 ‐291 618 917 0.510% 0.439% Working Capital %Rev ‐2.945% ‐2.432% ‐4.758% 12.176% ‐2.294% ‐0.809% 1.795% 2.776% Beharry, Lyndon Martin W. 2021‐12‐10_EXC‐MC‐Equity|CAPEXCalc 12/13/2021 09:08 Page 1 of 1
- 6. Equity Valuation 2021‐12‐10_EXC‐MC‐Equity Financial Statement Review Complex Debt ForEx Carrying Conversion 1,000,000 $USD Currency Value Rate Long-Term Debt Australian Dollar AUD 0.71000 MatDate Coupon Value Annual Canadian Dollar CND 0.76000 USD 1.00000 2050‐01‐01 4.045% 18,915.000 765 LIBOR 1.71% 12/13/2021 Chinese Yuan CNY 0.14000 USD 1.00000 2050‐01‐01 5.025% 10,585.000 532 Credit Facility Premium 1.70% European Union EUR 1.14000 USD 1.00000 2050‐01‐01 4.375% 3,700.000 162 3.41% Korean Won KRW 0.00088 USD 1.00000 2020‐01‐01 2.600% 0.000 0 South Africa Rand ZAR 0.06800 USD 1.00000 2022‐01‐01 3.150% 0.000 0 Swiss CHF 1.00000 USD 1.00000 2053‐01‐01 5.045% 170.000 9 US Dollar USD 1.00000 USD 1.00000 2022‐01‐01 3.500% 1,150.000 40 USD 1.00000 2024‐01‐01 3.950% 30.000 1 USD 1.00000 2024‐01‐01 0.935% 143.000 1 USD 1.00000 2017‐01‐01 7.720% 10.000 1 USD 1.00000 2021‐01‐01 5.550% 21.000 1 USD 1.00000 2023‐01‐01 2.000% 50.000 1 USD 1.00000 2037‐01‐01 4.145% 977.000 40 USD 1.00000 2027‐01‐01 3.085% 765.000 24 USD 1.00000 0.000% ‐77.000 0 USD 1.00000 0.000% ‐248.000 0 USD 1.00000 0.000% 721.000 0 USD 1.00000 0.000% ‐1,819.000 0 USD 1.00000 2033‐01‐01 6.350% 206.000 13 USD 1.00000 2028‐01‐01 6.315% 81.000 5 USD 1.00000 2033‐01‐01 5.750% 103.000 6 USD 1.00000 0.000% 0.000 0 USD 1.00000 0.000% 0.000 0 USD 1.00000 0.000% 0.000 0 USD 1.00000 0.000% 0.000 0 EUR 1.14000 0.000% 0.000 0 EUR 1.14000 0.000% 0.000 0 USD 1.00000 0.000% 0.000 0 CND 0.76000 0.000% 0.000 0 USD 1.00000 0.000% 0.000 0 USD 1.00000 0.000% 0.000 0 USD 1.00000 0.000% 0.000 0 USD 1.00000 0.000% 0.000 0 USD 1.00000 0.000% 0.000 0 USD 1.00000 0.000% 0.000 0 USD 1.00000 0.000% 0.000 0 USD 1.00000 0.000 0 USD 1.00000 0.000 0 USD 1.00000 0.000 0 USD 1.00000 0.000 0 USD 1.00000 0.000 0 USD 1.00000 0.000 0 USD 1.00000 0.000 0 USD 1.00000 0.000 0 0.00000 0.000 0 0.00000 0.000 0 0.00000 0.000 0 0.00000 0.000 0 0.00000 0.000 0 0.00000 0.000 0 0.00000 0.000 0 0.00000 0.000 0 0.00000 0.000 0 0.00000 0.000 0 0.00000 0.000 0 0.00000 0.000 0 0.00000 0.000 0 0.00000 0.000 0 0.00000 0.000 0 0.00000 0.000 0 0.00000 0.000 0 0.00000 0.000 0 0.00000 0.000 0 0.00000 0.000 0 0.00000 0.000 0 0.00000 0.000 0 0.00000 0.000 0 0.00000 0.000 0 0.00000 0.000 0 0.00000 0.000 0 0.00000 0.000 0 0.00000 0.000 0 0.00000 0.000 0 0.00000 0.000 0 0.00000 0.000 0 … 35,483 1,601 4.513% Beharry, Lyndon Martin W. 2021‐12‐10_EXC‐MC‐Equity|Complex Debt 12/13/2021 09:09 Page 1 of 1
- 7. Equity Valuation 2021‐12‐10_EXC‐MC‐Equity Financial Statement Review EXC: Exelon Corporation WACCCalc ACCOUNT FOR CURRENT AND LONG‐TERM LIABILITIES Yes DCF analysis will deduct the total value of liabilities from the firm's cash position. Functional Currency: 1,000,000 $USD DCF ACCOUNTS FOR CASH AND ALL OTHER ASSETS (YES); ONLY CASH AND SHORT‐TERM (NO) No To assess liquidity at T₀, DCF analysis will deduct Balance Sheet Liabilities from Cash + Short‐term securities. Debt B Calculations [for Weighted Average Cost of Debt]: FIRE SALE VALUE FOR ASSETS OTHER THAN CASH: 85.000% 1,000,000 Long-Term Debt COST OF DEBT 4.513% MatDate Coupon Value Annual TAX ADJUSTED 3.610% 2018‐09‐01 8.000% 0 OUTSTANDING DEBT OBLIGATIONS 94,449 2.700% 0 0 $USD CURRENCY COST OF DEBT ISSUE. 97,859 1.550% 0 0 6.800% 0 0 2.250% 0 0 COST OF PREFERRED STOCK 0.000% 2.960% 0 0 WEIGHTED MARKET PRICE OF PREFERRED STOCK 0.000 2.400% 0 0 WEIGHTED AVERAGE OF OUTSTANDING PREFERRED STOCK 0 2.150% 0 0 $USD CURRENCY COST OF PREFERRED CAPITAL. 0 2.400% 0 0 2.850% 0 0 2.550% 0 0 MARKET PRICE OF COMMON STOCK 53.880 3.500% 0 0 RECENT SHARES OUT 978 4.625% 0 0 OUTSTANDING COMMON STOCK: ESTIMATETTM = AVG(RECENT,10K FIGURE) 978 Adjusted for Treasury Stock 4.540% 0 RETAINED EARNINGS 16,735 4.580% 0 $USD CURRENCY COST OF COMMON CAPITAL: CAPITALIZATION. 52,708 34,868 BALANCE SHEET SE 1.920% 0 2.610% 0 DIVIDEND IN $USD 1.530 2.840% 0 DIVIDEND YIELD RATE 2.840% 4.150% 0 ONE YR EXPECTED $USD RETURN PER SHARE = [MARKET PRICE X (1+ER)] + DIVIDEND 57.785 1.890% 0 ACTUAL RETURN ON EQUITY: ER for TTM 5.039% 5.410% TTM VALUE EXPECTED RETURN ON EQUITYUPPER: Including Risk Premium 6.816% MEAN OF FINANCIALS AND TTM 0 0 GORDON DIVIDEND RoE IMPUTED ke 7.630% Cost of Long Term Debt 0.000% HISTORICAL 0.480 CAPM FOR COMMON STOCK E(ri) = rf + [E(rm)-rf] LOWER 4.407% Long Term Debt 35,483 ESTIMATE THE COST OF EQUITY ON EXPECTED RoE OR CAPM? WAAC CAPMKe Cost 4.51% WACC MEAN 3.889% Short Term Debt 100 Cost 0.00% ESTIMATED SHORT-TERM RISK FREE RATE: T-BILL OR OTHER 0.260% Revolving Debt 0 OVERALL HISTORIC MARKET RETURN 8.900% Cost 0.00% PERPETUITY GROWTH RATE = INFLATION 2.500% Average Debt Cost 4.513% PERPETUITY DISCOUNT FACTORWACC-PERPETUITY GROWTH RATE 1.389% WACC Monte 3.889% TIME HORIZON (YEARS) FOR SCENARIO 10 CAPM Target Price in 1 Years: 56.255 DCF PROJECTED PRICE PER SHARE AT THESE VARIABLES: 216.607 AVERAGE INTERNAL REVENUE GROWTH RATE TIMET-10,T Beharry, Lyndon Martin W. 2021‐12‐10_EXC‐MC‐Equity|WACCCalc 12/13/2021 09:08 Page 1 of 1
- 8. Equity Valuation 2021‐12‐10_EXC‐MC‐Equity Financial Statement Review 2021 2022 2023 2024 2025 2026 2027 2028 2029 2030 0 1 2 3 4 5 6 7 8 9 10 5.00% 5.00% 5.00% 5.00% 5.00% 5.00% 5.00% 5.00% 5.00% 5.00% 5.00% PERPETUITY Timet+1 Timet+2 Timet+3 Timet+4 Timet+5 Timet+6 Timet+7 Timet+8 Timet+9 Timet+10 Timet+11 STATIC: PROJECTED REVENUE 34,691 36,425 38,247 40,159 42,167 44,275 46,489 48,814 51,254 53,817 56,508 CoGS: 77.08% ‐26,740 ‐28,077 ‐29,481 ‐30,955 ‐32,502 ‐34,127 ‐35,834 ‐37,625 ‐39,507 ‐41,482 ‐43,556 D&A (Production): 10.77% ‐3,737 ‐3,924 ‐4,120 ‐4,326 ‐4,542 ‐4,769 ‐5,008 ‐5,258 ‐5,521 ‐5,797 ‐6,087 GROSS MARGIN: 12.15% 4,215 4,425 4,647 4,879 5,123 5,379 5,648 5,930 6,227 6,538 6,865 Administrative Costs: SGA: 0.00% 0 0 0 0 0 0 0 0 0 0 0 R&D: 0.00% 0 0 0 0 0 0 0 0 0 0 0 D&A (SGA): 0.00% 0 0 0 0 0 0 0 0 0 0 0 Admin Expenses: 0.00% 0 0 0 0 0 0 0 0 0 0 0 OTHER: ‐2.08% 722 758 796 836 877 921 967 1,016 1,066 1,120 1,176 EBIT: 14.23% 4,936 5,183 5,442 5,714 6,000 6,300 6,615 6,946 7,293 7,658 8,041 Interest Inc./(Exp.): 1.25% ‐434 ‐455 ‐478 ‐502 ‐527 ‐553 ‐581 ‐610 ‐641 ‐673 ‐706 EBT: 12.98% 4,503 4,728 4,964 5,212 5,473 5,747 6,034 6,336 6,653 6,985 7,334 Taxes: 20.00% ‐901 ‐946 ‐993 ‐1,042 ‐1,095 ‐1,149 ‐1,207 ‐1,267 ‐1,331 ‐1,397 ‐1,467 Tax Payable Tax Payable Tax Payable Tax Payable Tax Payable Tax Payable Tax Payable Tax Payable Tax Payable Tax Payable Tax Payable NET EARNINGS: 10.38% 3,602 3,782 3,971 4,170 4,378 4,597 4,827 5,069 5,322 5,588 5,868 D&A AddBack: 10.77% 3,737 3,924 4,120 4,326 4,542 4,769 5,008 5,258 5,521 5,797 6,087 Capital Expenditures: 10.00% ‐3,469 ‐3,643 ‐3,825 ‐4,016 ‐4,217 ‐4,428 ‐4,649 ‐4,881 ‐5,125 ‐5,382 ‐5,651 Δ Working Capital : 0.00% 0 0 0 0 0 0 0 0 0 0 0 Earnings Due Affiliates: 0.00% 0 0 0 0 0 0 0 0 0 0 0 To assess liquidity at T₀, DCF analysis will deduct Balance Sheet Liabilities from Cash + Short‐term securities. ‐97,859 LESS CURRENT DEBT AND OTHER LONG-TERM LIABILITIES T₀ 0 LESS PREFERRED AT PAR T₀ 1,307 EXCESS CASH & SHORT-TERM SECURITIES T₀ GROWTH 2.500% DCF analysis will deduct the total value of liabilities from the firm's cash position. PERPETUITY VALUE 3,870 4,063 4,266 4,480 4,704 4,939 5,186 5,445 5,717 6,003 442,884 To assess liquidity at T₀, DCF analysis will deduct Balance Sheet Liabilities from Cash + Short‐term securities. Static Model 233,617 DCF DCF analysis will deduct the total value of liabilities from the firm's cash position. 238.833 PER SHARE WACC 3.889% Incremental Change 2.500% WACC 0.000% 2.500% 5.000% 7.500% 10.000% 12.500% 15.000% 17.500% 20.000% Standard : 2.500% Alternate WACC 3.111% 3.306% 3.500% 3.695% 3.889% 4.083% 4.278% 4.472% 4.667% Alternate: Yes EXC: Exelon Corporation NPV FCFE 1,000,000 $USD 260,401.094 253,484.787 246,719.843 240,102.643 233,629.664 227,297.472 221,102.723 215,042.156 209,112.597 Alt f(WACC): 5.000% Shares Out (Inc Treasury) 978.160 978.160 978.160 978.160 978.160 978.160 978.160 978.160 978.160 266.22 259.14 252.23 245.46 238.85 232.37 226.04 219.84 213.78 1,000,000 0.50% Growth Increment Sensitivity EXC: Exelon Corporation DCF NPV 1,000,000 $USD Varying WACC: Static Model EXC: Exelon Corporation DCF NPV 1,000,000 $USD Varying Growth: Static Model WACC EXC: Exelon $USD Per Share; 1,000,000 Units | 978 Shares Growth RatEXC: Exelon $USD Per Share; 1,000,000 Units | 978 Shares 3.111% 260,401.094 266.215 1 2.50% 166,443 170.160 3.306% 253,484.787 259.145 2 3.00% 178,763 182.755 3.500% 246,719.843 252.229 3 3.50% 191,619 195.898 3.695% 240,102.643 245.464 4 4.00% 205,032 209.610 3.889% 233,629.664 238.846 5 4.50% 219,024 223.915 4.083% 227,297.472 232.372 6 5.00% 233,617 238.833 4.278% 221,102.723 226.039 7 5.50% 248,834 254.390 4.472% 215,042.156 219.844 8 6.00% 264,699 270.609 4.667% 209,112.597 213.782 9 6.50% 281,237 287.516 10 7.00% 298,473 305.137 11 7.50% 316,433 323.498 2021 2022 2023 2024 2025 2026 2027 2028 2029 2030 Perpetuity 0 1 2 3 4 5 6 7 8 9 10 1 Timet+1 Timet+2 Timet+3 Timet+4 Timet+5 Timet+6 Timet+7 Timet+8 Timet+9 Timet+10 Timet+11 2.50% Beharry, Lyndon Martin W. 2021‐12‐10_EXC‐MC‐Equity|DCF All Variable_MC 12/13/2021 09:06 Page 2 of 3
- 9. Equity Valuation 2021‐12‐10_EXC‐MC‐Equity Financial Statement Review 260,401 253,485 246,720 240,103 233,630 227,297 221,103 215,042 209,113 266.22 259.14 252.23 245.46 238.85 232.37 226.04 219.84 213.78 0.00 50.00 100.00 150.00 200.00 250.00 300.00 0 50,000 100,000 150,000 200,000 250,000 300,000 3.11% 3.31% 3.50% 3.69% 3.89% 4.08% 4.28% 4.47% 4.67% $USD Per Share; 1,000,000 Units | 978 Shares EXC: Exelon Corporation NPV FCFE 1,000,000 $USD WACC EXC: Exelon Corporation DCF NPV 1,000,000 $USD Varying WACC: Static Model 166,443 178,763 191,619 205,032 219,024 233,617 248,834 264,699 281,237 298,473 316,433 170.16 182.75 195.90 209.61 223.91 238.83 254.39 270.61 287.52 305.14 323.50 0.00 50.00 100.00 150.00 200.00 250.00 300.00 350.00 0 50,000 100,000 150,000 200,000 250,000 300,000 350,000 2.50% 3.00% 3.50% 4.00% 4.50% 5.00% 5.50% 6.00% 6.50% 7.00% 7.50% $USD Per Share; 1,000,000 Units | 978 Shares EXC: Exelon Corporation NPV FCFE 1,000,000 $USD Growth Rate EXC: Exelon Corporation DCF NPV 1,000,000 $USD Varying Growth: Static Model Beharry, Lyndon Martin W. 2021‐12‐10_EXC‐MC‐Equity|Graphics 12/13/2021 09:03 Page 1 of 1
- 10. Equity Valuation 2021‐12‐10_EXC‐MC‐Equity Financial Statement Review Variables Monetary Values In 1,000,000 $USD (Except Per Share Values). EXC: Exelon Corporation Currency $USD Note: This sheet carries decimals to 3 places: 0.000 . Exelon Corporation, a utility services holding company, engages in the energy generation, delivery, and marketing businesses in the United States and Canada. It owns nuclear, fossil, wind, hydroelectric, biomass, and solar generating facilities. The company also sells electricity to wholesale and retail customers; and sells natural gas, renewable energy, and other energy‐related products and services. In addition, it is involved in the purchase and regulated retail sale of electricity and natural gas; and transmission and distribution of electricity, and distribution of natural gas to retail customers... support services, including legal, human resources, information technology, financial, supply management, accounting, engineering, customer operations, distribution and transmission planning, asset management, system operations, and power procurement services. It serves distribution utilities, municipalities, cooperatives, and financial institutions... (FY: 2020‐12‐31) User may vary input into shaded cells. Complete the IncStmntReview and BalShtReview worksheets. Complete this page; then run your simulation here. The most recent FY end (type year): 2020 Adjust Base Year for TTM Estimate Yes Calculate Statistics through FY: 2020 Mean Historical Alternate 10.000% Coefficient of Variation Target Cut-off Variables Estimate STDEV Rate Revenue Growth Rate 6.568% 8.084% High deviation. Coefficient of Variation=123.07% Use an alternate rate. Alternative Revenue Growth RateDCF 5.00000% 0.500% 0.00% + Increase - Reduce Growth Monte Carlo DCF: $USD 216.607 Projected Growth Rate Y1 5.000% 0.500% Use Alternate Rates: Yes 5.000% 0.500% AGGR CoGS : f(Revenue) 76.976% 3.589% 77.080% 77.080% Depreciation/Amortization [COGs] : f(Revenue) 10.406% 2.650% 10.771% 10.771% High deviation. Coefficient of Variation=25.46% Use an alternate rate. SGA (Only) : f(Revenue) 0.000% 0.000% R&D : f(Revenue) 0.000% 0.000% 0.000% Depreciation/Amortization [SGA] : f(Revenue) 0.000% 0.000% Total Administrative Overhead : f(Revenue) 0.000% 0.000% 0.000% 0.000% Other Expense (Income); Overhead : f(Revenue) ‐2.081% ‐2.081% Interest Expense (Income) : f(Revenue) 1.250% 4.444% 1.250% Tax Rate : f(EBT) 24.394% 14.621% 20.000% 23.603% High deviation. Coefficient of Variation=59.94% Use an alternate rate. Capital Expenditures : f(Revenue) 26.290% 13.039% 10.000% 22.445% High deviation. Coefficient of Variation=49.60% Use an alternate rate. Δ Working Capital : f(Revenue) 0.510% 5.356% 0.000% 0.439% High deviation. Coefficient of Variation=1050.65% Use an alternate rate. Working Capital : f(Revenue) 5.287% 7.021% 4.095% 4.095% High deviation. Coefficient of Variation=132.81% Use an alternate rate. Equity Minority Interest : f(Revenue) 0.312% 1.392% 0.000% 0.346% High deviation. Coefficient of Variation=446.79% Use an alternate rate. Financial Ratios | FY 2020 Current 0.9836348 Acid Test 0.10234124 No Include Accounts Receivable? Debt:Equity 2.70875875 Debt:Debt+Equity 0.73036801 RoA (Adjusted for D&A) 0.01358677 RoE 0.05039004 Gordon Dividend Payout Model: Book Value of the Firm $USD1,000,000 34,868 Book Value Per Share BV0 35.641 Dividend Growth Rate (Gordon Model) gn 3.000% -3.223% Δ KE : [CAPM - Gordon] ke = [(RoE - gn ) X (BV0 / P0)] + gn 7.630% No Actual RoE (Yes); Expected RoE (No) P0/BV0 = PBV = [(RoE-gn)/(ke-gn) 1.51175524 Price Multiple : BV0 1.512 Forecast Share Price From Multiple X BV0 53.880 Static Model: DCF Valuation Per Share 238.833 Growth Rate: 5.00% less 0.00% each subsequent year after T₁. $USD 238.833 VARIABLES FOR WACC CALCULATIONS Market and CAPM Modelling 0.260% Risk‐Free Rate (T‐Bill/Bond/Note, LIBOR or other imputed rate) 8.900% Overall historic Market Return Equity Share Variables 53.880 Current Market Price of Common Stock 1.530 Dividend, if applicable 0.480 eta 5.410% Return on Equity TTM 10.000% Expected Return on Equity 978 Current Shares Outstanding (diluted) Including Treasury Holdings in 1,000,000's Preferred Share Variables Current Market Price of Preferred Stock: A, if applicable 0 Current shares outstanding 1,000,000 Preferred: A stock coupon Current Market Price of Preferred Stock: B, if applicable 0 Current shares outstanding 1,000,000 Preferred: B stock coupon Current Market Price of Preferred Stock: C, if applicable 0 Current shares outstanding 1,000,000 Preferred: C stock coupon Current Market Price of Preferred Stock: D, if applicable 0 Current shares outstanding 1,000,000 Preferred: D stock coupon 0 Weighted Number of Preferred Shares Outstanding 0.000% Weighted Cost (Coupon) of Preferred Shares Outstanding 0.000 Weighted Market Price of Preferred Perpetuity Growth Rate Inflation Long‐term Growth Rate (for perpetuity model) 2.500% Long‐Term Inflation Rate 3.580% Average Long‐Term Inflation Rate: U.S.A. 4.407% CAPM KE Basis of WACC Calculation WAAC CAPMKe CALCULATE DISCOUNT RATE VARYING EQUITY WEIGHTING: WACC, CAPM, GORDON RoE, AVERAGE OF CAPM AND GORDON RoE? Yes VARY WACC AROUND ITS MEAN? 2.000% AT THIS COEFFICIENT OF VARIATION ( PERCENT OF THE MEAN). 3.889% WACC FOR SIMULATION ALTERNATE PLUG FOR WACC DISCOUNT FACTOR Forecast Results Summary Per Share 53.878 P/E Valuation 30.000 PE Forward 57.785 CAPM Valuation 6.0000 Imputed or Projected PEG 53.880 BV0 Multiple Valuation 238.833 Static DCF Valuation 216.607 Monte Carlo DCF Valuation 124.197 of All Models Valuation Monte Carlo Analysis: 216.607 Monte Carlo DCF 2.500 747.695 Monte Carlo Upper 747.695 157.608 Monte Carlo Lower 157.608 590.087 Monte Carlo Range 272.423% Range:Mean Lognormal Distribution The header (top) is higher | lower than the complement (left). Ratio Comparison of the Models P/E CAPM Gordon BV0 Static DCF MC DCF Models P/E 0.000% 7.251% 0.004% 343.285% 302.031% 130.514% CAPM ‐6.760% 0.000% ‐6.757% 313.316% 274.852% 114.930% Gordon BV0 ‐0.004% 7.247% 0.000% 343.269% 302.017% 130.506% Static DCF ‐77.441% ‐75.805% ‐77.440% 0.000% ‐9.306% ‐47.999% MC DCF ‐75.126% ‐73.323% ‐75.125% 10.261% 0.000% ‐42.663% Models ‐56.619% ‐53.473% ‐56.617% 92.303% 74.406% 0.000% Beharry, Lyndon Martin W. 2021‐12‐10_EXC‐MC‐Equity|Variables 12/13/2021 09:06 Page 1 of 1
- 11. Equity Valuation 2021‐12‐10_EXC‐MC‐Equity Financial Statement Review EXC: Exelon Corporation: Monte Carlo: Valuation Per Share | $USD Mask Monetary Values In 1,000,000 $USD (Except Per Share Values). 1,000,000 $USD Revenue Growth Rate2021 Revenue Growth Rate2022 Revenue Growth Rate2023 Revenue Growth Rate2024 Revenue Growth Rate2025 Revenue Growth Rate2026 Revenue Growth Rate2027 Revenue Growth Rate2028 Revenue Growth Rate2029 Revenue Growth Rate2030 Revenue Growth Rate2031 Projection Base [FY] Year T0 2020 2020 2021 2022 2023 2024 2025 2026 2027 2028 2029 2030 2031 Mean STDEV 0 1 2 3 4 5 6 7 8 9 10 Revenue Growth Rate 2021 00.0% Revenue Growth Rate 2022 00.0% Revenue Growth Rate 2023 00.0% Revenue Growth Rate 2024 00.0% Revenue Growth Rate 2025 00.0% Revenue Growth Rate 2026 00.0% Revenue Growth Rate 2027 00.0% Revenue Growth Rate 2028 00.0% Revenue Growth Rate 2029 00.0% Revenue Growth Rate 2030 00.0% Revenue Growth Rate 2031 00.0% 5.000% 0.500% Random Growth Rate 0.00% 0.00% 0.00% 0.00% 0.00% 0.00% 0.00% 0.00% 0.00% 0.00% 0.00% Sequential Reduction 0.000% Alternate Coefficient of Variability 10.00% 5.00% 5.00% 5.00% 5.00% 5.00% 5.00% 5.00% 5.00% 5.00% 5.00% 5.00% Timet0 Timet+1 Timet+2 Timet+3 Timet+4 Timet+5 Timet+6 Timet+7 Timet+8 Timet+9 Timet+10 Timet+11 Projection TimeT1 34,691 MONTE CARLO REVENUE 33,039 33,039 33,039 33,039 33,039 33,039 33,039 33,039 33,039 33,039 33,039 CoGS : f(Revenue)2021 CoGS : f(Revenue)2022 CoGS : f(Revenue)2023 CoGS : f(Revenue)2024 CoGS : f(Revenue)2025 CoGS : f(Revenue)2026 CoGS : f(Revenue)2027 CoGS : f(Revenue)2028 CoGS : f(Revenue)2029 CoGS : f(Revenue)2030 CoGS : f(Revenue)2031 77.080% 7.708% 0.000% 0.000% 0.000% 0.000% 0.000% 0.000% 0.000% 0.000% 0.000% 0.000% 0.000% CoGS: 0.00% 0 0 0 0 0 0 0 0 0 0 0 Depreciation/Amortization [COGs] : f(Revenue)2021 Depreciation/Amortization [COGs] : f(Revenue)2022 Depreciation/Amortization [COGs] : f(Revenue)2023 Depreciation/Amortization [COGs] : f(Revenue)2024 Depreciation/Amortization [COGs] : f(Revenue)2025 Depreciation/Amortization [COGs] : f(Revenue)2026 Depreciation/Amortization [COGs] : f(Revenue)2027 Depreciation/Amortization [COGs] : f(Revenue)2028 Depreciation/Amortization [COGs] : f(Revenue)2029 Depreciation/Amortization [COGs] : f(Revenue)2030 Depreciation/Amortization [COGs] : f(Revenue)2031 10.771% 1.077% 0.000% 0.000% 0.000% 0.000% 0.000% 0.000% 0.000% 0.000% 0.000% 0.000% 0.000% D&A (Production): 0.00% 0 0 0 0 0 0 0 0 0 0 0 GROSS MARGIN: 100.00% 33,039 33,039 33,039 33,039 33,039 33,039 33,039 33,039 33,039 33,039 33,039 SGA (Only) : f(Revenue)2021 SGA (Only) : f(Revenue)2022 SGA (Only) : f(Revenue)2023 SGA (Only) : f(Revenue)2024 SGA (Only) : f(Revenue)2025 SGA (Only) : f(Revenue)2026 SGA (Only) : f(Revenue)2027 SGA (Only) : f(Revenue)2028 SGA (Only) : f(Revenue)2029 SGA (Only) : f(Revenue)2030 SGA (Only) : f(Revenue)2031 0.000% 0.000% Administrative Costs: 0.000% 0.000% 0.000% 0.000% 0.000% 0.000% 0.000% 0.000% 0.000% 0.000% 0.000% SGA: 0.00% 0 0 0 0 0 0 0 0 0 0 0 R&D : f(Revenue)2021 R&D : f(Revenue)2022 R&D : f(Revenue)2023 R&D : f(Revenue)2024 R&D : f(Revenue)2025 R&D : f(Revenue)2026 R&D : f(Revenue)2027 R&D : f(Revenue)2028 R&D : f(Revenue)2029 R&D : f(Revenue)2030 R&D : f(Revenue)2031 0.000% 0.000% 0.000% 0.000% 0.000% 0.000% 0.000% 0.000% 0.000% 0.000% 0.000% 0.000% 0.000% R & D: 0.00% 0 0 0 0 0 0 0 0 0 0 0 Depreciation/Amortization [SGA] : f(Revenue)2021 Depreciation/Amortization [SGA] : f(Revenue)2022 Depreciation/Amortization [SGA] : f(Revenue)2023 Depreciation/Amortization [SGA] : f(Revenue)2024 Depreciation/Amortization [SGA] : f(Revenue)2025 Depreciation/Amortization [SGA] : f(Revenue)2026 Depreciation/Amortization [SGA] : f(Revenue)2027 Depreciation/Amortization [SGA] : f(Revenue)2028 Depreciation/Amortization [SGA] : f(Revenue)2029 Depreciation/Amortization [SGA] : f(Revenue)2030 Depreciation/Amortization [SGA] : f(Revenue)2031 0.000% 0.000% 0.000% 0.000% 0.000% 0.000% 0.000% 0.000% 0.000% 0.000% 0.000% 0.000% 0.000% D & A [SGA]: 0.00% 0 0 0 0 0 0 0 0 0 0 0 Admin Expenses: 0.00% 0 0 0 0 0 0 0 0 0 0 0 Other Expense (Income); Overhead : f(Revenue)2021 Other Expense (Income); Overhead : f(Revenue)2022 Other Expense (Income); Overhead : f(Revenue)2023 Other Expense (Income); Overhead : f(Revenue)2024 Other Expense (Income); Overhead : f(Revenue)2025 Other Expense (Income); Overhead : f(Revenue)2026 Other Expense (Income); Overhead : f(Revenue)2027 Other Expense (Income); Overhead : f(Revenue)2028 Other Expense (Income); Overhead : f(Revenue)2029 Other Expense (Income); Overhead : f(Revenue)2030 Other Expense (Income); Overhead : f(Revenue)2031 -2.081% 0.208% 0.000% 0.000% 0.000% 0.000% 0.000% 0.000% 0.000% 0.000% 0.000% 0.000% 0.000% Other: 0.00% 0 0 0 0 0 0 0 0 0 0 0 EBIT: 100.00% 33,039 33,039 33,039 33,039 33,039 33,039 33,039 33,039 33,039 33,039 33,039 Interest Expense (Income) : f(Revenue)2021 Interest Expense (Income) : f(Revenue)2022 Interest Expense (Income) : f(Revenue)2023 Interest Expense (Income) : f(Revenue)2024 Interest Expense (Income) : f(Revenue)2025 Interest Expense (Income) : f(Revenue)2026 Interest Expense (Income) : f(Revenue)2027 Interest Expense (Income) : f(Revenue)2028 Interest Expense (Income) : f(Revenue)2029 Interest Expense (Income) : f(Revenue)2030 Interest Expense (Income) : f(Revenue)2031 1.250% 0.125% 0.000% 0.000% 0.000% 0.000% 0.000% 0.000% 0.000% 0.000% 0.000% 0.000% 0.000% Interest Expense: 0.00% 0 0 0 0 0 0 0 0 0 0 0 EBT: 100.00% 33,039 33,039 33,039 33,039 33,039 33,039 33,039 33,039 33,039 33,039 33,039 Tax Rate : f(EBT)2021 Tax Rate : f(EBT)2022 Tax Rate : f(EBT)2023 Tax Rate : f(EBT)2024 Tax Rate : f(EBT)2025 Tax Rate : f(EBT)2026 Tax Rate : f(EBT)2027 Tax Rate : f(EBT)2028 Tax Rate : f(EBT)2029 Tax Rate : f(EBT)2030 Tax Rate : f(EBT)2031 20.000% 2.000% 0.000% 0.000% 0.000% 0.000% 0.000% 0.000% 0.000% 0.000% 0.000% 0.000% 0.000% Taxes: 0.00% 0 0 0 0 0 0 0 0 0 0 0 Tax Payable Tax Payable Tax Payable Tax Payable Tax Payable Tax Payable Tax Payable Tax Payable Tax Payable Tax Payable Tax Payable NET EARNINGS: 100.00% 33,039 33,039 33,039 33,039 33,039 33,039 33,039 33,039 33,039 33,039 33,039 D&A Add‐Back: 0.00% 0 0 0 0 0 0 0 0 0 0 0 Capital Expenditures : f(Revenue)2021 Capital Expenditures : f(Revenue)2022 Capital Expenditures : f(Revenue)2023 Capital Expenditures : f(Revenue)2024 Capital Expenditures : f(Revenue)2025 Capital Expenditures : f(Revenue)2026 Capital Expenditures : f(Revenue)2027 Capital Expenditures : f(Revenue)2028 Capital Expenditures : f(Revenue)2029 Capital Expenditures : f(Revenue)2030 Capital Expenditures : f(Revenue)2031 10.000% 1.000% 0.000% 0.000% 0.000% 0.000% 0.000% 0.000% 0.000% 0.000% 0.000% 0.000% 0.000% CAP EX: 0.00% 0 0 0 0 0 0 0 0 0 0 0 Δ Working Capital : f(Revenue)2021 Δ Working Capital : f(Revenue)2022 Δ Working Capital : f(Revenue)2023 Δ Working Capital : f(Revenue)2024 Δ Working Capital : f(Revenue)2025 Δ Working Capital : f(Revenue)2026 Δ Working Capital : f(Revenue)2027 Δ Working Capital : f(Revenue)2028 Δ Working Capital : f(Revenue)2029 Δ Working Capital : f(Revenue)2030 Δ Working Capital : f(Revenue)2031 0.000% 0.000% 0.000% 0.000% 0.000% 0.000% 0.000% 0.000% 0.000% 0.000% 0.000% 0.000% 0.000% Δ WRK CAP: 0.00% 0 0 0 0 0 0 0 0 0 0 0 Equity Minority Interest : f(Revenue)2021 Equity Minority Interest : f(Revenue)2022 Equity Minority Interest : f(Revenue)2023 Equity Minority Interest : f(Revenue)2024 Equity Minority Interest : f(Revenue)2025 Equity Minority Interest : f(Revenue)2026 Equity Minority Interest : f(Revenue)2027 Equity Minority Interest : f(Revenue)2028 Equity Minority Interest : f(Revenue)2029 Equity Minority Interest : f(Revenue)2030 Equity Minority Interest : f(Revenue)2031 0.000% 0.000% 0.000% 0.000% 0.000% 0.000% 0.000% 0.000% 0.000% 0.000% 0.000% 0.000% 0.000% EARN AFFL: 0.00% 0 0 0 0 0 0 0 0 0 0 0 ‐97,859 LESS CURRENT DEBT AND OTHER LONG-TERM LIABILITIES T₀ (Adjusted for Carrying Costs ) 0 LESS PREFERRED AT PAR T₀ 1,307 EXCESS CASH & SHORT-TERM SECURITIES T₀ GROWTH 2.500% DCF analysis will deduct the total value of liabilities from the firm's cash position. PERPETUITY VALUE FCF to Equity 33,039 33,039 33,039 33,039 33,039 33,039 33,039 33,039 33,039 33,039 33,039 2,437,411 WACC FOR SIMULATION 3.889% 0.078% To assess liquidity at T₀, DCF analysis will deduct Balance Sheet Liabilities from Cash + Short‐term securities. 15.919% DCF to the Investors 484,185 DCF analysis will deduct the total value of liabilities from the firm's cash position. EXC: Exelon Corporation: Monte Carlo: Valuation Per Share | $USD PER SHARE Beharry, Lyndon Martin W. 2021‐12‐10_EXC‐MC‐Equity|DCF All Variable_MC 12/13/2021 09:04 Page 1 of 3
- 12. Equity Valuation 2021‐12‐10_EXC‐MC‐Equity Financial Statement Review EXC: Exelon Corporation: Monte Carlo: Valuation Per Share | $USD Mask Monetary Values In 1,000,000 $USD (Except Per Share Values). 1,000,000 $USD Revenue Growth Rate2021 Revenue Growth Rate2022 Revenue Growth Rate2023 Revenue Growth Rate2024 Revenue Growth Rate2025 Revenue Growth Rate2026 Revenue Growth Rate2027 Revenue Growth Rate2028 Revenue Growth Rate2029 Revenue Growth Rate2030 Revenue Growth Rate2031 Projection Base [FY] Year T0 2020 2020 2021 2022 2023 2024 2025 2026 2027 2028 2029 2030 2031 Mean STDEV 0 1 2 3 4 5 6 7 8 9 10 Revenue Growth Rate 2021 00.0% Revenue Growth Rate 2022 00.0% Revenue Growth Rate 2023 00.0% Revenue Growth Rate 2024 00.0% Revenue Growth Rate 2025 00.0% Revenue Growth Rate 2026 00.0% Revenue Growth Rate 2027 00.0% Revenue Growth Rate 2028 00.0% Revenue Growth Rate 2029 00.0% Revenue Growth Rate 2030 00.0% Revenue Growth Rate 2031 00.0% 5.000% 0.500% Random Growth Rate 4.85% 5.01% 5.16% 6.04% 4.58% 4.66% 4.57% 5.37% 5.84% 5.79% 4.28% Sequential Reduction 0.000% Alternate Coefficient of Variability 10.00% 5.00% 5.00% 5.00% 5.00% 5.00% 5.00% 5.00% 5.00% 5.00% 5.00% 5.00% Timet0 Timet+1 Timet+2 Timet+3 Timet+4 Timet+5 Timet+6 Timet+7 Timet+8 Timet+9 Timet+10 Timet+11 Projection TimeT1 34,691 MONTE CARLO REVENUE 34,642 36,379 38,254 40,566 42,423 44,400 46,430 48,923 51,779 54,776 57,120 CoGS : f(Revenue)2021 CoGS : f(Revenue)2022 CoGS : f(Revenue)2023 CoGS : f(Revenue)2024 CoGS : f(Revenue)2025 CoGS : f(Revenue)2026 CoGS : f(Revenue)2027 CoGS : f(Revenue)2028 CoGS : f(Revenue)2029 CoGS : f(Revenue)2030 CoGS : f(Revenue)2031 77.080% 7.708% 79.250% 79.525% 77.807% 84.740% 81.690% 68.968% 91.683% 87.271% 75.484% 80.643% 57.581% CoGS: 78.12% ‐27,453 ‐28,930 ‐29,765 ‐34,375 ‐34,655 ‐30,622 ‐42,568 ‐42,695 ‐39,085 ‐44,173 ‐32,890 Depreciation/Amortization [COGs] : f(Revenue)2021 Depreciation/Amortization [COGs] : f(Revenue)2022 Depreciation/Amortization [COGs] : f(Revenue)2023 Depreciation/Amortization [COGs] : f(Revenue)2024 Depreciation/Amortization [COGs] : f(Revenue)2025 Depreciation/Amortization [COGs] : f(Revenue)2026 Depreciation/Amortization [COGs] : f(Revenue)2027 Depreciation/Amortization [COGs] : f(Revenue)2028 Depreciation/Amortization [COGs] : f(Revenue)2029 Depreciation/Amortization [COGs] : f(Revenue)2030 Depreciation/Amortization [COGs] : f(Revenue)2031 10.771% 1.077% 11.436% 11.973% 11.244% 10.163% 10.491% 10.746% 9.622% 9.705% 9.840% 11.896% 10.474% D&A (Production): 10.65% ‐3,962 ‐4,356 ‐4,301 ‐4,123 ‐4,450 ‐4,771 ‐4,467 ‐4,748 ‐5,095 ‐6,516 ‐5,983 GROSS MARGIN: 11.24% 3,226 3,093 4,188 2,068 3,317 9,007 ‐606 1,480 7,599 4,087 18,247 SGA (Only) : f(Revenue)2021 SGA (Only) : f(Revenue)2022 SGA (Only) : f(Revenue)2023 SGA (Only) : f(Revenue)2024 SGA (Only) : f(Revenue)2025 SGA (Only) : f(Revenue)2026 SGA (Only) : f(Revenue)2027 SGA (Only) : f(Revenue)2028 SGA (Only) : f(Revenue)2029 SGA (Only) : f(Revenue)2030 SGA (Only) : f(Revenue)2031 0.000% 0.000% Administrative Costs: 0.000% 0.000% 0.000% 0.000% 0.000% 0.000% 0.000% 0.000% 0.000% 0.000% 0.000% SGA: 0.00% 0 0 0 0 0 0 0 0 0 0 0 R&D : f(Revenue)2021 R&D : f(Revenue)2022 R&D : f(Revenue)2023 R&D : f(Revenue)2024 R&D : f(Revenue)2025 R&D : f(Revenue)2026 R&D : f(Revenue)2027 R&D : f(Revenue)2028 R&D : f(Revenue)2029 R&D : f(Revenue)2030 R&D : f(Revenue)2031 0.000% 0.000% 0.000% 0.000% 0.000% 0.000% 0.000% 0.000% 0.000% 0.000% 0.000% 0.000% 0.000% R & D: 0.00% 0 0 0 0 0 0 0 0 0 0 0 Depreciation/Amortization [SGA] : f(Revenue)2021 Depreciation/Amortization [SGA] : f(Revenue)2022 Depreciation/Amortization [SGA] : f(Revenue)2023 Depreciation/Amortization [SGA] : f(Revenue)2024 Depreciation/Amortization [SGA] : f(Revenue)2025 Depreciation/Amortization [SGA] : f(Revenue)2026 Depreciation/Amortization [SGA] : f(Revenue)2027 Depreciation/Amortization [SGA] : f(Revenue)2028 Depreciation/Amortization [SGA] : f(Revenue)2029 Depreciation/Amortization [SGA] : f(Revenue)2030 Depreciation/Amortization [SGA] : f(Revenue)2031 0.000% 0.000% 0.000% 0.000% 0.000% 0.000% 0.000% 0.000% 0.000% 0.000% 0.000% 0.000% 0.000% D & A [SGA]: 0.00% 0 0 0 0 0 0 0 0 0 0 0 Admin Expenses: 0.00% 0 0 0 0 0 0 0 0 0 0 0 Other Expense (Income); Overhead : f(Revenue)2021 Other Expense (Income); Overhead : f(Revenue)2022 Other Expense (Income); Overhead : f(Revenue)2023 Other Expense (Income); Overhead : f(Revenue)2024 Other Expense (Income); Overhead : f(Revenue)2025 Other Expense (Income); Overhead : f(Revenue)2026 Other Expense (Income); Overhead : f(Revenue)2027 Other Expense (Income); Overhead : f(Revenue)2028 Other Expense (Income); Overhead : f(Revenue)2029 Other Expense (Income); Overhead : f(Revenue)2030 Other Expense (Income); Overhead : f(Revenue)2031 -2.081% 0.208% ‐2.267% ‐2.051% ‐1.867% ‐2.027% ‐2.533% ‐1.971% ‐2.271% ‐2.013% ‐2.121% ‐2.383% ‐2.101% Other: ‐2.15% 785 746 714 822 1,075 875 1,054 985 1,098 1,305 1,200 EBIT: 13.39% 4,012 3,839 4,903 2,890 4,392 9,882 448 2,464 8,697 5,392 19,447 Interest Expense (Income) : f(Revenue)2021 Interest Expense (Income) : f(Revenue)2022 Interest Expense (Income) : f(Revenue)2023 Interest Expense (Income) : f(Revenue)2024 Interest Expense (Income) : f(Revenue)2025 Interest Expense (Income) : f(Revenue)2026 Interest Expense (Income) : f(Revenue)2027 Interest Expense (Income) : f(Revenue)2028 Interest Expense (Income) : f(Revenue)2029 Interest Expense (Income) : f(Revenue)2030 Interest Expense (Income) : f(Revenue)2031 1.250% 0.125% 1.272% 1.182% 1.422% 1.231% 1.322% 1.355% 1.423% 1.128% 1.190% 1.360% 1.214% Interest Expense: 1.28% ‐441 ‐430 ‐544 ‐499 ‐561 ‐602 ‐661 ‐552 ‐616 ‐745 ‐693 EBT: 12.11% 3,571 3,409 4,359 2,391 3,831 9,280 ‐212 1,912 8,081 4,647 18,753 Tax Rate : f(EBT)2021 Tax Rate : f(EBT)2022 Tax Rate : f(EBT)2023 Tax Rate : f(EBT)2024 Tax Rate : f(EBT)2025 Tax Rate : f(EBT)2026 Tax Rate : f(EBT)2027 Tax Rate : f(EBT)2028 Tax Rate : f(EBT)2029 Tax Rate : f(EBT)2030 Tax Rate : f(EBT)2031 20.000% 2.000% 21.547% 16.931% 17.389% 21.758% 18.819% 17.449% 17.776% 22.680% 18.409% 20.097% 21.316% Taxes: 21.42% ‐769 ‐577 ‐758 ‐520 ‐721 ‐1,619 38 ‐1,508 ‐1,488 ‐934 ‐3,998 Tax Payable Tax Payable Tax Payable Tax Payable Tax Payable Tax Payable Tax Payable Tax Payable Tax Payable Tax Payable Tax Payable NET EARNINGS: 9.52% 2,802 2,832 3,601 1,871 3,110 7,661 ‐175 404 6,593 3,713 14,756 D&A Add‐Back: 10.65% 3,962 4,356 4,301 4,123 4,450 4,771 4,467 4,748 5,095 6,516 5,983 Capital Expenditures : f(Revenue)2021 Capital Expenditures : f(Revenue)2022 Capital Expenditures : f(Revenue)2023 Capital Expenditures : f(Revenue)2024 Capital Expenditures : f(Revenue)2025 Capital Expenditures : f(Revenue)2026 Capital Expenditures : f(Revenue)2027 Capital Expenditures : f(Revenue)2028 Capital Expenditures : f(Revenue)2029 Capital Expenditures : f(Revenue)2030 Capital Expenditures : f(Revenue)2031 10.000% 1.000% 11.633% 8.401% 10.519% 9.928% 10.519% 10.769% 8.684% 9.788% 10.310% 10.135% 7.468% CAP EX: 9.76% ‐4,030 ‐3,056 ‐4,024 ‐4,027 ‐4,463 ‐4,781 ‐4,032 ‐4,788 ‐5,339 ‐5,552 ‐4,266 Δ Working Capital : f(Revenue)2021 Δ Working Capital : f(Revenue)2022 Δ Working Capital : f(Revenue)2023 Δ Working Capital : f(Revenue)2024 Δ Working Capital : f(Revenue)2025 Δ Working Capital : f(Revenue)2026 Δ Working Capital : f(Revenue)2027 Δ Working Capital : f(Revenue)2028 Δ Working Capital : f(Revenue)2029 Δ Working Capital : f(Revenue)2030 Δ Working Capital : f(Revenue)2031 0.000% 0.000% 0.000% 0.000% 0.000% 0.000% 0.000% 0.000% 0.000% 0.000% 0.000% 0.000% 0.000% Δ WRK CAP: 0.00% 0 0 0 0 0 0 0 0 0 0 0 Equity Minority Interest : f(Revenue)2021 Equity Minority Interest : f(Revenue)2022 Equity Minority Interest : f(Revenue)2023 Equity Minority Interest : f(Revenue)2024 Equity Minority Interest : f(Revenue)2025 Equity Minority Interest : f(Revenue)2026 Equity Minority Interest : f(Revenue)2027 Equity Minority Interest : f(Revenue)2028 Equity Minority Interest : f(Revenue)2029 Equity Minority Interest : f(Revenue)2030 Equity Minority Interest : f(Revenue)2031 0.000% 0.000% 0.000% 0.000% 0.000% 0.000% 0.000% 0.000% 0.000% 0.000% 0.000% 0.000% 0.000% EARN AFFL: 0.00% 0 0 0 0 0 0 0 0 0 0 0 ‐97,859 LESS CURRENT DEBT AND OTHER LONG-TERM LIABILITIES T₀ (Adjusted for Carrying Costs ) 0 LESS PREFERRED AT PAR T₀ 1,307 EXCESS CASH & SHORT-TERM SECURITIES T₀ GROWTH 2.500% DCF analysis will deduct the total value of liabilities from the firm's cash position. PERPETUITY VALUE FCF to Equity 2,733 4,131 3,878 1,966 3,098 7,651 261 364 6,350 4,678 16,473 1,215,288 WACC FOR SIMULATION 3.889% 0.078% To assess liquidity at T₀, DCF analysis will deduct Balance Sheet Liabilities from Cash + Short‐term securities. 3.675% DCF to the Investors 731,365 DCF analysis will deduct the total value of liabilities from the firm's cash position. EXC: Exelon Corporation: Monte Carlo: Valuation Per Share | $USD 747.695 PER SHARE Beharry, Lyndon Martin W. 2021‐12‐10_EXC‐MC‐Equity|DCF All Variable_MC 12/13/2021 09:04 Page 1 of 3
- 13. Equity Valuation 2021‐12‐10_EXC‐MC‐Equity Financial Statement Review EXC: Exelon Corporation: Monte Carlo: Valuation Per Share | $USD Mask Monetary Values In 1,000,000 $USD (Except Per Share Values). 1,000,000 $USD Revenue Growth Rate2021 Revenue Growth Rate2022 Revenue Growth Rate2023 Revenue Growth Rate2024 Revenue Growth Rate2025 Revenue Growth Rate2026 Revenue Growth Rate2027 Revenue Growth Rate2028 Revenue Growth Rate2029 Revenue Growth Rate2030 Revenue Growth Rate2031 Projection Base [FY] Year T0 2020 2020 2021 2022 2023 2024 2025 2026 2027 2028 2029 2030 2031 Mean STDEV 0 1 2 3 4 5 6 7 8 9 10 Revenue Growth Rate 2021 00.0% Revenue Growth Rate 2022 00.0% Revenue Growth Rate 2023 00.0% Revenue Growth Rate 2024 00.0% Revenue Growth Rate 2025 00.0% Revenue Growth Rate 2026 00.0% Revenue Growth Rate 2027 00.0% Revenue Growth Rate 2028 00.0% Revenue Growth Rate 2029 00.0% Revenue Growth Rate 2030 00.0% Revenue Growth Rate 2031 00.0% 5.000% 0.500% Random Growth Rate 4.91% 4.84% 5.42% 4.68% 4.88% 5.04% 5.27% 5.02% 5.28% 4.88% 5.50% Sequential Reduction 0.000% Alternate Coefficient of Variability 10.00% 5.00% 5.00% 5.00% 5.00% 5.00% 5.00% 5.00% 5.00% 5.00% 5.00% 5.00% Timet0 Timet+1 Timet+2 Timet+3 Timet+4 Timet+5 Timet+6 Timet+7 Timet+8 Timet+9 Timet+10 Timet+11 Projection TimeT1 34,691 MONTE CARLO REVENUE 34,660 36,336 38,307 40,101 42,056 44,178 46,508 48,841 51,419 53,929 56,895 CoGS : f(Revenue)2021 CoGS : f(Revenue)2022 CoGS : f(Revenue)2023 CoGS : f(Revenue)2024 CoGS : f(Revenue)2025 CoGS : f(Revenue)2026 CoGS : f(Revenue)2027 CoGS : f(Revenue)2028 CoGS : f(Revenue)2029 CoGS : f(Revenue)2030 CoGS : f(Revenue)2031 77.080% 7.708% 84.272% 77.536% 74.195% 63.489% 83.095% 70.465% 91.266% 78.718% 74.705% 87.532% 82.457% CoGS: 79.23% ‐29,208 ‐28,174 ‐28,422 ‐25,460 ‐34,947 ‐31,130 ‐42,446 ‐38,446 ‐38,413 ‐47,205 ‐46,914 Depreciation/Amortization [COGs] : f(Revenue)2021 Depreciation/Amortization [COGs] : f(Revenue)2022 Depreciation/Amortization [COGs] : f(Revenue)2023 Depreciation/Amortization [COGs] : f(Revenue)2024 Depreciation/Amortization [COGs] : f(Revenue)2025 Depreciation/Amortization [COGs] : f(Revenue)2026 Depreciation/Amortization [COGs] : f(Revenue)2027 Depreciation/Amortization [COGs] : f(Revenue)2028 Depreciation/Amortization [COGs] : f(Revenue)2029 Depreciation/Amortization [COGs] : f(Revenue)2030 Depreciation/Amortization [COGs] : f(Revenue)2031 10.771% 1.077% 13.704% 12.118% 9.729% 9.820% 8.371% 10.878% 9.054% 9.975% 11.077% 11.782% 12.062% D&A (Production): 10.77% ‐4,750 ‐4,403 ‐3,727 ‐3,938 ‐3,521 ‐4,806 ‐4,211 ‐4,872 ‐5,696 ‐6,354 ‐6,863 GROSS MARGIN: 10.00% 702 3,760 6,158 10,703 3,589 8,242 ‐149 5,522 7,311 370 3,118 SGA (Only) : f(Revenue)2021 SGA (Only) : f(Revenue)2022 SGA (Only) : f(Revenue)2023 SGA (Only) : f(Revenue)2024 SGA (Only) : f(Revenue)2025 SGA (Only) : f(Revenue)2026 SGA (Only) : f(Revenue)2027 SGA (Only) : f(Revenue)2028 SGA (Only) : f(Revenue)2029 SGA (Only) : f(Revenue)2030 SGA (Only) : f(Revenue)2031 0.000% 0.000% Administrative Costs: 0.000% 0.000% 0.000% 0.000% 0.000% 0.000% 0.000% 0.000% 0.000% 0.000% 0.000% SGA: 0.00% 0 0 0 0 0 0 0 0 0 0 0 R&D : f(Revenue)2021 R&D : f(Revenue)2022 R&D : f(Revenue)2023 R&D : f(Revenue)2024 R&D : f(Revenue)2025 R&D : f(Revenue)2026 R&D : f(Revenue)2027 R&D : f(Revenue)2028 R&D : f(Revenue)2029 R&D : f(Revenue)2030 R&D : f(Revenue)2031 0.000% 0.000% 0.000% 0.000% 0.000% 0.000% 0.000% 0.000% 0.000% 0.000% 0.000% 0.000% 0.000% R & D: 0.00% 0 0 0 0 0 0 0 0 0 0 0 Depreciation/Amortization [SGA] : f(Revenue)2021 Depreciation/Amortization [SGA] : f(Revenue)2022 Depreciation/Amortization [SGA] : f(Revenue)2023 Depreciation/Amortization [SGA] : f(Revenue)2024 Depreciation/Amortization [SGA] : f(Revenue)2025 Depreciation/Amortization [SGA] : f(Revenue)2026 Depreciation/Amortization [SGA] : f(Revenue)2027 Depreciation/Amortization [SGA] : f(Revenue)2028 Depreciation/Amortization [SGA] : f(Revenue)2029 Depreciation/Amortization [SGA] : f(Revenue)2030 Depreciation/Amortization [SGA] : f(Revenue)2031 0.000% 0.000% 0.000% 0.000% 0.000% 0.000% 0.000% 0.000% 0.000% 0.000% 0.000% 0.000% 0.000% D & A [SGA]: 0.00% 0 0 0 0 0 0 0 0 0 0 0 Admin Expenses: 0.00% 0 0 0 0 0 0 0 0 0 0 0 Other Expense (Income); Overhead : f(Revenue)2021 Other Expense (Income); Overhead : f(Revenue)2022 Other Expense (Income); Overhead : f(Revenue)2023 Other Expense (Income); Overhead : f(Revenue)2024 Other Expense (Income); Overhead : f(Revenue)2025 Other Expense (Income); Overhead : f(Revenue)2026 Other Expense (Income); Overhead : f(Revenue)2027 Other Expense (Income); Overhead : f(Revenue)2028 Other Expense (Income); Overhead : f(Revenue)2029 Other Expense (Income); Overhead : f(Revenue)2030 Other Expense (Income); Overhead : f(Revenue)2031 -2.081% 0.208% ‐2.166% ‐2.277% ‐1.880% ‐2.271% ‐1.773% ‐1.999% ‐2.225% ‐2.134% ‐1.671% ‐1.947% ‐2.126% Other: ‐2.03% 751 828 720 911 745 883 1,035 1,042 859 1,050 1,209 EBIT: 12.03% 1,452 4,587 6,878 11,614 4,335 9,125 886 6,564 8,170 1,420 4,328 Interest Expense (Income) : f(Revenue)2021 Interest Expense (Income) : f(Revenue)2022 Interest Expense (Income) : f(Revenue)2023 Interest Expense (Income) : f(Revenue)2024 Interest Expense (Income) : f(Revenue)2025 Interest Expense (Income) : f(Revenue)2026 Interest Expense (Income) : f(Revenue)2027 Interest Expense (Income) : f(Revenue)2028 Interest Expense (Income) : f(Revenue)2029 Interest Expense (Income) : f(Revenue)2030 Interest Expense (Income) : f(Revenue)2031 1.250% 0.125% 1.111% 1.381% 1.309% 1.381% 1.267% 1.097% 1.376% 1.294% 1.220% 1.322% 1.173% Interest Expense: 1.27% ‐385 ‐502 ‐502 ‐554 ‐533 ‐485 ‐640 ‐632 ‐627 ‐713 ‐668 EBT: 10.77% 1,067 4,085 6,377 11,060 3,802 8,641 246 5,933 7,543 707 3,660 Tax Rate : f(EBT)2021 Tax Rate : f(EBT)2022 Tax Rate : f(EBT)2023 Tax Rate : f(EBT)2024 Tax Rate : f(EBT)2025 Tax Rate : f(EBT)2026 Tax Rate : f(EBT)2027 Tax Rate : f(EBT)2028 Tax Rate : f(EBT)2029 Tax Rate : f(EBT)2030 Tax Rate : f(EBT)2031 20.000% 2.000% 17.964% 17.701% 15.354% 21.596% 19.672% 21.907% 23.871% 17.143% 19.944% 20.352% 17.611% Taxes: 19.37% ‐192 ‐723 ‐979 ‐2,388 ‐748 ‐1,893 ‐59 ‐1,017 ‐1,504 ‐144 ‐645 Tax Payable Tax Payable Tax Payable Tax Payable Tax Payable Tax Payable Tax Payable Tax Payable Tax Payable Tax Payable Tax Payable NET EARNINGS: 8.68% 875 3,362 5,398 8,671 3,054 6,748 188 4,916 6,038 563 3,016 D&A Add‐Back: 10.77% 4,750 4,403 3,727 3,938 3,521 4,806 4,211 4,872 5,696 6,354 6,863 Capital Expenditures : f(Revenue)2021 Capital Expenditures : f(Revenue)2022 Capital Expenditures : f(Revenue)2023 Capital Expenditures : f(Revenue)2024 Capital Expenditures : f(Revenue)2025 Capital Expenditures : f(Revenue)2026 Capital Expenditures : f(Revenue)2027 Capital Expenditures : f(Revenue)2028 Capital Expenditures : f(Revenue)2029 Capital Expenditures : f(Revenue)2030 Capital Expenditures : f(Revenue)2031 10.000% 1.000% 10.287% 9.434% 8.213% 10.567% 9.699% 9.315% 9.728% 10.101% 9.224% 9.759% 9.365% CAP EX: 9.60% ‐3,565 ‐3,428 ‐3,146 ‐4,237 ‐4,079 ‐4,115 ‐4,525 ‐4,933 ‐4,743 ‐5,263 ‐5,328 Δ Working Capital : f(Revenue)2021 Δ Working Capital : f(Revenue)2022 Δ Working Capital : f(Revenue)2023 Δ Working Capital : f(Revenue)2024 Δ Working Capital : f(Revenue)2025 Δ Working Capital : f(Revenue)2026 Δ Working Capital : f(Revenue)2027 Δ Working Capital : f(Revenue)2028 Δ Working Capital : f(Revenue)2029 Δ Working Capital : f(Revenue)2030 Δ Working Capital : f(Revenue)2031 0.000% 0.000% 0.000% 0.000% 0.000% 0.000% 0.000% 0.000% 0.000% 0.000% 0.000% 0.000% 0.000% Δ WRK CAP: 0.00% 0 0 0 0 0 0 0 0 0 0 0 Equity Minority Interest : f(Revenue)2021 Equity Minority Interest : f(Revenue)2022 Equity Minority Interest : f(Revenue)2023 Equity Minority Interest : f(Revenue)2024 Equity Minority Interest : f(Revenue)2025 Equity Minority Interest : f(Revenue)2026 Equity Minority Interest : f(Revenue)2027 Equity Minority Interest : f(Revenue)2028 Equity Minority Interest : f(Revenue)2029 Equity Minority Interest : f(Revenue)2030 Equity Minority Interest : f(Revenue)2031 0.000% 0.000% 0.000% 0.000% 0.000% 0.000% 0.000% 0.000% 0.000% 0.000% 0.000% 0.000% 0.000% EARN AFFL: 0.00% 0 0 0 0 0 0 0 0 0 0 0 ‐97,859 LESS CURRENT DEBT AND OTHER LONG-TERM LIABILITIES T₀ (Adjusted for Carrying Costs ) 0 LESS PREFERRED AT PAR T₀ 1,307 EXCESS CASH & SHORT-TERM SECURITIES T₀ GROWTH 2.500% DCF analysis will deduct the total value of liabilities from the firm's cash position. PERPETUITY VALUE FCF to Equity 2,060 4,337 5,978 8,372 2,496 7,438 ‐126 4,854 6,991 1,654 4,550 335,672 WACC FOR SIMULATION 3.889% 0.078% To assess liquidity at T₀, DCF analysis will deduct Balance Sheet Liabilities from Cash + Short‐term securities. 3.915% DCF to the Investors 154,166 DCF analysis will deduct the total value of liabilities from the firm's cash position. EXC: Exelon Corporation: Monte Carlo: Valuation Per Share | $USD 157.608 PER SHARE Beharry, Lyndon Martin W. 2021‐12‐10_EXC‐MC‐Equity|DCF All Variable_MC 12/13/2021 09:05 Page 1 of 3
- 14. Equity Valuation 2021‐12‐10_EXC‐MC‐Equity Financial Statement Review EXC: Exelon Corporation: Monte Carlo: Valuation Per Share | $USD Mask Monetary Values In 1,000,000 $USD (Except Per Share Values). 1,000,000 $USD Revenue Growth Rate2021 Revenue Growth Rate2022 Revenue Growth Rate2023 Revenue Growth Rate2024 Revenue Growth Rate2025 Revenue Growth Rate2026 Revenue Growth Rate2027 Revenue Growth Rate2028 Revenue Growth Rate2029 Revenue Growth Rate2030 Revenue Growth Rate2031 Projection Base [FY] Year T0 2020 2020 2021 2022 2023 2024 2025 2026 2027 2028 2029 2030 2031 Mean STDEV 0 1 2 3 4 5 6 7 8 9 10 Revenue Growth Rate 2021 00.0% Revenue Growth Rate 2022 00.0% Revenue Growth Rate 2023 00.0% Revenue Growth Rate 2024 00.0% Revenue Growth Rate 2025 00.0% Revenue Growth Rate 2026 00.0% Revenue Growth Rate 2027 00.0% Revenue Growth Rate 2028 00.0% Revenue Growth Rate 2029 00.0% Revenue Growth Rate 2030 00.0% Revenue Growth Rate 2031 00.0% 5.000% 0.500% Random Growth Rate 4.91% 4.84% 5.42% 4.68% 4.88% 5.04% 5.27% 5.02% 5.28% 4.88% 5.50% Sequential Reduction 0.000% Alternate Coefficient of Variability 10.00% 5.00% 5.00% 5.00% 5.00% 5.00% 5.00% 5.00% 5.00% 5.00% 5.00% 5.00% Timet0 Timet+1 Timet+2 Timet+3 Timet+4 Timet+5 Timet+6 Timet+7 Timet+8 Timet+9 Timet+10 Timet+11 Projection TimeT1 34,691 MONTE CARLO REVENUE 34,660 36,336 38,307 40,101 42,056 44,178 46,508 48,841 51,419 53,929 56,895 CoGS : f(Revenue)2021 CoGS : f(Revenue)2022 CoGS : f(Revenue)2023 CoGS : f(Revenue)2024 CoGS : f(Revenue)2025 CoGS : f(Revenue)2026 CoGS : f(Revenue)2027 CoGS : f(Revenue)2028 CoGS : f(Revenue)2029 CoGS : f(Revenue)2030 CoGS : f(Revenue)2031 77.080% 7.708% 84.272% 77.536% 74.195% 63.489% 83.095% 70.465% 91.266% 78.718% 74.705% 87.532% 82.457% CoGS: 79.23% ‐29,208 ‐28,174 ‐28,422 ‐25,460 ‐34,947 ‐31,130 ‐42,446 ‐38,446 ‐38,413 ‐47,205 ‐46,914 Depreciation/Amortization [COGs] : f(Revenue)2021 Depreciation/Amortization [COGs] : f(Revenue)2022 Depreciation/Amortization [COGs] : f(Revenue)2023 Depreciation/Amortization [COGs] : f(Revenue)2024 Depreciation/Amortization [COGs] : f(Revenue)2025 Depreciation/Amortization [COGs] : f(Revenue)2026 Depreciation/Amortization [COGs] : f(Revenue)2027 Depreciation/Amortization [COGs] : f(Revenue)2028 Depreciation/Amortization [COGs] : f(Revenue)2029 Depreciation/Amortization [COGs] : f(Revenue)2030 Depreciation/Amortization [COGs] : f(Revenue)2031 10.771% 1.077% 13.704% 12.118% 9.729% 9.820% 8.371% 10.878% 9.054% 9.975% 11.077% 11.782% 12.062% D&A (Production): 10.77% ‐4,750 ‐4,403 ‐3,727 ‐3,938 ‐3,521 ‐4,806 ‐4,211 ‐4,872 ‐5,696 ‐6,354 ‐6,863 GROSS MARGIN: 10.00% 702 3,760 6,158 10,703 3,589 8,242 ‐149 5,522 7,311 370 3,118 SGA (Only) : f(Revenue)2021 SGA (Only) : f(Revenue)2022 SGA (Only) : f(Revenue)2023 SGA (Only) : f(Revenue)2024 SGA (Only) : f(Revenue)2025 SGA (Only) : f(Revenue)2026 SGA (Only) : f(Revenue)2027 SGA (Only) : f(Revenue)2028 SGA (Only) : f(Revenue)2029 SGA (Only) : f(Revenue)2030 SGA (Only) : f(Revenue)2031 0.000% 0.000% Administrative Costs: 0.000% 0.000% 0.000% 0.000% 0.000% 0.000% 0.000% 0.000% 0.000% 0.000% 0.000% SGA: 0.00% 0 0 0 0 0 0 0 0 0 0 0 R&D : f(Revenue)2021 R&D : f(Revenue)2022 R&D : f(Revenue)2023 R&D : f(Revenue)2024 R&D : f(Revenue)2025 R&D : f(Revenue)2026 R&D : f(Revenue)2027 R&D : f(Revenue)2028 R&D : f(Revenue)2029 R&D : f(Revenue)2030 R&D : f(Revenue)2031 0.000% 0.000% 0.000% 0.000% 0.000% 0.000% 0.000% 0.000% 0.000% 0.000% 0.000% 0.000% 0.000% R & D: 0.00% 0 0 0 0 0 0 0 0 0 0 0 Depreciation/Amortization [SGA] : f(Revenue)2021 Depreciation/Amortization [SGA] : f(Revenue)2022 Depreciation/Amortization [SGA] : f(Revenue)2023 Depreciation/Amortization [SGA] : f(Revenue)2024 Depreciation/Amortization [SGA] : f(Revenue)2025 Depreciation/Amortization [SGA] : f(Revenue)2026 Depreciation/Amortization [SGA] : f(Revenue)2027 Depreciation/Amortization [SGA] : f(Revenue)2028 Depreciation/Amortization [SGA] : f(Revenue)2029 Depreciation/Amortization [SGA] : f(Revenue)2030 Depreciation/Amortization [SGA] : f(Revenue)2031 0.000% 0.000% 0.000% 0.000% 0.000% 0.000% 0.000% 0.000% 0.000% 0.000% 0.000% 0.000% 0.000% D & A [SGA]: 0.00% 0 0 0 0 0 0 0 0 0 0 0 Admin Expenses: 0.00% 0 0 0 0 0 0 0 0 0 0 0 Other Expense (Income); Overhead : f(Revenue)2021 Other Expense (Income); Overhead : f(Revenue)2022 Other Expense (Income); Overhead : f(Revenue)2023 Other Expense (Income); Overhead : f(Revenue)2024 Other Expense (Income); Overhead : f(Revenue)2025 Other Expense (Income); Overhead : f(Revenue)2026 Other Expense (Income); Overhead : f(Revenue)2027 Other Expense (Income); Overhead : f(Revenue)2028 Other Expense (Income); Overhead : f(Revenue)2029 Other Expense (Income); Overhead : f(Revenue)2030 Other Expense (Income); Overhead : f(Revenue)2031 -2.081% 0.208% ‐2.166% ‐2.277% ‐1.880% ‐2.271% ‐1.773% ‐1.999% ‐2.225% ‐2.134% ‐1.671% ‐1.947% ‐2.126% Other: ‐2.03% 751 828 720 911 745 883 1,035 1,042 859 1,050 1,209 EBIT: 12.03% 1,452 4,587 6,878 11,614 4,335 9,125 886 6,564 8,170 1,420 4,328 Interest Expense (Income) : f(Revenue)2021 Interest Expense (Income) : f(Revenue)2022 Interest Expense (Income) : f(Revenue)2023 Interest Expense (Income) : f(Revenue)2024 Interest Expense (Income) : f(Revenue)2025 Interest Expense (Income) : f(Revenue)2026 Interest Expense (Income) : f(Revenue)2027 Interest Expense (Income) : f(Revenue)2028 Interest Expense (Income) : f(Revenue)2029 Interest Expense (Income) : f(Revenue)2030 Interest Expense (Income) : f(Revenue)2031 1.250% 0.125% 1.111% 1.381% 1.309% 1.381% 1.267% 1.097% 1.376% 1.294% 1.220% 1.322% 1.173% Interest Expense: 1.27% ‐385 ‐502 ‐502 ‐554 ‐533 ‐485 ‐640 ‐632 ‐627 ‐713 ‐668 EBT: 10.77% 1,067 4,085 6,377 11,060 3,802 8,641 246 5,933 7,543 707 3,660 Tax Rate : f(EBT)2021 Tax Rate : f(EBT)2022 Tax Rate : f(EBT)2023 Tax Rate : f(EBT)2024 Tax Rate : f(EBT)2025 Tax Rate : f(EBT)2026 Tax Rate : f(EBT)2027 Tax Rate : f(EBT)2028 Tax Rate : f(EBT)2029 Tax Rate : f(EBT)2030 Tax Rate : f(EBT)2031 20.000% 2.000% 17.964% 17.701% 15.354% 21.596% 19.672% 21.907% 23.871% 17.143% 19.944% 20.352% 17.611% Taxes: 19.37% ‐192 ‐723 ‐979 ‐2,388 ‐748 ‐1,893 ‐59 ‐1,017 ‐1,504 ‐144 ‐645 Tax Payable Tax Payable Tax Payable Tax Payable Tax Payable Tax Payable Tax Payable Tax Payable Tax Payable Tax Payable Tax Payable NET EARNINGS: 8.68% 875 3,362 5,398 8,671 3,054 6,748 188 4,916 6,038 563 3,016 D&A Add‐Back: 10.77% 4,750 4,403 3,727 3,938 3,521 4,806 4,211 4,872 5,696 6,354 6,863 Capital Expenditures : f(Revenue)2021 Capital Expenditures : f(Revenue)2022 Capital Expenditures : f(Revenue)2023 Capital Expenditures : f(Revenue)2024 Capital Expenditures : f(Revenue)2025 Capital Expenditures : f(Revenue)2026 Capital Expenditures : f(Revenue)2027 Capital Expenditures : f(Revenue)2028 Capital Expenditures : f(Revenue)2029 Capital Expenditures : f(Revenue)2030 Capital Expenditures : f(Revenue)2031 10.000% 1.000% 10.287% 9.434% 8.213% 10.567% 9.699% 9.315% 9.728% 10.101% 9.224% 9.759% 9.365% CAP EX: 9.60% ‐3,565 ‐3,428 ‐3,146 ‐4,237 ‐4,079 ‐4,115 ‐4,525 ‐4,933 ‐4,743 ‐5,263 ‐5,328 Δ Working Capital : f(Revenue)2021 Δ Working Capital : f(Revenue)2022 Δ Working Capital : f(Revenue)2023 Δ Working Capital : f(Revenue)2024 Δ Working Capital : f(Revenue)2025 Δ Working Capital : f(Revenue)2026 Δ Working Capital : f(Revenue)2027 Δ Working Capital : f(Revenue)2028 Δ Working Capital : f(Revenue)2029 Δ Working Capital : f(Revenue)2030 Δ Working Capital : f(Revenue)2031 0.000% 0.000% 0.000% 0.000% 0.000% 0.000% 0.000% 0.000% 0.000% 0.000% 0.000% 0.000% 0.000% Δ WRK CAP: 0.00% 0 0 0 0 0 0 0 0 0 0 0 Equity Minority Interest : f(Revenue)2021 Equity Minority Interest : f(Revenue)2022 Equity Minority Interest : f(Revenue)2023 Equity Minority Interest : f(Revenue)2024 Equity Minority Interest : f(Revenue)2025 Equity Minority Interest : f(Revenue)2026 Equity Minority Interest : f(Revenue)2027 Equity Minority Interest : f(Revenue)2028 Equity Minority Interest : f(Revenue)2029 Equity Minority Interest : f(Revenue)2030 Equity Minority Interest : f(Revenue)2031 0.000% 0.000% 0.000% 0.000% 0.000% 0.000% 0.000% 0.000% 0.000% 0.000% 0.000% 0.000% 0.000% EARN AFFL: 0.00% 0 0 0 0 0 0 0 0 0 0 0 ‐97,859 LESS CURRENT DEBT AND OTHER LONG-TERM LIABILITIES T₀ (Adjusted for Carrying Costs ) 0 LESS PREFERRED AT PAR T₀ 1,307 EXCESS CASH & SHORT-TERM SECURITIES T₀ GROWTH 2.500% DCF analysis will deduct the total value of liabilities from the firm's cash position. PERPETUITY VALUE FCF to Equity 2,060 4,337 5,978 8,372 2,496 7,438 ‐126 4,854 6,991 1,654 4,550 335,672 WACC FOR SIMULATION 3.889% 0.078% To assess liquidity at T₀, DCF analysis will deduct Balance Sheet Liabilities from Cash + Short‐term securities. 3.915% DCF to the Investors 154,166 DCF analysis will deduct the total value of liabilities from the firm's cash position. EXC: Exelon Corporation: Monte Carlo: Valuation Per Share | $USD 157.608 PER SHARE Beharry, Lyndon Martin W. 2021‐12‐10_EXC‐MC‐Equity|DCF All Variable_MC 12/13/2021 09:05 Page 1 of 3
- 15. Equity Valuation 2021‐12‐10_EXC‐MC‐Equity Financial Statement Review EXC: Exelon Corporation: Monte Carlo: Valuation Per Share | $USD Mask Monetary Values In 1,000,000 $USD (Except Per Share Values). 1,000,000 $USD Revenue Growth Rate2021 Revenue Growth Rate2022 Revenue Growth Rate2023 Revenue Growth Rate2024 Revenue Growth Rate2025 Revenue Growth Rate2026 Revenue Growth Rate2027 Revenue Growth Rate2028 Revenue Growth Rate2029 Revenue Growth Rate2030 Revenue Growth Rate2031 Projection Base [FY] Year T0 2020 2020 2021 2022 2023 2024 2025 2026 2027 2028 2029 2030 2031 Mean STDEV 0 1 2 3 4 5 6 7 8 9 10 Revenue Growth Rate 2021 00.0% Revenue Growth Rate 2022 00.0% Revenue Growth Rate 2023 00.0% Revenue Growth Rate 2024 00.0% Revenue Growth Rate 2025 00.0% Revenue Growth Rate 2026 00.0% Revenue Growth Rate 2027 00.0% Revenue Growth Rate 2028 00.0% Revenue Growth Rate 2029 00.0% Revenue Growth Rate 2030 00.0% Revenue Growth Rate 2031 00.0% 5.000% 0.500% Random Growth Rate 4.68% 5.61% 5.20% 5.79% 4.57% 4.85% 5.59% 3.93% 5.49% 4.49% 4.31% Sequential Reduction 0.000% Alternate Coefficient of Variability 10.00% 5.00% 5.00% 5.00% 5.00% 5.00% 5.00% 5.00% 5.00% 5.00% 5.00% 5.00% Timet0 Timet+1 Timet+2 Timet+3 Timet+4 Timet+5 Timet+6 Timet+7 Timet+8 Timet+9 Timet+10 Timet+11 Projection TimeT1 34,691 MONTE CARLO REVENUE 34,584 36,524 38,424 40,648 42,505 44,565 47,057 48,908 51,593 53,908 56,230 CoGS : f(Revenue)2021 CoGS : f(Revenue)2022 CoGS : f(Revenue)2023 CoGS : f(Revenue)2024 CoGS : f(Revenue)2025 CoGS : f(Revenue)2026 CoGS : f(Revenue)2027 CoGS : f(Revenue)2028 CoGS : f(Revenue)2029 CoGS : f(Revenue)2030 CoGS : f(Revenue)2031 77.080% 7.708% 82.520% 71.240% 89.354% 75.704% 68.414% 78.888% 75.635% 79.158% 72.515% 70.751% 79.220% CoGS: 76.43% ‐28,539 ‐26,020 ‐34,333 ‐30,772 ‐29,079 ‐35,157 ‐35,592 ‐38,715 ‐37,413 ‐38,140 ‐44,546 Depreciation/Amortization [COGs] : f(Revenue)2021 Depreciation/Amortization [COGs] : f(Revenue)2022 Depreciation/Amortization [COGs] : f(Revenue)2023 Depreciation/Amortization [COGs] : f(Revenue)2024 Depreciation/Amortization [COGs] : f(Revenue)2025 Depreciation/Amortization [COGs] : f(Revenue)2026 Depreciation/Amortization [COGs] : f(Revenue)2027 Depreciation/Amortization [COGs] : f(Revenue)2028 Depreciation/Amortization [COGs] : f(Revenue)2029 Depreciation/Amortization [COGs] : f(Revenue)2030 Depreciation/Amortization [COGs] : f(Revenue)2031 10.771% 1.077% 10.934% 11.227% 11.493% 10.880% 10.669% 8.657% 11.464% 10.509% 11.234% 11.099% 10.173% D&A (Production): 10.74% ‐3,781 ‐4,101 ‐4,416 ‐4,423 ‐4,535 ‐3,858 ‐5,395 ‐5,140 ‐5,796 ‐5,983 ‐5,720 GROSS MARGIN: 12.83% 2,264 6,403 ‐325 5,453 8,891 5,551 6,071 5,054 8,384 9,784 5,964 SGA (Only) : f(Revenue)2021 SGA (Only) : f(Revenue)2022 SGA (Only) : f(Revenue)2023 SGA (Only) : f(Revenue)2024 SGA (Only) : f(Revenue)2025 SGA (Only) : f(Revenue)2026 SGA (Only) : f(Revenue)2027 SGA (Only) : f(Revenue)2028 SGA (Only) : f(Revenue)2029 SGA (Only) : f(Revenue)2030 SGA (Only) : f(Revenue)2031 0.000% 0.000% Administrative Costs: 0.000% 0.000% 0.000% 0.000% 0.000% 0.000% 0.000% 0.000% 0.000% 0.000% 0.000% SGA: 0.00% 0 0 0 0 0 0 0 0 0 0 0 R&D : f(Revenue)2021 R&D : f(Revenue)2022 R&D : f(Revenue)2023 R&D : f(Revenue)2024 R&D : f(Revenue)2025 R&D : f(Revenue)2026 R&D : f(Revenue)2027 R&D : f(Revenue)2028 R&D : f(Revenue)2029 R&D : f(Revenue)2030 R&D : f(Revenue)2031 0.000% 0.000% 0.000% 0.000% 0.000% 0.000% 0.000% 0.000% 0.000% 0.000% 0.000% 0.000% 0.000% R & D: 0.00% 0 0 0 0 0 0 0 0 0 0 0 Depreciation/Amortization [SGA] : f(Revenue)2021 Depreciation/Amortization [SGA] : f(Revenue)2022 Depreciation/Amortization [SGA] : f(Revenue)2023 Depreciation/Amortization [SGA] : f(Revenue)2024 Depreciation/Amortization [SGA] : f(Revenue)2025 Depreciation/Amortization [SGA] : f(Revenue)2026 Depreciation/Amortization [SGA] : f(Revenue)2027 Depreciation/Amortization [SGA] : f(Revenue)2028 Depreciation/Amortization [SGA] : f(Revenue)2029 Depreciation/Amortization [SGA] : f(Revenue)2030 Depreciation/Amortization [SGA] : f(Revenue)2031 0.000% 0.000% 0.000% 0.000% 0.000% 0.000% 0.000% 0.000% 0.000% 0.000% 0.000% 0.000% 0.000% D & A [SGA]: 0.00% 0 0 0 0 0 0 0 0 0 0 0 Admin Expenses: 0.00% 0 0 0 0 0 0 0 0 0 0 0 Other Expense (Income); Overhead : f(Revenue)2021 Other Expense (Income); Overhead : f(Revenue)2022 Other Expense (Income); Overhead : f(Revenue)2023 Other Expense (Income); Overhead : f(Revenue)2024 Other Expense (Income); Overhead : f(Revenue)2025 Other Expense (Income); Overhead : f(Revenue)2026 Other Expense (Income); Overhead : f(Revenue)2027 Other Expense (Income); Overhead : f(Revenue)2028 Other Expense (Income); Overhead : f(Revenue)2029 Other Expense (Income); Overhead : f(Revenue)2030 Other Expense (Income); Overhead : f(Revenue)2031 -2.081% 0.208% ‐2.578% ‐2.185% ‐2.341% ‐2.194% ‐2.152% ‐1.891% ‐1.809% ‐2.019% ‐1.895% ‐2.067% ‐2.291% Other: ‐2.11% 891 798 899 892 915 843 851 987 978 1,114 1,288 EBIT: 14.94% 3,155 7,202 574 6,345 9,805 6,393 6,922 6,041 9,362 10,899 7,252 Interest Expense (Income) : f(Revenue)2021 Interest Expense (Income) : f(Revenue)2022 Interest Expense (Income) : f(Revenue)2023 Interest Expense (Income) : f(Revenue)2024 Interest Expense (Income) : f(Revenue)2025 Interest Expense (Income) : f(Revenue)2026 Interest Expense (Income) : f(Revenue)2027 Interest Expense (Income) : f(Revenue)2028 Interest Expense (Income) : f(Revenue)2029 Interest Expense (Income) : f(Revenue)2030 Interest Expense (Income) : f(Revenue)2031 1.250% 0.125% 1.250% 1.473% 1.218% 1.300% 1.135% 1.213% 1.415% 1.295% 1.216% 1.463% 1.279% Interest Expense: 1.30% ‐432 ‐538 ‐468 ‐529 ‐483 ‐540 ‐666 ‐633 ‐628 ‐789 ‐719 EBT: 13.64% 2,723 6,663 106 5,816 9,323 5,853 6,256 5,408 8,734 10,110 6,533 Tax Rate : f(EBT)2021 Tax Rate : f(EBT)2022 Tax Rate : f(EBT)2023 Tax Rate : f(EBT)2024 Tax Rate : f(EBT)2025 Tax Rate : f(EBT)2026 Tax Rate : f(EBT)2027 Tax Rate : f(EBT)2028 Tax Rate : f(EBT)2029 Tax Rate : f(EBT)2030 Tax Rate : f(EBT)2031 20.000% 2.000% 23.544% 21.562% 19.593% 20.386% 20.033% 19.830% 18.492% 18.938% 17.366% 20.622% 19.503% Taxes: 19.80% ‐641 ‐1,437 ‐21 ‐1,186 ‐1,868 ‐1,161 ‐1,157 ‐1,024 ‐1,517 ‐2,085 ‐1,274 Tax Payable Tax Payable Tax Payable Tax Payable Tax Payable Tax Payable Tax Payable Tax Payable Tax Payable Tax Payable Tax Payable NET EARNINGS: 10.94% 2,082 5,227 85 4,631 7,455 4,692 5,099 4,384 7,218 8,025 5,259 D&A Add‐Back: 10.74% 3,781 4,101 4,416 4,423 4,535 3,858 5,395 5,140 5,796 5,983 5,720 Capital Expenditures : f(Revenue)2021 Capital Expenditures : f(Revenue)2022 Capital Expenditures : f(Revenue)2023 Capital Expenditures : f(Revenue)2024 Capital Expenditures : f(Revenue)2025 Capital Expenditures : f(Revenue)2026 Capital Expenditures : f(Revenue)2027 Capital Expenditures : f(Revenue)2028 Capital Expenditures : f(Revenue)2029 Capital Expenditures : f(Revenue)2030 Capital Expenditures : f(Revenue)2031 10.000% 1.000% 10.504% 7.954% 10.326% 8.932% 10.485% 10.534% 8.971% 10.703% 8.862% 10.357% 9.526% CAP EX: 9.75% ‐3,633 ‐2,905 ‐3,968 ‐3,631 ‐4,457 ‐4,694 ‐4,222 ‐5,235 ‐4,572 ‐5,583 ‐5,357 Δ Working Capital : f(Revenue)2021 Δ Working Capital : f(Revenue)2022 Δ Working Capital : f(Revenue)2023 Δ Working Capital : f(Revenue)2024 Δ Working Capital : f(Revenue)2025 Δ Working Capital : f(Revenue)2026 Δ Working Capital : f(Revenue)2027 Δ Working Capital : f(Revenue)2028 Δ Working Capital : f(Revenue)2029 Δ Working Capital : f(Revenue)2030 Δ Working Capital : f(Revenue)2031 0.000% 0.000% 0.000% 0.000% 0.000% 0.000% 0.000% 0.000% 0.000% 0.000% 0.000% 0.000% 0.000% Δ WRK CAP: 0.00% 0 0 0 0 0 0 0 0 0 0 0 Equity Minority Interest : f(Revenue)2021 Equity Minority Interest : f(Revenue)2022 Equity Minority Interest : f(Revenue)2023 Equity Minority Interest : f(Revenue)2024 Equity Minority Interest : f(Revenue)2025 Equity Minority Interest : f(Revenue)2026 Equity Minority Interest : f(Revenue)2027 Equity Minority Interest : f(Revenue)2028 Equity Minority Interest : f(Revenue)2029 Equity Minority Interest : f(Revenue)2030 Equity Minority Interest : f(Revenue)2031 0.000% 0.000% 0.000% 0.000% 0.000% 0.000% 0.000% 0.000% 0.000% 0.000% 0.000% 0.000% 0.000% EARN AFFL: 0.00% 0 0 0 0 0 0 0 0 0 0 0 ‐97,859 LESS CURRENT DEBT AND OTHER LONG-TERM LIABILITIES T₀ (Adjusted for Carrying Costs ) 0 LESS PREFERRED AT PAR T₀ 1,307 EXCESS CASH & SHORT-TERM SECURITIES T₀ GROWTH 2.500% DCF analysis will deduct the total value of liabilities from the firm's cash position. PERPETUITY VALUE FCF to Equity 2,230 6,422 533 5,423 7,534 3,856 6,272 4,289 8,442 8,425 5,623 414,817 WACC FOR SIMULATION 3.889% 0.078% To assess liquidity at T₀, DCF analysis will deduct Balance Sheet Liabilities from Cash + Short‐term securities. 3.887% DCF to the Investors 211,876 DCF analysis will deduct the total value of liabilities from the firm's cash position. EXC: Exelon Corporation: Monte Carlo: Valuation Per Share | $USD 216.607 PER SHARE Beharry, Lyndon Martin W. 2021‐12‐10_EXC‐MC‐Equity|DCF All Variable_MC 12/13/2021 09:05 Page 1 of 3
- 16. Equity Valuation 2021‐12‐10_EXC‐MC‐Equity Financial Statement Review EXC: Exelon Corporation: Monte Carlo: Valuation Per Share | $USD Frequency Distribution Forecast Namer Share | $USD 17.83 Trials 500,000 30.66 Mean 247.35 Median 247.10 Mode ‐‐‐ Standard Deviation 171.93 Variance 29,561.07 Skewness 0.0116 Kurtosis 3.02 Coeff. of Variation 0.6951 Minimum ‐603.27 Maximum 1,048.24 Mean Std. Error 0.2432 0% ‐603.27 10% 27.41 20% 102.60 30% 157.07 40% 203.44 50% 247.10 60% 290.56 70% 337.19 80% 391.73 90% 467.42 100% 1,048.24 Fit Distribution Name Lognormal Fit: Location ‐44,781.206 Fit: Mean 247.345 Fit: Std. Dev. 171.933 Fit: Beta 13.59819313 EXC: Exelon Corporation: Monte Carlo: Valuation Per Share | $USD Sensitivity to Variables (Variance Calculation) 17.83 30.66 EXC: Exelon Corporation: Monte Carlo: Valuation Per Share | $USD Sensitivity to Variables: Tornado Chart 17.83 30.66 Beharry, Lyndon Martin W. 2021‐12‐10_EXC‐MC‐Equity|DCF All Variable_MC 12/13/2021 16:54 Page 3 of 3
- 17. Bar labels show the test range for each input variable Input Variable Improvement in Equity Reduction in Equity Range Explained Variation1 Improvement in Equity Reduction in Equity Base Case CoGS : f(Revenue)2031 462.316 30.183 432.132 96.78% 67.202% 86.958% 77.080% Capital Expenditures : f(Revenue)2031 281.289 211.210 70.079 99.32% 8.718% 11.282% 10.000% Tax Rate : f(EBT)2031 255.346 237.154 18.192 99.50% 17.437% 22.563% 20.000% Depreciation/Amortization [COGs] : f(Revenue)2031 238.701 253.798 15.097 99.61% 9.391% 12.152% 10.771% Other Expense (Income); Overhead : f(Revenue)2031 252.082 240.417 11.665 99.68% ‐2.347% ‐1.814% ‐2.081% WACC FOR SIMULATION 249.995 242.550 7.444 99.71% 3.790% 3.989% 3.889% Interest Expense (Income) : f(Revenue)2031 249.754 242.746 7.008 99.74% 1.090% 1.410% 1.250% CoGS : f(Revenue)2030 249.218 243.281 5.937 99.76% 67.202% 86.958% 77.080% CoGS : f(Revenue)2029 249.187 243.312 5.875 99.77% 67.202% 86.958% 77.080% CoGS : f(Revenue)2028 249.156 243.343 5.812 99.79% 67.202% 86.958% 77.080% 1 Explained Variation is cumulative Run options: Tornado method Percentiles of the variables Test range 10% to 90% Test points 5 Customize test ranges by variable Off Show top variables 10 Base case for Crystal Ball variables Median values EXC: Exelon Corporation: Monte Carlo: Valuation Per Share | $USD Input 86.958% 11.282% 22.563% 12.152% ‐1.814% 3.989% 1.410% 86.958% 86.958% 86.958% 67.202% 8.718% 17.437% 9.391% ‐2.347% 3.790% 1.090% 67.202% 67.202% 67.202% (200.000) 0.000 200.000 400.000 600.000 CoGS : f(Revenue)2031 Capital Expenditures : f(Revenue)2031 Tax Rate : f(EBT)2031 Depreciation/Amortization [COGs] : f(Revenue)2031 Other Expense (Income); Overhead : f(Revenue)2031 WACC FOR SIMULATION Interest Expense (Income) : f(Revenue)2031 CoGS : f(Revenue)2030 CoGS : f(Revenue)2029 CoGS : f(Revenue)2028 EXC: Exelon Corporation: Monte Carlo: Valuation Per Share | $USD Reduction in Equity Improvement in Equity
- 18. Equity Valuation 2021‐12‐10_EXC‐MC‐Equity Financial Statement Review Days in a Year Beneish 360 2015 2016 2017 2018 2019 2020 M = ‐4.84 + 0.92*DSRI + 0.528*GMI + 0.404*AQI + 0.892*SGI + 0.115*DEPI – 0.172*SGAI + 4.679*TATA – 0.327*LVGI Income Statement Variables Annual Sales 29,447 31,366 33,565 35,978 34,438 33,039 CoGS 25,056 28,106 29,619 32,143 30,096 30,240 SGA 0 0 0 0 0 0 Income from Continuing Operations 2,257 1,220 3,907 2,107 3,211 1,960 Balance Sheet Variables Cash 6,502 635 898 1,349 587 663 Accounts Receivable 4,099 5,359 5,577 5,863 6,175 4,629 Current Assets 15,334 12,412 11,896 13,360 12,037 12,562 PPE 57,439 71,555 74,202 76,707 80,233 82,584 Securities (i.e. Long‐Term Only) 1,397 1,121 977 1,077 972 995 Non‐Current Assets (sans PPE) 22,611 30,937 30,672 29,599 32,707 34,171 Total Assets 95,384 114,904 116,770 119,666 124,977 129,317 Total Debt 84,583 86,596 84,583 86,596 90,404 94,449 CashFlow Variables CashFlow from Operations 4,539 10,220 9,205 7,156 13,183 6,670 Depreciation 2,450 3,936 3,828 4,353 4,252 5,014 Other Working Capital ‐1,201 3,528 ‐90 ‐858 4,104 ‐1,939 Book Value 10,801 28,308 32,187 33,070 34,573 34,868 10.00 Est. Avg. Years of Life (for PPE Dep.) 10.00 10.00 10.00 10.00 10.00 10.00 Coefficients: ‐4.84 Intercept 2015 2016 2017 2018 2019 2020 0.92 Days Sales In Receivables 50.11173 61.50736 59.81588 58.66585 64.55079 50.43857 0.528 Gross Margin 0.14912 0.10393 0.11756 0.10659 0.12608 0.08472 0.404 Asset Quality 0.23705 0.26924 0.26267 0.24735 0.26170 0.26424 0.892 Sales Growth 29,447 31,366 33,565 35,978 34,438 33,039 0.115 Depreciation 0.04091 0.05214 0.04906 0.05370 0.05033 0.05724 ‐0.172 SGA 0.00000 0.00000 0.00000 0.00000 0.00000 0.00000 ‐0.327 Leverage 0.88676 0.75364 0.72436 0.72365 0.72337 0.73037 4.679 Total Accruals ‐0.02392 ‐0.07833 ‐0.04537 ‐0.04219 ‐0.07979 ‐0.03642 ‐1.78 Beneish Cut‐Off (i.e. expected Max Score) Days Sales in Receivables Index DSRI 1.22740 0.97250 0.98077 1.10031 0.78138 Gross Margin Index GMI 1.43471 0.88407 1.10292 0.84543 1.48825 Asset Quality Index AQI 1.13579 0.97559 0.94166 1.05805 1.00970 Sales Growth Index SGA 1.06517 1.07011 1.07189 0.95720 0.95938 Depreciation index DEPI 0.78462 1.06280 0.91354 1.06701 0.87927 SGA Index SGAI Leverage Index LVGI 0.84988 0.96115 0.99902 0.99961 1.00968 Total Accruals to Total Assets TATA ‐0.07833 ‐0.04537 ‐0.04219 ‐0.07979 ‐0.03642 Beneish Component DSRI 1.12921 0.89470 0.90231 1.01229 0.71887 Beneish Component GMI 0.75753 0.46679 0.58234 0.44639 0.78580 Beneish Component AQI 0.45886 0.39414 0.38043 0.42745 0.40792 Beneish Component SGA 0.95013 0.95454 0.95613 0.85382 0.85576 Beneish Component DEPI 0.09023 0.12222 0.10506 0.12271 0.10112 Beneish Component SGAI Beneish Component LVGI ‐0.27791 ‐0.31429 ‐0.32668 ‐0.32687 ‐0.33017 Beneish Component TATA ‐0.36649 ‐0.21229 ‐0.19742 ‐0.37334 ‐0.17042 M Score ‐2.09844 ‐2.53420 ‐2.43783 ‐2.67756 ‐2.47112 5‐Period ‐2.44383 A score greater than ‐1.78 indicates a strong likelihood of a firm being a manipulator (only incorrectly identifying 17.5%). In his out‐of‐sample tests, Beneish found that he could correctly identify 76% of manipulators, whilst only incorrectly identifying 17.5% of non‐manipulators. Read more: https://www.gmtresearch.com/beneishs‐m‐score/ Beharry, Lyndon Martin W. 2021‐12‐10_EXC‐MC‐Equity|Beneish 12/13/2021 09:09 Page 1 of 1
- 19. Equity Valuation 2021‐12‐10_EXC‐MC‐Equity Financial Statement Review MAD 0.01222 1 Select the digit place for Benford Test. Statistical Analysis on Linest Benford Probability Distribution E(x) EXC: Exelon Corporation Analysis of Balance Sheet Data Benford Statistics Test | Digit:1 Benford Rate Di= |xi‐(X)| m b Digit Place 1st 2d 3d 1st‐3d E (x) 0 0 0.00000 0.00000 0.00000 0.885573 0.011443 0 0.00000 0.11960 0.10170 0.07377 132 1 0.33333 0.30103 0.03230 se 0.049057 0.006608 1 0.30103 0.11380 0.10130 0.17204 69 2 0.17424 0.17609 0.00185 R 2 Sey 0.976039 0.014002 2 0.17609 0.10880 0.10090 0.12860 51 3 0.12879 0.12494 0.00385 F df 325.8721 8 3 0.12494 0.10430 0.10050 0.10991 34 4 0.08586 0.09691 0.01105 ssreg ssresid 0.063885 0.001568 4 0.09691 0.10030 0.10010 0.09910 24 5 0.06061 0.07918 0.01858 5 0.07918 0.09660 0.09970 0.09183 23 6 0.05808 0.06695 0.00887 6 0.06695 0.09330 0.09940 0.08655 15 7 0.03788 0.05799 0.02011 Pearson R‐Value 0.987947 7 0.05799 0.09030 0.09900 0.08243 20 8 0.05051 0.05115 0.00065 8 0.05115 0.08750 0.09860 0.07908 28 9 0.07071 0.04576 0.02495 9 0.04576 0.08490 0.09820 0.07629 396 0.00000 0.30103 0.17609 0.12494 0.09691 0.07918 0.06695 0.05799 0.05115 0.04576 0.0000 0.3333 0.1742 0.1288 0.0859 0.0606 0.0581 0.0379 0.0505 0.0707 0.00 0.05 0.10 0.15 0.20 0.25 0.30 0.35 0 1 2 3 4 5 6 7 8 9 EXC: Exelon Corporation Analysis of Balance Sheet Data Benford Statistics Test | Digit:1 Benford Rate EXC: Exelon Corporation Analysis of Balance Sheet Data Benford Statistics Test | Digit:1 Beharry, Lyndon Martin W. 2021‐12‐10_EXC‐MC‐Equity|BenfordsDigit 12/13/2021 09:09 Page 1 of 1