2022-07-15_BIIB_MC-Equity-July-Trials.pdf

I valued Biogen back in 2014 for an old friend, and I have looked in on it sporadically over the years. I did not like it back in the 2010s because it had too many competing therapies for multiple schlerosis (from my 2014 report here https://www.slideshare.net/LMBeharry/biib-reportlmbenterprises-59573190): "• Several of the product offerings address multiple sclerosis, and these pharma products will likely begin cannibalizing each other within the intermediate term. The analyst believes that this cannibalization will curtail growth within the MS product line within the next 18 to 24 months." and "• The firm has submitted hemophilia agents, Factor VIII and Factor IX to the US FDA for regulatory review, anticipating marketing approval in 2014-2015. As these hemophilia products are administered orally, analysts expect sales to grow robustly indeed. (i.e. more doctors will prescribe the treatment as it circumvents costly and frequent recurrent need of infusion of clotting factor). Statistics indicate that roughly 20,000 US residents suffer with hemophilia. A market of 20,000 patients is not a growth sector." Note that I have not kept up with its pipeline, nor its successes/failures at clinical trial. This printout is solely an exercise in econometric analysis using its historical cost structure to derive an equity valuation. If you are curious about its current research endeavors, I provide the link for clinical trials here (already sorted for Biogen): https://clinicaltrials.gov/ct2/results?cond=&term=Biogen&cntry=&state=&city=&dist=
![Equity Valuation 2022‐07‐15_BIIB_MC‐Equity‐Trials Financial Statement Review
BIIB: Biogen Inc. | FEIN 33‐0112644 1,000,000 $USD
Aggregate Notes: D&A includes Amortization of acquired Intellectual Properties (i.e. Patents etc.) and D&A on PPE.
1,000,000 2008 2009 2010 2011 2012 2013 2014 2015 2016 2017 2018 2019 2020 2021 2022
Timet-12 Timet-11 Timet-10 Timet-9 Timet-8 Timet-7 Timet-6 Timet-5 Timet-4 Timet-3 Timet-2 Timet-1 Timet-1 Timet-1 Timet
OPERATING REVENUE
100.000% Revenue From Income‐Expense Worksheet 0 4,377 4,716 5,049 5,516 6,932 9,703 10,764 11,449 12,274 13,453 14,378 13,445 10,982 0
0.000%
0.000%
0.000%
0.000%
0.000%
0.000%
0.000%
0.000%
0.000%
100.000% TOTAL REVENUE 0 4,377 4,716 5,049 5,516 6,932 9,703 10,764 11,449 12,274 13,453 14,378 13,445 10,982 0
Average PerCent Change 8.822% 7.746% 7.044% 9.266% 25.664% 39.975% 10.929% 6.364% 7.207% 9.606% 6.876% ‐6.491% ‐18.319% ‐100.000%
Revenue 15‐Yr CAGRBase‐to‐Terminal 8.182% 5‐Yr CAGR
PRODUCTION COSTS:
0.000% CoGSIncome Statement
12.890% CoGS from Income‐Expense Worksheet (If Applicable) 0 382 400 467 545 858 1,171 1,240 1,479 1,630 1,816 1,955 1,805 2,110 0
D&A from Income‐Expense Worksheet (If Applicable) 0 428 356 359 366 189 688 600 683 1,081 747 490 465 488 0
0.000% D&ACashFlows
Yes Deduct D&ACashFlows from CoGSIncome Statement
Amortization Patents Intangibles
5.640% D&A PPE 0 428 356 359 366 189 688 600 683 1,081 747 490 465 488 0
7.250% CoGS [Adj for D&A, and Depletion] 0 ‐46 45 108 180 669 483 640 796 549 1,069 1,466 1,340 1,622 0
12.890% COST OF SALES (Incl D&A) 0 382 400 467 545 858 1,171 1,240 1,479 1,630 1,816 1,955 1,805 2,110 0
CoGs (Adj for D&A) PerCent of Revenue ‐1.048% 0.944% 2.136% 3.260% 9.650% 4.977% 5.946% 6.953% 4.473% 7.946% 10.193% 9.970% 14.770%
87.110% GROSS MARGIN 0 3,995 4,316 4,582 4,971 6,074 8,532 9,523 9,970 10,644 11,637 12,423 11,639 8,872 0
87.827% PerCent of Revenue 91.271% 91.513% 90.754% 90.112% 87.627% 87.932% 88.476% 87.084% 86.720% 86.499% 86.400% 86.573% 80.789%
See Income Expense Worksheet Row 46
0 3,995 4,316 4,582 4,971 6,074 8,532 9,523 9,970 10,644 11,637 12,423 11,639 8,872 0
ADMINISTRATIVE COSTS:
0.000% SGAIncome Statement
SGAWorksheet (If Applicable) 0 1,127 1,610 1,429 1,625 1,797 2,177 2,237 2,461 2,231 2,404 2,609 2,634 2,649 0
D&A from Income‐Expense Worksheet (If Applicable) 0 290 209 209 202 343 490 383 386 815 747 490 465 881 0
4.802% D&ACashFlows
No Deduct D&ACashFlows from SGAIncome Statement
21.935% SGA [Adj for D&A] 0 1,127 1,610 1,429 1,625 1,797 2,177 2,237 2,461 2,231 2,404 2,609 2,634 2,649 0
21.159% R&D 1,283 1,249 1,220 1,335 1,444 1,893 2,013 1,973 2,254 2,597 2,281 3,991 2,501
0.000% Amortization Patents Intangibles
4.802% D&A SGA 0 290 209 209 202 343 490 383 386 815 747 490 465 881 0
0.000%
0.000%
0.000% Restructuring / Other
4.802% TOTAL OPERATING / OVERHEAD EXPENSE 0 2,700 3,067 2,857 3,162 3,584 4,560 4,632 4,820 5,300 5,748 5,380 7,089 6,031 0
Average PerCent of Revenue 61.677% 65.034% 56.593% 57.318% 51.699% 46.993% 43.037% 42.098% 43.179% 42.727% 37.418% 52.730% 54.921%
PerCent Change 7.565% 13.610% ‐6.850% 10.666% 13.345% 27.234% 1.591% 4.043% 9.959% 8.459% ‐6.404% 31.774% ‐14.924% ‐100.000%
39.214% EARNINGS BEFORE EXTRAORDINARY ITEMS: 0 1,295 1,249 1,725 1,809 2,491 3,972 4,891 5,150 5,344 5,889 7,043 4,550 2,841 0
Other Items from Income-Expense Worksheet 0 ‐73 ‐17 ‐6 ‐76 ‐22 ‐4 28 ‐43 ‐35 ‐212 ‐271 ‐720 1,096 0
Agg μ -0.287% Other Expense | (Income) | Royalty or Extraordinary Items
μ -0.239% ‐1.669% ‐0.363% ‐0.113% ‐1.370% ‐0.315% ‐0.038% 0.262% ‐0.372% ‐0.288% ‐1.573% ‐1.883% ‐5.355% 9.976%
39.502% EBIT 0 1,368 1,266 1,730 1,885 2,512 3,976 4,863 5,193 5,380 6,100 7,313 5,270 1,745 0
Average %Rev 39.485% 31.263% 26.843% 34.275% 34.163% 36.244% 40.977% 45.177% 45.358% 43.830% 45.345% 50.865% 39.198% 15.892%
PerCent Change 0.063% ‐7.488% 36.683% 8.911% 33.316% 58.255% 22.300% 6.790% 3.593% 13.395% 19.886% ‐27.940% ‐66.884% ‐100.000%
INTEREST PAYMENTS
Interest Accounting from Income‐Expense Worksheet 0 36 36 19 30 32 30 96 260 251 201 187 223 0 0
Agg μ 1.137% Interest Expense
μ 0 Estimated Cost of Debt 3.720% 0 0 0 0 0 0 0 0 0 0 0 0 0
TOTAL INTEREST 0 36 36 19 30 32 30 96 260 251 201 187 223 0 0
PerCent Change 37.413% 0.838% ‐46.814% 53.646% 8.136% ‐7.524% 223.729% 172.251% ‐3.538% ‐20.016% ‐6.580% 18.730% ‐100.000%
47,203 EARNINGS BEFORE TAXES 0 1,333 1,230 1,711 1,855 2,481 3,947 4,767 4,933 5,129 5,900 7,126 5,048 1,745 0
PROVISION FOR TAXES
11,679 356 331 445 471 601 990 1,162 1,237 2,459 1,426 1,158 992 53
PerCent Change 6.533% ‐6.829% 34.164% 5.855% 27.725% 64.712% 17.340% 6.517% 98.715% ‐42.018% ‐18.771% ‐14.309% ‐94.709% ‐100.000%
24.742% PerCent of EBT 26.684% 26.940% 25.977% 25.365% 24.229% 25.083% 24.366% 25.082% 47.939% 24.164% 16.251% 19.659% 3.008%
Dividends Paid on Preferred Stock or (Income) / Loss to Noncontrolling Interests 172
166 Extraneous Provisions 7 ‐107 0 5 17 22 59 ‐7 131 79 ‐5 ‐35
0.135% 0.158% ‐2.262% 0.000% 0.082% 0.248% 0.225% 0.545% ‐0.062% 1.067% 0.000% 0.552% ‐0.039% 1.244%
28.599% NET EARNINGS 0 970 1,005 1,267 1,380 1,862 2,935 3,547 3,703 2,539 4,474 5,889 4,061 1,556 0
PerCent Change 3.622% 26.004% 8.948% 34.949% 57.587% 20.860% 4.392% ‐31.428% 76.204% 31.616% ‐31.044% ‐61.677% ‐100.000%
Net Earnings CAGR or IRR
Use row 96 and 97 to force adjustments in Worksheet
See Income‐Expense Worksheet Row 86 0 970 1,005 1,267 1,380 1,862 2,935 3,547 3,703 2,539 4,474 5,889 4,061 1,556 0
10.442% 10.442% D&A Add Back 0 718 565 567 568 532 1,178 983 1,068 1,896 1,495 980 930 1,369 0
D&A %Rev 16.397% 11.972% 11.241% 10.294% 7.671% 12.139% 9.132% 9.331% 15.445% 11.110% 6.815% 6.914% 12.466%
39.041% Net CashFlow to Firm 0 1,688 1,570 1,834 1,948 2,394 4,113 4,530 4,771 4,435 5,969 6,868 4,990 2,925 0
Net FCFFirm %Revenue 38.560% 33.287% 36.330% 35.310% 34.536% 42.385% 42.086% 41.673% 36.132% 44.367% 47.770% 37.116% 26.636%
Estimated Capital Expenditure 0 508 547 586 640 804 1,126 1,249 1,328 1,424 1,561 1,668 1,560 1,274 0
27.438% Estimated Net Earnings | FCFInvestors 0 1,180 1,023 1,248 1,308 1,590 2,987 3,281 3,443 3,011 4,408 5,200 3,430 1,651 0
Net FCFInvestors %Revenue 26.958% 21.684% 24.728% 23.708% 22.933% 30.782% 30.483% 30.071% 24.530% 32.764% 36.167% 25.514% 15.034%
CAGR or IRR Estimated Net Earnings | FCFInvestors
Beharry, Lyndon Martin W. 2022‐07‐15_BIIB_MC‐Equity‐Trials|IncStmntReview 07/15/2022 18:15 Page 2 of 17](data:image/gif;base64,R0lGODlhAQABAIAAAAAAAP///yH5BAEAAAAALAAAAAABAAEAAAIBRAA7)
Recommended
Recommended
More Related Content
More from Lyndon Martin W. Beharry
More from Lyndon Martin W. Beharry (20)
2022-07-15_BIIB_MC-Equity-July-Trials.pdf
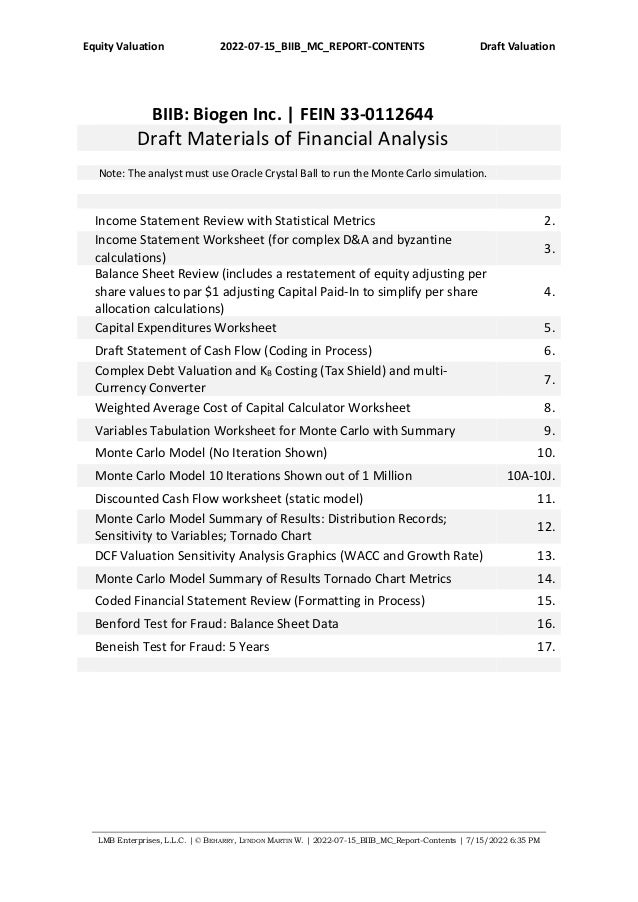
- 1. Equity Valuation 2022-07-15_BIIB_MC_REPORT-CONTENTS Draft Valuation LMB Enterprises, L.L.C. | © BEHARRY, LYNDON MARTIN W. | 2022-07-15_BIIB_MC_Report-Contents | 7/15/2022 6:35 PM BIIB: Biogen Inc. | FEIN 33-0112644 Draft Materials of Financial Analysis Note: The analyst must use Oracle Crystal Ball to run the Monte Carlo simulation. Income Statement Review with Statistical Metrics 2. Income Statement Worksheet (for complex D&A and byzantine calculations) 3. Balance Sheet Review (includes a restatement of equity adjusting per share values to par $1 adjusting Capital Paid-In to simplify per share allocation calculations) 4. Capital Expenditures Worksheet 5. Draft Statement of Cash Flow (Coding in Process) 6. Complex Debt Valuation and KB Costing (Tax Shield) and multi- Currency Converter 7. Weighted Average Cost of Capital Calculator Worksheet 8. Variables Tabulation Worksheet for Monte Carlo with Summary 9. Monte Carlo Model (No Iteration Shown) 10. Monte Carlo Model 10 Iterations Shown out of 1 Million 10A-10J. Discounted Cash Flow worksheet (static model) 11. Monte Carlo Model Summary of Results: Distribution Records; Sensitivity to Variables; Tornado Chart 12. DCF Valuation Sensitivity Analysis Graphics (WACC and Growth Rate) 13. Monte Carlo Model Summary of Results Tornado Chart Metrics 14. Coded Financial Statement Review (Formatting in Process) 15. Benford Test for Fraud: Balance Sheet Data 16. Beneish Test for Fraud: 5 Years 17.
- 2. Equity Valuation 2022‐07‐15_BIIB_MC‐Equity‐Trials Financial Statement Review BIIB: Biogen Inc. | FEIN 33‐0112644 1,000,000 $USD Aggregate Notes: D&A includes Amortization of acquired Intellectual Properties (i.e. Patents etc.) and D&A on PPE. 1,000,000 2008 2009 2010 2011 2012 2013 2014 2015 2016 2017 2018 2019 2020 2021 2022 Timet-12 Timet-11 Timet-10 Timet-9 Timet-8 Timet-7 Timet-6 Timet-5 Timet-4 Timet-3 Timet-2 Timet-1 Timet-1 Timet-1 Timet OPERATING REVENUE 100.000% Revenue From Income‐Expense Worksheet 0 4,377 4,716 5,049 5,516 6,932 9,703 10,764 11,449 12,274 13,453 14,378 13,445 10,982 0 0.000% 0.000% 0.000% 0.000% 0.000% 0.000% 0.000% 0.000% 0.000% 100.000% TOTAL REVENUE 0 4,377 4,716 5,049 5,516 6,932 9,703 10,764 11,449 12,274 13,453 14,378 13,445 10,982 0 Average PerCent Change 8.822% 7.746% 7.044% 9.266% 25.664% 39.975% 10.929% 6.364% 7.207% 9.606% 6.876% ‐6.491% ‐18.319% ‐100.000% Revenue 15‐Yr CAGRBase‐to‐Terminal 8.182% 5‐Yr CAGR PRODUCTION COSTS: 0.000% CoGSIncome Statement 12.890% CoGS from Income‐Expense Worksheet (If Applicable) 0 382 400 467 545 858 1,171 1,240 1,479 1,630 1,816 1,955 1,805 2,110 0 D&A from Income‐Expense Worksheet (If Applicable) 0 428 356 359 366 189 688 600 683 1,081 747 490 465 488 0 0.000% D&ACashFlows Yes Deduct D&ACashFlows from CoGSIncome Statement Amortization Patents Intangibles 5.640% D&A PPE 0 428 356 359 366 189 688 600 683 1,081 747 490 465 488 0 7.250% CoGS [Adj for D&A, and Depletion] 0 ‐46 45 108 180 669 483 640 796 549 1,069 1,466 1,340 1,622 0 12.890% COST OF SALES (Incl D&A) 0 382 400 467 545 858 1,171 1,240 1,479 1,630 1,816 1,955 1,805 2,110 0 CoGs (Adj for D&A) PerCent of Revenue ‐1.048% 0.944% 2.136% 3.260% 9.650% 4.977% 5.946% 6.953% 4.473% 7.946% 10.193% 9.970% 14.770% 87.110% GROSS MARGIN 0 3,995 4,316 4,582 4,971 6,074 8,532 9,523 9,970 10,644 11,637 12,423 11,639 8,872 0 87.827% PerCent of Revenue 91.271% 91.513% 90.754% 90.112% 87.627% 87.932% 88.476% 87.084% 86.720% 86.499% 86.400% 86.573% 80.789% See Income Expense Worksheet Row 46 0 3,995 4,316 4,582 4,971 6,074 8,532 9,523 9,970 10,644 11,637 12,423 11,639 8,872 0 ADMINISTRATIVE COSTS: 0.000% SGAIncome Statement SGAWorksheet (If Applicable) 0 1,127 1,610 1,429 1,625 1,797 2,177 2,237 2,461 2,231 2,404 2,609 2,634 2,649 0 D&A from Income‐Expense Worksheet (If Applicable) 0 290 209 209 202 343 490 383 386 815 747 490 465 881 0 4.802% D&ACashFlows No Deduct D&ACashFlows from SGAIncome Statement 21.935% SGA [Adj for D&A] 0 1,127 1,610 1,429 1,625 1,797 2,177 2,237 2,461 2,231 2,404 2,609 2,634 2,649 0 21.159% R&D 1,283 1,249 1,220 1,335 1,444 1,893 2,013 1,973 2,254 2,597 2,281 3,991 2,501 0.000% Amortization Patents Intangibles 4.802% D&A SGA 0 290 209 209 202 343 490 383 386 815 747 490 465 881 0 0.000% 0.000% 0.000% Restructuring / Other 4.802% TOTAL OPERATING / OVERHEAD EXPENSE 0 2,700 3,067 2,857 3,162 3,584 4,560 4,632 4,820 5,300 5,748 5,380 7,089 6,031 0 Average PerCent of Revenue 61.677% 65.034% 56.593% 57.318% 51.699% 46.993% 43.037% 42.098% 43.179% 42.727% 37.418% 52.730% 54.921% PerCent Change 7.565% 13.610% ‐6.850% 10.666% 13.345% 27.234% 1.591% 4.043% 9.959% 8.459% ‐6.404% 31.774% ‐14.924% ‐100.000% 39.214% EARNINGS BEFORE EXTRAORDINARY ITEMS: 0 1,295 1,249 1,725 1,809 2,491 3,972 4,891 5,150 5,344 5,889 7,043 4,550 2,841 0 Other Items from Income-Expense Worksheet 0 ‐73 ‐17 ‐6 ‐76 ‐22 ‐4 28 ‐43 ‐35 ‐212 ‐271 ‐720 1,096 0 Agg μ -0.287% Other Expense | (Income) | Royalty or Extraordinary Items μ -0.239% ‐1.669% ‐0.363% ‐0.113% ‐1.370% ‐0.315% ‐0.038% 0.262% ‐0.372% ‐0.288% ‐1.573% ‐1.883% ‐5.355% 9.976% 39.502% EBIT 0 1,368 1,266 1,730 1,885 2,512 3,976 4,863 5,193 5,380 6,100 7,313 5,270 1,745 0 Average %Rev 39.485% 31.263% 26.843% 34.275% 34.163% 36.244% 40.977% 45.177% 45.358% 43.830% 45.345% 50.865% 39.198% 15.892% PerCent Change 0.063% ‐7.488% 36.683% 8.911% 33.316% 58.255% 22.300% 6.790% 3.593% 13.395% 19.886% ‐27.940% ‐66.884% ‐100.000% INTEREST PAYMENTS Interest Accounting from Income‐Expense Worksheet 0 36 36 19 30 32 30 96 260 251 201 187 223 0 0 Agg μ 1.137% Interest Expense μ 0 Estimated Cost of Debt 3.720% 0 0 0 0 0 0 0 0 0 0 0 0 0 TOTAL INTEREST 0 36 36 19 30 32 30 96 260 251 201 187 223 0 0 PerCent Change 37.413% 0.838% ‐46.814% 53.646% 8.136% ‐7.524% 223.729% 172.251% ‐3.538% ‐20.016% ‐6.580% 18.730% ‐100.000% 47,203 EARNINGS BEFORE TAXES 0 1,333 1,230 1,711 1,855 2,481 3,947 4,767 4,933 5,129 5,900 7,126 5,048 1,745 0 PROVISION FOR TAXES 11,679 356 331 445 471 601 990 1,162 1,237 2,459 1,426 1,158 992 53 PerCent Change 6.533% ‐6.829% 34.164% 5.855% 27.725% 64.712% 17.340% 6.517% 98.715% ‐42.018% ‐18.771% ‐14.309% ‐94.709% ‐100.000% 24.742% PerCent of EBT 26.684% 26.940% 25.977% 25.365% 24.229% 25.083% 24.366% 25.082% 47.939% 24.164% 16.251% 19.659% 3.008% Dividends Paid on Preferred Stock or (Income) / Loss to Noncontrolling Interests 172 166 Extraneous Provisions 7 ‐107 0 5 17 22 59 ‐7 131 79 ‐5 ‐35 0.135% 0.158% ‐2.262% 0.000% 0.082% 0.248% 0.225% 0.545% ‐0.062% 1.067% 0.000% 0.552% ‐0.039% 1.244% 28.599% NET EARNINGS 0 970 1,005 1,267 1,380 1,862 2,935 3,547 3,703 2,539 4,474 5,889 4,061 1,556 0 PerCent Change 3.622% 26.004% 8.948% 34.949% 57.587% 20.860% 4.392% ‐31.428% 76.204% 31.616% ‐31.044% ‐61.677% ‐100.000% Net Earnings CAGR or IRR Use row 96 and 97 to force adjustments in Worksheet See Income‐Expense Worksheet Row 86 0 970 1,005 1,267 1,380 1,862 2,935 3,547 3,703 2,539 4,474 5,889 4,061 1,556 0 10.442% 10.442% D&A Add Back 0 718 565 567 568 532 1,178 983 1,068 1,896 1,495 980 930 1,369 0 D&A %Rev 16.397% 11.972% 11.241% 10.294% 7.671% 12.139% 9.132% 9.331% 15.445% 11.110% 6.815% 6.914% 12.466% 39.041% Net CashFlow to Firm 0 1,688 1,570 1,834 1,948 2,394 4,113 4,530 4,771 4,435 5,969 6,868 4,990 2,925 0 Net FCFFirm %Revenue 38.560% 33.287% 36.330% 35.310% 34.536% 42.385% 42.086% 41.673% 36.132% 44.367% 47.770% 37.116% 26.636% Estimated Capital Expenditure 0 508 547 586 640 804 1,126 1,249 1,328 1,424 1,561 1,668 1,560 1,274 0 27.438% Estimated Net Earnings | FCFInvestors 0 1,180 1,023 1,248 1,308 1,590 2,987 3,281 3,443 3,011 4,408 5,200 3,430 1,651 0 Net FCFInvestors %Revenue 26.958% 21.684% 24.728% 23.708% 22.933% 30.782% 30.483% 30.071% 24.530% 32.764% 36.167% 25.514% 15.034% CAGR or IRR Estimated Net Earnings | FCFInvestors Beharry, Lyndon Martin W. 2022‐07‐15_BIIB_MC‐Equity‐Trials|IncStmntReview 07/15/2022 18:15 Page 2 of 17
- 3. Equity Valuation 2022‐07‐15_BIIB_MC‐Equity‐Trials Financial Statement Review Income‐Expense Worksheet BIIB: Biogen Inc. | FEIN 33‐0112644 2008 2009 2010 2011 2012 2013 2014 2015 2016 2017 2018 2019 2020 2021 2022 1,000,000 $USD Revenue Worksheet Products 3,153 3,470 3,836 4,166 5,542 8,203 9,189 9,818 10,355 10,887 11,380 10,692 8,847 Unconsolidated joint business 1,095 1,077 997 1,138 1,126 1,195 0 0 0 Other 130 169 216 212 264 305 236 316 360 586 708 775 476 Royalty 0 0 0 0 0 0 0 0 0 Revenues from anti‐CD20 therapeutic programs 0 0 0 0 0 0 1,339 1,315 1,559 1,980 2,290 1,978 1,659 REVENUE CALCULATION 0 4,377 4,716 5,049 5,516 6,932 9,703 10,764 11,449 12,274 13,453 14,378 13,445 10,982 0 CoGS Worksheet Line Worker Wage (If Applicable) Cost of Product revenues, excluding amortization… 382 400 467 545 858 1,171 1,240 1,479 1,630 1,816 1,955 1,805 2,110 Products Services CoGS CALCULATION 0 382 400 467 545 858 1,171 1,240 1,479 1,630 1,816 1,955 1,805 2,110 0 0 3,995 4,316 4,582 4,971 6,074 8,532 9,523 9,970 10,644 11,637 12,423 11,639 8,872 0 COMPLEX D&A CoGS (Production Capital) 428 356 359 366 189 688 600 683 1,081 747 490 465 488 TOTAL COMPLEX D&A (Posts to CoGS) 0 428 356 359 366 189 688 600 683 1,081 747 490 465 488 0 COMPLEX SGA (Administrative Expense) 911 1,032 1,056 1,277 1,712 2,232 2,113 1,948 1,936 2,106 2,375 2,505 2,674 0 0 0 0 0 0 0 0 0 Collaboration profit sharing 216 258 318 318 85 0 0 10 112 185 242 233 7 (Gain) Loss on fair value remeasurement 0 0 36 27 ‐1 ‐39 31 15 63 ‐12 ‐64 ‐86 ‐51 Acquired in‐process Research and Development 0 0 0 0 0 0 0 0 120 113 0 75 18 Gain on Dispositions, net 0 0 0 0 0 0 0 0 0 0 55 ‐93 0 Restructuring / Other 0 320 19 2 0 ‐17 93 488 1 12 2 0 0 Facility Impairments and loss on sale 0 0 0 0 0 0 0 0 0 TOTAL COMPLEX SGA (Posts to Administrative Expense) 0 1,127 1,610 1,429 1,625 1,797 2,177 2,237 2,461 2,231 2,404 2,609 2,634 2,649 0 0 970 1,005 1,267 1,380 1,862 2,935 3,547 3,703 2,539 4,474 5,889 4,061 1,556 0 COMPLEX D&A SGA (Administrative Capital) Amortization of Acquired Intangibles 290 209 209 202 343 490 383 386 815 747 490 465 881 TOTAL OTHER COMPLEX D&A SGA 0 290 209 209 202 343 490 383 386 815 747 490 465 881 0 OTHER INCOME / (LOSS) Gain / (Loss) on Sale of Property and/or Facility (If Applicable ) 23 16 19 11 22 12 ‐4 6 ‐36 Interest Receivable (If Applicable ) 48 22 19 30 33 12 22 63 79 113 120 42 Impairments on Investments ‐11 ‐21 ‐10 ‐6 ‐3 0 0 0 0 Foreign exchange gains (losses), net 11 ‐4 ‐6 ‐3 ‐15 ‐12 ‐33 ‐10 6 ‐10 ‐7 ‐11 Other, net 1 3 ‐2 4 ‐15 ‐9 ‐14 ‐17 ‐13 ‐11 ‐47 3 ‐1,096 Loss on sale of marketable securities held for sale 0 0 0 0 0 0 0 0 0 Gain on investments in executive deferred compensation 0 0 0 0 0 0 0 0 0 Gain (loss) on hedge ineffectiveness and discontinuance 0 0 0 0 0 0 0 0 0 Repayment of loan previously written‐off 0 0 0 0 0 0 0 0 0 Settlement of litigation 0 0 0 0 0 0 0 0 0 Loan impairment 0 0 0 0 0 0 0 0 0 Miscellaneous 0 0 ‐14 40 0 0 0 0 0 Gain (loss) on investments, net 120 205 686 TOTAL OTHER INCOME (LOSS) 0 73 17 6 76 22 4 ‐28 43 35 212 271 720 ‐1,096 0 INTEREST EXPENSE 36 36 19 30 32 30 96 260 251 201 187 223 TOTAL INTEREST EXPENSE 0 36 36 19 30 32 30 96 260 251 201 187 223 0 0 Beharry, Lyndon Martin W. 2022‐07‐15_BIIB_MC‐Equity‐Trials|Income‐Expense Worksheet 07/15/2022 18:15 Page 3 of 17
- 4. Equity Valuation 2022‐07‐15_BIIB_MC‐Equity‐Trials Financial Statement Review BIIB: Biogen Inc. | FEIN 33‐0112644 BalShtReview 1,000,000 $USD 2008 2009 2010 2011 2012 2013 2014 2015 2016 2017 2018 2019 2020 2021 2022 CURRENT ASSETS Cash 582 760 515 571 603 1,205 1,308 2,327 1,574 1,225 2,914 1,331 2,261 Trade Accounts Receivable 551 605 585 687 824 1,292 1,227 1,442 1,787 1,959 1,881 1,914 1,549 Short Term Factor Financing Receivable Accounts Receivable 0 551 605 585 687 824 1,292 1,227 1,442 1,787 1,959 1,881 1,914 1,549 0 Inventories 294 289 327 447 659 804 893 1,002 903 930 804 1,069 1,352 Investments in Securities / Short‐term Securities 682 448 1,176 1,135 620 640 2,121 2,569 2,115 2,313 1,562 1,279 1,541 Deferred Tax 0 0 0 0 0 0 0 0 0 Other Receivable 0 0 229 268 0 0 0 0 0 Other Current Assets 372 438 145 136 479 731 837 1,093 962 688 631 881 741 Due from anti‐CD20 therapeutic programs, net 0 0 0 0 0 0 315 301 533 527 590 414 412 TOTAL CURRENT ASSETS 0 2,481 2,540 2,975 3,244 3,185 4,673 6,700 8,732 7,873 7,641 8,382 6,887 7,857 0 NON-CURRENT ASSETS (i.e. LONG-TERM ASSETS) Property Plant and Equipment (Acquisition Basis) 5,399 4,838 5,194 5,423 Accumulated Depreciation 1,797 1,591 1,782 2,007 Property Plant and Equipment (Net of Depreciation) 1,637 1,642 1,571 1,742 1,751 1,766 2,188 2,502 3,182 PPE (Net) 0 1,637 1,642 1,571 1,742 1,751 1,766 2,188 2,502 3,182 3,601 3,247 3,412 3,416 0 Goodwill 1,139 1,146 1,146 1,201 1,233 1,760 2,664 3,669 4,633 5,706 5,758 5,762 5,761 Intangible (Other Intangible) 0 0 332 274 0 0 4,085 3,808 3,880 3,120 3,527 3,084 2,221 TOTAL GOODWILL AND INTANGIBLE OTHER 0 1,139 1,146 1,478 1,475 1,233 1,760 6,749 7,478 8,512 8,826 9,285 8,846 7,982 0 Long‐term Marketable Securities 1,194 743 1,417 2,037 626 4,029 2,760 2,829 3,057 1,376 1,408 772 892 Other Derivative Contracts 0 0 0 0 4,475 619 0 0 0 Other Assets 2,101 2,021 1,608 1,632 594 0 0 0 0 Noncurrent Assets of Discontinued Operations 0 0 0 0 0 1,471 0 0 0 Investments in Other Assets 0 0 0 0 0 0 1,108 1,336 1,028 1,691 1,253 2,899 1,940 Operating Lease Assets 427 433 375 Deferred Tax Asset 2,154 3,232 1,370 1,415 TOTAL NON-CURRENT ASSETS 0 6,071 5,552 6,074 6,886 8,678 9,644 12,805 14,145 15,779 17,648 18,853 17,732 16,021 0 TOTAL ASSETS 0 8,552 8,092 9,050 10,130 11,863 14,317 19,505 22,877 23,653 25,289 27,234 24,619 23,877 0 CURRENT LIABILITIES Accounts Payable 119 163 186 204 220 229 267 280 396 371 531 455 589 Current Portion of Debt 20 137 3 453 3 3 5 5 3 1,496 999 Accrued Expenses 501 666 677 980 0 1,819 2,097 2,904 2,901 2,861 2,766 3,145 2,535 Accrued Taxes Payable 76 85 46 20 180 168 209 232 68 64 71 142 175 Other Current Liabilities: Lease etc. 0 0 0 0 1,355 0 0 0 0 Dividend Payable TOTAL CURRENT LIABILITIES 0 715 1,050 913 1,657 1,758 2,220 2,578 3,420 3,368 3,295 4,864 3,742 4,298 0 LONG-TERM LIABILITIES Notes payable / Long‐term Debt 1,080 1,066 1,061 687 592 582 6,522 6,513 5,935 5,937 4,459 7,426 6,274 Long‐term Tax Liabilities 241 201 249 217 233 51 125 93 123 1,636 2,811 1,033 695 Other Long‐term 254 326 400 604 659 650 906 723 1,629 1,389 1,349 1,330 1,321 Long‐term Operating Lease 413 402 330 TOTAL LONG-TERM LIABILITIES 0 1,575 1,593 1,710 1,509 1,484 1,283 7,552 7,328 7,686 8,962 9,031 10,191 8,619 0 TOTAL LIABILITIES 0 2,290 2,643 2,623 3,166 3,242 3,503 10,130 10,748 11,055 12,257 13,895 13,933 12,918 0 SHAREHOLDERS EQUITY Goal‐Seek Adjust Capital Paid‐In and Share count total to Par $USD 1.00 Preferred Stock:A @ par $USD 1.00 Preferred Stock:B @ par $USD 1.00 Preferred Stock:C @ par $USD 1.00 Preferred Stock:D @ par $USD 1.00 Common Stock @ par $USD 1.00 288 248 234 236 256 258 241 239 200 197 187 161 147 Treasury Stock @ par $USD 1.00 0 0 0 0 0 0 23 23 24 24 24 24 24 Additional Capital Paid‐In 5,782 3,895 0 0 0 4,196 0 0 12,707 ‐3,198 ‐3,188 ‐3,162 ‐3,080 Deferred Compensation 0 0 0 0 0 0 0 0 0 Accumulated Comprehensive Income / (Loss) 50 ‐22 ‐27 ‐55 ‐28 ‐59 ‐224 ‐320 0 ‐240 ‐135 ‐299 ‐107 Retained Earnings / Accumulated Other Comprehensive Income 141 1,328 6,219 6,783 8,393 6,414 9,333 12,199 ‐318 16,257 16,455 13,976 13,912 Other Equity 0 0 0 0 0 0 0 0 0 NonControlling Interests 0 0 0 0 0 5 2 ‐12 ‐15 ‐8 ‐4 ‐14 64 TOTAL SHAREHOLDERS EQUITY 0 6,262 5,449 6,427 6,964 8,621 10,814 9,375 12,129 12,598 13,032 13,339 10,686 10,960 0 TOTAL LIABILITIES AND SE 0 8,552 8,092 9,050 10,130 11,863 14,317 19,505 22,877 23,653 25,289 27,234 24,619 23,877 0 Beharry, Lyndon Martin W. 2022‐07‐15_BIIB_MC‐Equity‐Trials|BalShtReview 07/15/2022 18:15 Page 4 of 17
- 5. Equity Valuation 2022‐07‐15_BIIB_MC‐Equity‐Trials Financial Statement Review BIIB: Biogen Inc. | FEIN 33‐0112644 CAPEXCalc IRR; CAGR Aggregated 1,000,000 $USD 2008 2009 2010 2011 2012 2013 2014 2015 2016 2017 2018 2019 2020 2021 2022 31.257% Working Capital [Current Assets - Current Liabilities] 1,490 2,063 1,587 1,427 2,453 4,123 5,312 4,505 4,346 3,518 3,145 3,558 0 PerCent of Revenue 31.598% 40.853% 28.768% 20.580% 25.280% 38.301% 46.400% 36.705% 32.303% 24.468% 23.392% 32.402% -21.903% Working Capital ‐572 476 160 ‐1,026 ‐1,670 ‐1,190 807 159 828 373 ‐413 3,558 -2.596% Working Capital %Rev ‐11.335% 8.621% 2.312% ‐10.577% ‐15.512% ‐10.391% 6.577% 1.185% 5.757% 2.775% ‐3.764% 118.772% 7.177% CAPEX = Total Assets - Total Liabilities ‐812 978 537 1,657 2,193 ‐1,439 2,754 470 434 307 ‐2,653 274 ‐10,960 7.824% CAPEX %Rev ‐17.226% 19.363% 9.731% 23.904% 22.603% ‐13.370% 24.052% 3.825% 3.222% 2.139% ‐19.733% 2.491% 11.602% CAPEX = PPECurrent - PPELast + Depreciation 569 497 739 540 1,193 1,405 1,383 2,576 1,913 626 1,094 1,374 ‐3,416 12.009% CAPEX %Rev 12.069% 9.849% 13.391% 7.793% 12.294% 13.052% 12.076% 20.990% 14.223% 4.353% 8.136% 12.511% 28.518% 31.211% CAPEX %FCFFirm 36.258% 27.110% 37.923% 22.565% 29.005% 31.014% 28.977% 58.093% 32.058% 9.113% 21.919% 46.969% [Agg CapEx]/[Agg Rev] 11.602% Net Operating Working Capital [Alt Calc] 2008 2009 2010 2011 2012 2013 2014 2015 2016 2017 2018 2019 2020 2021 2022 + Total Current Assets 2,481 2,540 2,975 3,244 3,185 4,673 6,700 8,732 7,873 7,641 8,382 6,887 7,857 ‐ Investments In Securities ‐682 ‐448 ‐1,176 ‐1,135 ‐620 ‐640 ‐2,121 ‐2,569 ‐2,115 ‐2,313 ‐1,562 ‐1,279 ‐1,541 ‐ Factor Trade Financing Receivable ‐ Current Liabilities ‐715 ‐1,050 ‐913 ‐1,657 ‐1,758 ‐2,220 ‐2,578 ‐3,420 ‐3,368 ‐3,295 ‐4,864 ‐3,742 ‐4,298 + Current Portion of Debt 20 137 3 453 3 3 5 5 3 1,496 999 19.608% Net Operating Working Capital 1,104 1,179 890 905 810 1,816 2,007 2,748 2,393 2,032 3,452 1,866 3,016 PerCent of Revenue 25.211% 25.004% 17.623% 16.412% 11.684% 18.712% 18.645% 24.006% 19.497% 15.107% 24.006% 13.879% 27.467% Working Capital ‐76 290 ‐16 95 ‐1,006 ‐191 ‐741 355 361 ‐1,419 1,586 ‐1,150 -2.381% -1.364% Working Capital %Rev ‐1.606% 5.736% ‐0.283% 1.376% ‐10.364% ‐1.777% ‐6.477% 2.895% 2.682% ‐9.871% 11.794% ‐10.475% Beharry, Lyndon Martin W. 2022‐07‐15_BIIB_MC‐Equity‐Trials|CAPEXCalc 07/15/2022 18:15 Page 5 of 17
- 6. Equity Valuation 2022‐07‐15_BIIB_MC‐Equity‐Trials Financial Statement Review Statement of Cash Flows CashFlows 1,000,000 $USD 2008 2009 2010 2011 2012 2013 2014 2015 2016 2017 2018 2019 2020 2021 2022 CashFlow from Operating Activities: CFO 1,731 1,499 1,281 2,457 2,603 3,138 3,015 3,834 5,624 6,329 7,963 5,580 2,648 3,558 Indirect Method Net Income 0 970 1,005 1,267 1,380 1,862 2,935 3,547 3,703 2,539 4,474 5,889 4,061 1,556 0 Adjustments D&A 0 718 565 567 568 532 1,178 983 1,068 1,896 1,495 980 930 1,369 0 Deferred Taxes 0 0 0 0 0 0 0 0 0 0 0 0 0 0 0 Decrease / (Increase) in Accounts Receivables ‐551 ‐54 21 ‐102 ‐138 ‐468 65 ‐215 ‐345 ‐172 ‐94 ‐127 238 1,881 Increase / (Decrease) in Inventories ‐294 5 ‐38 ‐121 ‐212 ‐145 ‐89 ‐108 99 ‐27 99 ‐166 ‐449 804 Increase / (Decrease) in Accounts Payable ‐119 ‐44 ‐24 ‐18 ‐16 ‐9 ‐38 ‐12 ‐116 25 ‐135 ‐59 ‐194 531 Increase / (Decrease) in Accrued Interest Receivable Gain / (Loss) on Sale of Property CashFlow from Investing Activities: CFI 724 1,477 1,793 1,708 2,029 3,490 4,468 4,436 4,073 5,795 6,738 4,638 2,520 Indirect Method Cash from Sale of Marketable Securities 685 1,926 226 1,483 719 919 2,433 Cash from Sale of Land Cash from Sale of Other Assets 70 1,585 2,226 1,410 Purchase of Plant & Equipment ‐1,637 ‐5 ‐171 ‐8 ‐15 ‐422 ‐314 ‐2,478 ‐44 ‐197 CashFlow from Financing Activities: CFF ‐952 ‐5 70 1,755 ‐8 ‐15 ‐422 ‐89 ‐995 2,304 875 ‐197 4,659 Indirect Method Cash from Sale of Equity 0 0 0 0 0 0 0 0 0 0 0 0 0 0 0 Cash from Sale of Debt 0 0 0 0 0 0 0 0 0 0 0 0 0 0 0 Cash Interest Paid for Debt 0 ‐36 ‐36 ‐19 ‐30 ‐32 ‐30 ‐96 ‐260 ‐251 ‐201 ‐187 ‐223 0 0 Cash Paid to Redeem Debt 0 ‐20 ‐117 134 ‐450 450 0 ‐2 0 2 3 ‐1,493 3 ‐996 1,496 Cash paid for Dividends 0 0 0 0 0 0 0 0 0 0 0 0 0 0 0 Beharry, Lyndon Martin W. 2022‐07‐15_BIIB_MC‐Equity‐Trials|CashFlows 07/15/2022 18:15 Page 6 of 17
- 7. Equity Valuation 2022‐07‐15_BIIB_MC‐Equity‐Trials Financial Statement Review Complex Debt ForEx Carrying Conversion 1,000,000 $USD Currency Value Rate Long-Term Debt Australian Dollar AUD NA MatDate Coupon Value Annual Canadian Dollar CND NA USD 998 1.00000 2022‐12‐15 3.625% 997.900 36 Chinese Yuan CNY NA USD 1,741 1.00000 2025‐12‐15 4.050% 1,741.000 71 European Union EUR NA USD 1,491 1.00000 2020‐05‐01 2.250% 1,491.100 34 Korean Won KRW NA USD 1,723 1.00000 2045‐09‐15 5.200% 1,723.400 90 South Africa Rand ZAR NA USD 1,473 1.00000 2050‐05‐01 3.150% 1,472.600 46 Swiss CHF NA USD 1.00000 0.000% 0.000 0 US Dollar USD 1.00000 USD 1.00000 0.000% 0.000 0 USD 1.00000 0.000% 0.000 0 USD 1.00000 0.000% 0.000 0 USD 1.00000 0.000% 0.000 0 USD 1.00000 0.000% 0.000 0 USD 1.00000 0.000% 0.000 0 USD 1.00000 0.000% 0.000 0 USD 1.00000 0.000% 0.000 0 USD 1.00000 0.000% 0.000 0 USD 1.00000 0.000% 0.000 0 USD 1.00000 0.000% 0.000 0 USD 1.00000 0.000% 0.000 0 USD 1.00000 0.000% 0.000 0 USD 1.00000 0.000% 0.000 0 USD 1.00000 0.000% 0.000 0 USD 1.00000 0.000% 0.000 0 USD 1.00000 0.000% 0.000 0 USD 1.00000 0.000% 0.000 0 USD 1.00000 0.000% 0.000 0 USD 1.00000 0.000% 0.000 0 USD 1.00000 0.000% 0.000 0 USD 1.00000 0.000% 0.000 0 USD 1.00000 0.000% 0.000 0 USD 1.00000 0.000% 0.000 0 USD 1.00000 0.000% 0.000 0 USD 1.00000 0.000% 0.000 0 USD 1.00000 0.000% 0.000 0 USD 1.00000 0.000% 0.000 0 USD 1.00000 0.000% 0.000 0 USD 1.00000 0.000% 0.000 0 USD 1.00000 0.000 0 USD 1.00000 0.000 0 USD 1.00000 0.000 0 USD 1.00000 0.000 0 USD 1.00000 0.000 0 USD 1.00000 0.000 0 USD 1.00000 0.000 0 USD 1.00000 0.000 0 0.00000 0.000 0 0.00000 0.000 0 0.00000 0.000 0 0.00000 0.000 0 0.00000 0.000 0 0.00000 0.000 0 0.00000 0.000 0 0.00000 0.000 0 0.00000 0.000 0 0.00000 0.000 0 0.00000 0.000 0 0.00000 0.000 0 0.00000 0.000 0 0.00000 0.000 0 0.00000 0.000 0 0.00000 0.000 0 0.00000 0.000 0 0.00000 0.000 0 0.00000 0.000 0 0.00000 0.000 0 0.00000 0.000 0 0.00000 0.000 0 0.00000 0.000 0 0.00000 0.000 0 0.00000 0.000 0 0.00000 0.000 0 0.00000 0.000 0 0.00000 0.000 0 0.00000 0.000 0 0.00000 0.000 0 0.00000 0.000 0 … 7,426 276 3.720% Beharry, Lyndon Martin W. 2022‐07‐15_BIIB_MC‐Equity‐Trials|Complex Debt 07/15/2022 18:15 Page 7 of 17
- 8. Equity Valuation 2022‐07‐15_BIIB_MC‐Equity‐Trials Financial Statement Review BIIB: Biogen Inc. | FEIN 33‐0112644 WACCCalc ACCOUNT FOR CURRENT AND LONG‐TERM LIABILITIES Yes DCF analysis will deduct the total value of liabilities from the firm's cash position. Functional Currency: 1,000,000 $USD DCF ACCOUNTS FOR CASH AND ALL OTHER ASSETS (YES); ONLY CASH AND SHORT‐TERM (NO) No To assess liquidity at T₀, DCF analysis will deduct Balance Sheet Liabilities from Cash + Short‐term securities. Debt B Calculations [for Weighted Average Cost of Debt]: FIRE SALE VALUE FOR ASSETS OTHER THAN CASH: 85.000% 1,000,000 Long-Term Debt COST OF DEBT 3.720% MatDate Coupon Value Annual TAX ADJUSTED 2.939% 2018‐09‐01 8.000% 0 OUTSTANDING DEBT OBLIGATIONS 13,895 2.700% 0 0 $USD CURRENCY COST OF DEBT ISSUE. 14,304 1.550% 0 0 6.800% 0 0 2.250% 0 0 COST OF PREFERRED STOCK 0.000% 2.960% 0 0 WEIGHTED MARKET PRICE OF PREFERRED STOCK 0.000 2.400% 0 0 WEIGHTED AVERAGE OF OUTSTANDING PREFERRED STOCK 0 2.150% 0 0 $USD CURRENCY COST OF PREFERRED CAPITAL. 0 2.400% 0 0 2.850% 0 0 2.550% 0 0 MARKET PRICE OF COMMON STOCK 217.010 3.500% 0 0 RECENT SHARES OUT 146 4.625% 0 0 OUTSTANDING COMMON STOCK: ESTIMATETTM = AVG(RECENT,10K FIGURE) 179 Adjusted for Treasury Stock 4.540% 0 RETAINED EARNINGS 16,455 4.580% 0 $USD CURRENCY COST OF COMMON CAPITAL: CAPITALIZATION. 35,294 13,339 BALANCE SHEET SE 1.920% 0 2.610% 0 DIVIDEND IN $USD 0.000 2.840% 0 DIVIDEND YIELD RATE 0.000% 4.150% 0 ONE YR EXPECTED $USD RETURN PER SHARE = [MARKET PRICE X (1+ER)] + DIVIDEND 226.284 1.890% 0 ACTUAL RETURN ON EQUITY: ER for TTM 14.198% 14.090% TTM VALUE EXPECTED RETURN ON EQUITYUPPER: Including Risk Premium 14.429% MEAN OF FINANCIALS AND TTM 0 0 GORDON DIVIDEND RoE IMPUTED ke 8.448% Cost of Long Term Debt 0.000% HISTORICAL 0.390 CAPM FOR COMMON STOCK E(ri) = rf + [E(rm)-rf] LOWER 4.274% Long Term Debt 7,426 ESTIMATE THE COST OF EQUITY ON EXPECTED RoE OR CAPM? WAAC CAPMKe Cost 3.72% WACC MEAN 3.889% Short Term Debt 0 Cost 0.00% ESTIMATED SHORT-TERM RISK FREE RATE: T-BILL OR OTHER 2.850% Revolving Debt 0 OVERALL HISTORIC MARKET RETURN 6.500% Cost 0.00% PERPETUITY GROWTH RATE = INFLATION 2.500% Average Debt Cost 3.720% PERPETUITY DISCOUNT FACTORWACC-PERPETUITY GROWTH RATE 4.360% WACC Monte 6.860% TIME HORIZON (YEARS) FOR SCENARIO 10 CAPM Target Price in 1 Years: 226.284 DCF PROJECTED PRICE PER SHARE AT THESE VARIABLES: 299.016 AVERAGE INTERNAL REVENUE GROWTH RATE TIMET-10,T Beharry, Lyndon Martin W. 2022‐07‐15_BIIB_MC‐Equity‐Trials|WACCCalc 07/15/2022 18:15 Page 8 of 17
- 9. Equity Valuation 2022‐07‐15_BIIB_MC‐Equity‐Trials Financial Statement Review Variables Monetary Values In 1,000,000 $USD (Except Per Share Values). BIIB: Biogen Inc. | FEIN 33‐0112644 Currency $USD Note: This sheet carries decimals to 3 places: 0.000 . Biogen is a global biopharmaceutical company focused on discovering, developing and delivering worldwide innovative therapies for people living with serious neurological and neurodegenerative diseases as well as related therapeutic adjacencies. Our core growth areas include multiple sclerosis (MS) and neuroimmunology; Alzheimer’s disease and dementia; neuromuscular disorders, including spinal muscular atrophy (SMA) and amyotrophic lateral sclerosis (ALS); movement disorders, including Parkinson's disease; ophthalmology; and neuropsychiatry. We are also focused on discovering, developing and delivering worldwide innovative therapies in our emerging growth areas of immunology; acute neurology; and neuropathic pain... (FY: 2020‐12‐31) User may vary input into shaded cells. Complete the IncStmntReview and BalShtReview worksheets. Complete this page; then run your simulation here. The most recent FY end (type year): 2022 Adjust Base Year for TTM Estimate Yes Calculate Statistics through FY: 2021 Mean Historical Alternate 10.000% Coefficient of Variation Target Cut-off Variables Estimate STDEV Rate Revenue Growth Rate 8.822% 14.293% High deviation. Coefficient of Variation=162.02% Use an alternate rate. Alternative Revenue Growth RateDCF 0.00000% 0.000% 0.00% + / - Growth Per Annum Monte Carlo DCF: $USD BIIB: Biogen Inc. | FEIN 33-0112644 Projected Growth Rate Y1 0.000% 0.000% Use Alternate Rates: Yes 0.000% 0.000% AGGR CoGS : f(Revenue) 6.167% 4.368% 7.250% 7.250% High deviation. Coefficient of Variation=70.83% Use an alternate rate. Depreciation/Amortization [COGs] : f(Revenue) 10.841% 2.959% 5.640% 5.640% High deviation. Coefficient of Variation=27.30% Use an alternate rate. SGA (Only) : f(Revenue) 23.551% 4.994% 21.935% 21.935% High deviation. Coefficient of Variation=21.21% Use an alternate rate. R&D : f(Revenue) 8.173% 4.490% 21.159% 21.159% 21.159% High deviation. Coefficient of Variation=54.93% Use an alternate rate. Depreciation/Amortization [SGA] : f(Revenue) 4.834% 1.499% 4.802% 4.802% High deviation. Coefficient of Variation=31.00% Use an alternate rate. Total Other Overhead : f(Revenue) 4.834% 1.499% 4.834% 4.802% Operating expense has a high deviation=31.00% Check rates of member elements. Other Expense (Income) : f(Revenue) -0.239% 3.399% ‐0.287% ‐0.287% High deviation. Coefficient of Variation=1424.92% Use an alternate rate. Interest Expense (Income) : f(Revenue) 0.993% 0.704% 1.250% 1.137% 1.250% High deviation. Coefficient of Variation=70.84% Use an alternate rate. Tax Rate : f(EBT) 24.211% 9.645% 21.000% 24.742% High deviation. Coefficient of Variation=39.84% Use an alternate rate. Capital Expenditures : f(Revenue) 11.728% 4.090% 11.602% 11.602% High deviation. Coefficient of Variation=34.87% Use an alternate rate. Δ Working Capital : f(Revenue) -2.381% 6.938% -5.000% ‐1.364% High deviation. Coefficient of Variation=291.37% Use an alternate rate. Working Capital : f(Revenue) 32.526% 7.770% 31.257% 31.257% High deviation. Coefficient of Variation=23.89% Use an alternate rate. Equity Minority Interest : f(Revenue) 0.135% 0.833% 0.135% 0.135% High deviation. Coefficient of Variation=615.29% Use an alternate rate. Financial Ratios | FY 2021 Current 1.82785817 Acid Test 0.88467265 No Include Accounts Receivable? Debt:Equity 1.1786454 Debt:Debt+Equity 0.54099919 RoA (Adjusted for D&A) 0.06517069 RoE 0.14198381 Gordon Dividend Payout Model: Book Value of the Firm $USD1,000,000 10,960 Book Value Per Share BV0 74.836 Dividend Growth Rate (Gordon Model) gn 5.000% -4.175% Δ KE : [CAPM - Gordon] ke = [(RoE - gn ) X (BV0 / P0)] + gn 8.448% No Actual RoE (Yes); Expected RoE (No) P0/BV0 = PBV = [(RoE-gn)/(ke-gn) 2.8998161 Price Multiple : BV0 2.900 Forecast Share Price From Multiple X BV0 217.010 Static Model: DCF Valuation Per Share 299.016 Growth Rate: 0.00% less 0.00% each subsequent year after T₁. $USD 299.016 VARIABLES FOR WACC CALCULATIONS Market and CAPM Modelling 2.850% Risk‐Free Rate (T‐Bill/Bond/Note, LIBOR or other imputed rate) 6.500% Overall historic Market Return Equity Share Variables 217.010 Current Market Price of Common Stock 0.000 Dividend, if applicable 0.390 eta 14.090% Return on Equity TTM 15.000% Expected Return on Equity 146.450 Current Shares Outstanding (diluted) Including Treasury Holdings in 1,000,000's Preferred Share Variables Current Market Price of Preferred Stock: A, if applicable 0 Current shares outstanding 1,000,000 Preferred: A stock coupon Current Market Price of Preferred Stock: B, if applicable 0 Current shares outstanding 1,000,000 Preferred: B stock coupon Current Market Price of Preferred Stock: C, if applicable 0 Current shares outstanding 1,000,000 Preferred: C stock coupon Current Market Price of Preferred Stock: D, if applicable 0 Current shares outstanding 1,000,000 Preferred: D stock coupon 0 Weighted Number of Preferred Shares Outstanding 0.000% Weighted Cost (Coupon) of Preferred Shares Outstanding 0.000 Weighted Market Price of Preferred Perpetuity Growth Rate Inflation Long‐term Growth Rate (for perpetuity model) 2.500% Long‐Term Inflation Rate 3.580% Average Long‐Term Inflation Rate: U.S.A. 4.274% CAPM KE Basis of WACC Calculation WACC Gordon RoE CALCULATE DISCOUNT RATE VARYING EQUITY WEIGHTING: WACC, CAPM, GORDON RoE, AVERAGE OF CAPM AND GORDON RoE? Yes VARY WACC AROUND ITS MEAN? 2.000% AT THIS COEFFICIENT OF VARIATION ( PERCENT OF THE MEAN). 6.860% WACC FOR SIMULATION ALTERNATE PLUG FOR WACC DISCOUNT FACTOR Forecast Results Summary Per Share 212.509 P/E Valuation 20.000 PE Forward 226.284 CAPM Valuation No Revenue Growth 217.010 BV0 Multiple Valuation 299.016 Static DCF Valuation 294.181 Monte Carlo DCF Valuation 249.800 of All Models Valuation Monte Carlo Analysis: 294.181 Monte Carlo DCF 2.500 483.895 Monte Carlo Upper 483.895 140.600 Monte Carlo Lower 140.600 343.295 Monte Carlo Range 116.695% Range:Mean Lognormal Distribution The header (top) is higher | lower than the complement (left). Ratio Comparison of the Models P/E CAPM Gordon BV0 Static DCF MC DCF Models P/E 0.000% 6.482% 2.118% 40.707% 38.432% 17.548% CAPM ‐6.087% 0.000% ‐4.098% 32.142% 30.005% 10.392% Gordon BV0 ‐2.074% 4.274% 0.000% 37.789% 35.561% 15.110% Static DCF ‐28.930% ‐24.324% ‐27.425% 0.000% ‐1.617% ‐16.459% MC DCF ‐27.762% ‐23.080% ‐26.233% 1.643% 0.000% ‐15.086% Models ‐14.928% ‐9.414% ‐13.127% 19.702% 17.767% 0.000% Beharry, Lyndon Martin W. 2022‐07‐15_BIIB_MC‐Equity‐Trials|Variables 07/15/2022 18:15 Page 9 of 17
- 10. Equity Valuation 2022‐07‐15_BIIB_MC‐Equity‐Trials Financial Statement Review Type alternative annual growth rates here: BIIB: Biogen Inc. | FEIN 33‐0112644: Monte Carlo: Valuation Per Share | $USD Mask Monetary Values In 1,000,000 $USD (Except Per Share Values). 1,000,000 $USD Revenue Growth Rate2022 Revenue Growth Rate2023 Revenue Growth Rate2024 Revenue Growth Rate2025 Revenue Growth Rate2026 Revenue Growth Rate2027 Revenue Growth Rate2028 Revenue Growth Rate2029 Revenue Growth Rate2030 Revenue Growth Rate2031 Revenue Growth Rate2032 Projection Base [FY] Year T0 2022 2022 2022 2023 2024 2025 2026 2027 2028 2029 2030 2031 2032 Mean STDEV 0 1 2 3 4 5 6 7 8 9 10 Revenue Growth Rate 2022 00.0% Revenue Growth Rate 2023 00.0% Revenue Growth Rate 2024 00.0% Revenue Growth Rate 2025 00.0% Revenue Growth Rate 2026 00.0% Revenue Growth Rate 2027 00.0% Revenue Growth Rate 2028 00.0% Revenue Growth Rate 2029 00.0% Revenue Growth Rate 2030 00.0% Revenue Growth Rate 2031 00.0% Revenue Growth Rate 2032 00.0% 0.000% 0.000% Random Growth Rate Sequential Reduction 0.000% Alternate Coefficient of Variability 10.00% 0.00% 0.00% 0.00% 0.00% 0.00% 0.00% 0.00% 0.00% 0.00% 0.00% 0.00% Timet0 Timet+1 Timet+2 Timet+3 Timet+4 Timet+5 Timet+6 Timet+7 Timet+8 Timet+9 Timet+10 Timet+11 Projection TimeT1 14,378 MONTE CARLO REVENUE 14,378 14,378 14,378 14,378 14,378 14,378 14,378 14,378 14,378 14,378 14,378 CoGS : f(Revenue)2022 CoGS : f(Revenue)2023 CoGS : f(Revenue)2024 CoGS : f(Revenue)2025 CoGS : f(Revenue)2026 CoGS : f(Revenue)2027 CoGS : f(Revenue)2028 CoGS : f(Revenue)2029 CoGS : f(Revenue)2030 CoGS : f(Revenue)2031 CoGS : f(Revenue)2032 7.250% 0.725% CoGS: 0.00% 0 0 0 0 0 0 0 0 0 0 0 Depreciation/Amortization [COGs] : f(Revenue)2022 Depreciation/Amortization [COGs] : f(Revenue)2023 Depreciation/Amortization [COGs] : f(Revenue)2024 Depreciation/Amortization [COGs] : f(Revenue)2025 Depreciation/Amortization [COGs] : f(Revenue)2026 Depreciation/Amortization [COGs] : f(Revenue)2027 Depreciation/Amortization [COGs] : f(Revenue)2028 Depreciation/Amortization [COGs] : f(Revenue)2029 Depreciation/Amortization [COGs] : f(Revenue)2030 Depreciation/Amortization [COGs] : f(Revenue)2031 Depreciation/Amortization [COGs] : f(Revenue)2032 5.640% 0.564% D&A (Production): 0.00% 0 0 0 0 0 0 0 0 0 0 0 GROSS MARGIN: 100.00% 14,378 14,378 14,378 14,378 14,378 14,378 14,378 14,378 14,378 14,378 14,378 SGA (Only) : f(Revenue)2022 SGA (Only) : f(Revenue)2023 SGA (Only) : f(Revenue)2024 SGA (Only) : f(Revenue)2025 SGA (Only) : f(Revenue)2026 SGA (Only) : f(Revenue)2027 SGA (Only) : f(Revenue)2028 SGA (Only) : f(Revenue)2029 SGA (Only) : f(Revenue)2030 SGA (Only) : f(Revenue)2031 SGA (Only) : f(Revenue)2032 21.935% 2.194% Administrative Costs: SGA: 0.00% 0 0 0 0 0 0 0 0 0 0 0 R&D : f(Revenue)2022 R&D : f(Revenue)2023 R&D : f(Revenue)2024 R&D : f(Revenue)2025 R&D : f(Revenue)2026 R&D : f(Revenue)2027 R&D : f(Revenue)2028 R&D : f(Revenue)2029 R&D : f(Revenue)2030 R&D : f(Revenue)2031 R&D : f(Revenue)2032 21.159% 2.116% R & D: 0.00% 0 0 0 0 0 0 0 0 0 0 0 Depreciation/Amortization [SGA] : f(Revenue)2022 Depreciation/Amortization [SGA] : f(Revenue)2023 Depreciation/Amortization [SGA] : f(Revenue)2024 Depreciation/Amortization [SGA] : f(Revenue)2025 Depreciation/Amortization [SGA] : f(Revenue)2026 Depreciation/Amortization [SGA] : f(Revenue)2027 Depreciation/Amortization [SGA] : f(Revenue)2028 Depreciation/Amortization [SGA] : f(Revenue)2029 Depreciation/Amortization [SGA] : f(Revenue)2030 Depreciation/Amortization [SGA] : f(Revenue)2031 Depreciation/Amortization [SGA] : f(Revenue)2032 4.802% 0.480% D & A [SGA]: 0.00% 0 0 0 0 0 0 0 0 0 0 0 Admin Expenses: 0.00% 0 0 0 0 0 0 0 0 0 0 0 Other Expense (Income) : f(Revenue)2022 Other Expense (Income) : f(Revenue)2023 Other Expense (Income) : f(Revenue)2024 Other Expense (Income) : f(Revenue)2025 Other Expense (Income) : f(Revenue)2026 Other Expense (Income) : f(Revenue)2027 Other Expense (Income) : f(Revenue)2028 Other Expense (Income) : f(Revenue)2029 Other Expense (Income) : f(Revenue)2030 Other Expense (Income) : f(Revenue)2031 Other Expense (Income) : f(Revenue)2032 -0.287% 0.029% Other: 0.00% 0 0 0 0 0 0 0 0 0 0 0 EBIT: 100.00% 14,378 14,378 14,378 14,378 14,378 14,378 14,378 14,378 14,378 14,378 14,378 Interest Expense (Income) : f(Revenue)2022 Interest Expense (Income) : f(Revenue)2023 Interest Expense (Income) : f(Revenue)2024 Interest Expense (Income) : f(Revenue)2025 Interest Expense (Income) : f(Revenue)2026 Interest Expense (Income) : f(Revenue)2027 Interest Expense (Income) : f(Revenue)2028 Interest Expense (Income) : f(Revenue)2029 Interest Expense (Income) : f(Revenue)2030 Interest Expense (Income) : f(Revenue)2031 Interest Expense (Income) : f(Revenue)2032 1.250% 0.125% Interest Expense: 0.00% 0 0 0 0 0 0 0 0 0 0 0 EBT: 100.00% 14,378 14,378 14,378 14,378 14,378 14,378 14,378 14,378 14,378 14,378 14,378 Tax Rate : f(EBT)2022 Tax Rate : f(EBT)2023 Tax Rate : f(EBT)2024 Tax Rate : f(EBT)2025 Tax Rate : f(EBT)2026 Tax Rate : f(EBT)2027 Tax Rate : f(EBT)2028 Tax Rate : f(EBT)2029 Tax Rate : f(EBT)2030 Tax Rate : f(EBT)2031 Tax Rate : f(EBT)2032 21.000% 2.100% Taxes: 0.00% 0 0 0 0 0 0 0 0 0 0 0 Tax Payable Tax Payable Tax Payable Tax Payable Tax Payable Tax Payable Tax Payable Tax Payable Tax Payable Tax Payable Tax Payable NET EARNINGS: 100.00% 14,378 14,378 14,378 14,378 14,378 14,378 14,378 14,378 14,378 14,378 14,378 D&A Add‐Back: 0.00% 0 0 0 0 0 0 0 0 0 0 0 Capital Expenditures : f(Revenue)2022 Capital Expenditures : f(Revenue)2023 Capital Expenditures : f(Revenue)2024 Capital Expenditures : f(Revenue)2025 Capital Expenditures : f(Revenue)2026 Capital Expenditures : f(Revenue)2027 Capital Expenditures : f(Revenue)2028 Capital Expenditures : f(Revenue)2029 Capital Expenditures : f(Revenue)2030 Capital Expenditures : f(Revenue)2031 Capital Expenditures : f(Revenue)2032 11.602% 1.160% CAP EX: 0.00% 0 0 0 0 0 0 0 0 0 0 0 Δ Working Capital : f(Revenue)2022 Δ Working Capital : f(Revenue)2023 Δ Working Capital : f(Revenue)2024 Δ Working Capital : f(Revenue)2025 Δ Working Capital : f(Revenue)2026 Δ Working Capital : f(Revenue)2027 Δ Working Capital : f(Revenue)2028 Δ Working Capital : f(Revenue)2029 Δ Working Capital : f(Revenue)2030 Δ Working Capital : f(Revenue)2031 Δ Working Capital : f(Revenue)2032 -5.000% 0.500% Δ WRK CAP: 0.00% 0 0 0 0 0 0 0 0 0 0 0 Equity Minority Interest : f(Revenue)2022 Equity Minority Interest : f(Revenue)2023 Equity Minority Interest : f(Revenue)2024 Equity Minority Interest : f(Revenue)2025 Equity Minority Interest : f(Revenue)2026 Equity Minority Interest : f(Revenue)2027 Equity Minority Interest : f(Revenue)2028 Equity Minority Interest : f(Revenue)2029 Equity Minority Interest : f(Revenue)2030 Equity Minority Interest : f(Revenue)2031 Equity Minority Interest : f(Revenue)2032 -0.135% 0.013% EARN AFFL: 0.00% 0 0 0 0 0 0 0 0 0 0 0 ‐14,304 LESS CURRENT DEBT AND OTHER LONG-TERM LIABILITIES T₀ (Adjusted for Carrying Costs ) 0 LESS PREFERRED AT PAR T₀ 4,476 EXCESS CASH & SHORT-TERM SECURITIES T₀ GROWTH 2.500% DCF analysis will deduct the total value of liabilities from the firm's cash position. PERPETUITY VALUE FCF to Equity 14,378 14,378 14,378 14,378 14,378 14,378 14,378 14,378 14,378 14,378 14,378 338,050 WACC FOR SIMULATION 6.860% 0.137% To assess liquidity at T₀, DCF analysis will deduct Balance Sheet Liabilities from Cash + Short‐term securities. DCF to the Investors 486,380 DCF analysis will deduct the total value of liabilities from the firm's cash position. BIIB: Biogen Inc. | FEIN 33-0112644: Monte Carlo: Valuation Per Share | $USD PER SHARE Beharry, Lyndon Martin W. 2022‐07‐15_BIIB_MC‐Equity‐Trials|DCF All Variable_MC 07/15/2022 18:15 Page 10 of 17
- 11. Equity Valuation 2022‐07‐15_BIIB_MC‐Equity‐Trials Financial Statement Review Type alternative annual growth rates here: BIIB: Biogen Inc. | FEIN 33‐0112644: Monte Carlo: Valuation Per Share | $USD Mask Monetary Values In 1,000,000 $USD (Except Per Share Values). 1,000,000 $USD Revenue Growth Rate2022 Revenue Growth Rate2023 Revenue Growth Rate2024 Revenue Growth Rate2025 Revenue Growth Rate2026 Revenue Growth Rate2027 Revenue Growth Rate2028 Revenue Growth Rate2029 Revenue Growth Rate2030 Revenue Growth Rate2031 Revenue Growth Rate2032 Projection Base [FY] Year T0 2022 2022 2022 2023 2024 2025 2026 2027 2028 2029 2030 2031 2032 Mean STDEV 0 1 2 3 4 5 6 7 8 9 10 Revenue Growth Rate 2022 00.0% Revenue Growth Rate 2023 00.0% Revenue Growth Rate 2024 00.0% Revenue Growth Rate 2025 00.0% Revenue Growth Rate 2026 00.0% Revenue Growth Rate 2027 00.0% Revenue Growth Rate 2028 00.0% Revenue Growth Rate 2029 00.0% Revenue Growth Rate 2030 00.0% Revenue Growth Rate 2031 00.0% Revenue Growth Rate 2032 00.0% 0.000% 0.000% Random Growth Rate 0.00% 0.00% 0.00% 0.00% 0.00% 0.00% 0.00% 0.00% 0.00% 0.00% 0.00% Sequential Reduction 0.000% Alternate Coefficient of Variability 10.00% 0.00% 0.00% 0.00% 0.00% 0.00% 0.00% 0.00% 0.00% 0.00% 0.00% 0.00% Timet0 Timet+1 Timet+2 Timet+3 Timet+4 Timet+5 Timet+6 Timet+7 Timet+8 Timet+9 Timet+10 Timet+11 Projection TimeT1 14,378 MONTE CARLO REVENUE 14,378 14,378 14,378 14,378 14,378 14,378 14,378 14,378 14,378 14,378 14,378 CoGS : f(Revenue)2022 CoGS : f(Revenue)2023 CoGS : f(Revenue)2024 CoGS : f(Revenue)2025 CoGS : f(Revenue)2026 CoGS : f(Revenue)2027 CoGS : f(Revenue)2028 CoGS : f(Revenue)2029 CoGS : f(Revenue)2030 CoGS : f(Revenue)2031 CoGS : f(Revenue)2032 7.250% 0.725% 7.584% 6.949% 6.386% 5.624% 7.982% 8.138% 7.320% 7.654% 8.186% 5.572% 5.967% CoGS: 7.03% ‐1,090 ‐999 ‐918 ‐809 ‐1,148 ‐1,170 ‐1,053 ‐1,101 ‐1,177 ‐801 ‐858 Depreciation/Amortization [COGs] : f(Revenue)2022 Depreciation/Amortization [COGs] : f(Revenue)2023 Depreciation/Amortization [COGs] : f(Revenue)2024 Depreciation/Amortization [COGs] : f(Revenue)2025 Depreciation/Amortization [COGs] : f(Revenue)2026 Depreciation/Amortization [COGs] : f(Revenue)2027 Depreciation/Amortization [COGs] : f(Revenue)2028 Depreciation/Amortization [COGs] : f(Revenue)2029 Depreciation/Amortization [COGs] : f(Revenue)2030 Depreciation/Amortization [COGs] : f(Revenue)2031 Depreciation/Amortization [COGs] : f(Revenue)2032 5.640% 0.564% 5.498% 5.039% 5.512% 6.065% 5.313% 6.018% 5.929% 5.845% 5.888% 5.781% 4.609% D&A (Production): 5.59% ‐790 ‐724 ‐792 ‐872 ‐764 ‐865 ‐852 ‐840 ‐847 ‐831 ‐663 GROSS MARGIN: 87.38% 12,497 12,654 12,667 12,697 12,466 12,343 12,473 12,437 12,354 12,746 12,857 SGA (Only) : f(Revenue)2022 SGA (Only) : f(Revenue)2023 SGA (Only) : f(Revenue)2024 SGA (Only) : f(Revenue)2025 SGA (Only) : f(Revenue)2026 SGA (Only) : f(Revenue)2027 SGA (Only) : f(Revenue)2028 SGA (Only) : f(Revenue)2029 SGA (Only) : f(Revenue)2030 SGA (Only) : f(Revenue)2031 SGA (Only) : f(Revenue)2032 21.935% 2.194% Administrative Costs: 24.084% 22.419% 21.256% 22.287% 18.800% 23.842% 22.714% 20.743% 20.975% 18.954% 21.427% SGA: 24.08% ‐3,463 ‐3,463 ‐3,463 ‐3,463 ‐3,463 ‐3,463 ‐3,463 ‐3,463 ‐3,463 ‐3,463 ‐3,463 R&D : f(Revenue)2022 R&D : f(Revenue)2023 R&D : f(Revenue)2024 R&D : f(Revenue)2025 R&D : f(Revenue)2026 R&D : f(Revenue)2027 R&D : f(Revenue)2028 R&D : f(Revenue)2029 R&D : f(Revenue)2030 R&D : f(Revenue)2031 R&D : f(Revenue)2032 21.159% 2.116% 23.746% 24.376% 19.744% 20.025% 22.569% 17.577% 19.011% 22.984% 20.162% 23.898% 22.099% R & D: 21.47% ‐3,414 ‐3,505 ‐2,839 ‐2,879 ‐3,245 ‐2,527 ‐2,733 ‐3,305 ‐2,899 ‐3,436 ‐3,177 Depreciation/Amortization [SGA] : f(Revenue)2022 Depreciation/Amortization [SGA] : f(Revenue)2023 Depreciation/Amortization [SGA] : f(Revenue)2024 Depreciation/Amortization [SGA] : f(Revenue)2025 Depreciation/Amortization [SGA] : f(Revenue)2026 Depreciation/Amortization [SGA] : f(Revenue)2027 Depreciation/Amortization [SGA] : f(Revenue)2028 Depreciation/Amortization [SGA] : f(Revenue)2029 Depreciation/Amortization [SGA] : f(Revenue)2030 Depreciation/Amortization [SGA] : f(Revenue)2031 Depreciation/Amortization [SGA] : f(Revenue)2032 4.802% 0.480% 3.986% 5.994% 5.322% 5.018% 4.540% 4.939% 4.870% 6.133% 5.340% 4.789% 5.419% D & A [SGA]: 5.12% ‐573 ‐862 ‐765 ‐721 ‐653 ‐710 ‐700 ‐882 ‐768 ‐688 ‐779 Admin Expenses: 50.68% ‐7,450 ‐7,829 ‐7,067 ‐7,063 ‐7,361 ‐6,700 ‐6,896 ‐7,649 ‐7,129 ‐7,587 ‐7,419 Other Expense (Income) : f(Revenue)2022 Other Expense (Income) : f(Revenue)2023 Other Expense (Income) : f(Revenue)2024 Other Expense (Income) : f(Revenue)2025 Other Expense (Income) : f(Revenue)2026 Other Expense (Income) : f(Revenue)2027 Other Expense (Income) : f(Revenue)2028 Other Expense (Income) : f(Revenue)2029 Other Expense (Income) : f(Revenue)2030 Other Expense (Income) : f(Revenue)2031 Other Expense (Income) : f(Revenue)2032 -0.287% 0.029% ‐0.307% ‐0.339% ‐0.266% ‐0.299% ‐0.296% ‐0.310% ‐0.305% ‐0.274% ‐0.234% ‐0.302% ‐0.277% Other: ‐0.29% 44 49 38 43 43 45 44 39 34 43 40 EBIT: 36.99% 5,091 4,874 5,639 5,677 5,148 5,687 5,620 4,827 5,259 5,202 5,478 Interest Expense (Income) : f(Revenue)2022 Interest Expense (Income) : f(Revenue)2023 Interest Expense (Income) : f(Revenue)2024 Interest Expense (Income) : f(Revenue)2025 Interest Expense (Income) : f(Revenue)2026 Interest Expense (Income) : f(Revenue)2027 Interest Expense (Income) : f(Revenue)2028 Interest Expense (Income) : f(Revenue)2029 Interest Expense (Income) : f(Revenue)2030 Interest Expense (Income) : f(Revenue)2031 Interest Expense (Income) : f(Revenue)2032 1.250% 0.125% 1.368% 1.212% 1.122% 1.175% 1.522% 1.463% 1.250% 1.216% 1.388% 1.263% 1.291% Interest Expense: 1.30% ‐197 ‐174 ‐161 ‐169 ‐219 ‐210 ‐180 ‐175 ‐200 ‐182 ‐186 EBT: 35.69% 4,894 4,699 5,477 5,508 4,930 5,477 5,441 4,652 5,059 5,020 5,292 Tax Rate : f(EBT)2022 Tax Rate : f(EBT)2023 Tax Rate : f(EBT)2024 Tax Rate : f(EBT)2025 Tax Rate : f(EBT)2026 Tax Rate : f(EBT)2027 Tax Rate : f(EBT)2028 Tax Rate : f(EBT)2029 Tax Rate : f(EBT)2030 Tax Rate : f(EBT)2031 Tax Rate : f(EBT)2032 21.000% 2.100% 24.070% 20.531% 23.397% 20.453% 19.775% 22.677% 22.369% 21.393% 21.454% 19.839% 19.848% Taxes: 21.46% ‐1,178 ‐965 ‐1,282 ‐1,127 ‐975 ‐1,242 ‐1,217 ‐995 ‐1,085 ‐996 ‐1,050 Tax Payable Tax Payable Tax Payable Tax Payable Tax Payable Tax Payable Tax Payable Tax Payable Tax Payable Tax Payable Tax Payable NET EARNINGS: 28.03% 3,716 3,735 4,196 4,381 3,955 4,235 4,224 3,657 3,974 4,024 4,242 D&A Add‐Back: 10.71% 1,364 1,586 1,558 1,593 1,417 1,575 1,553 1,722 1,614 1,520 1,442 Capital Expenditures : f(Revenue)2022 Capital Expenditures : f(Revenue)2023 Capital Expenditures : f(Revenue)2024 Capital Expenditures : f(Revenue)2025 Capital Expenditures : f(Revenue)2026 Capital Expenditures : f(Revenue)2027 Capital Expenditures : f(Revenue)2028 Capital Expenditures : f(Revenue)2029 Capital Expenditures : f(Revenue)2030 Capital Expenditures : f(Revenue)2031 Capital Expenditures : f(Revenue)2032 11.602% 1.160% 10.932% 14.993% 10.991% 9.410% 10.800% 12.190% 10.843% 11.922% 12.351% 12.956% 12.409% CAP EX: 11.80% ‐1,572 ‐2,156 ‐1,580 ‐1,353 ‐1,553 ‐1,753 ‐1,559 ‐1,714 ‐1,776 ‐1,863 ‐1,784 Δ Working Capital : f(Revenue)2022 Δ Working Capital : f(Revenue)2023 Δ Working Capital : f(Revenue)2024 Δ Working Capital : f(Revenue)2025 Δ Working Capital : f(Revenue)2026 Δ Working Capital : f(Revenue)2027 Δ Working Capital : f(Revenue)2028 Δ Working Capital : f(Revenue)2029 Δ Working Capital : f(Revenue)2030 Δ Working Capital : f(Revenue)2031 Δ Working Capital : f(Revenue)2032 -5.000% 0.500% ‐5.345% ‐4.780% ‐5.175% ‐6.531% ‐5.116% ‐5.622% ‐4.672% ‐4.225% ‐4.850% ‐4.674% ‐5.336% Δ WRK CAP: ‐5.12% ‐768 ‐687 ‐744 ‐939 ‐736 ‐808 ‐672 ‐608 ‐697 ‐672 ‐767 Equity Minority Interest : f(Revenue)2022 Equity Minority Interest : f(Revenue)2023 Equity Minority Interest : f(Revenue)2024 Equity Minority Interest : f(Revenue)2025 Equity Minority Interest : f(Revenue)2026 Equity Minority Interest : f(Revenue)2027 Equity Minority Interest : f(Revenue)2028 Equity Minority Interest : f(Revenue)2029 Equity Minority Interest : f(Revenue)2030 Equity Minority Interest : f(Revenue)2031 Equity Minority Interest : f(Revenue)2032 -0.135% 0.013% ‐0.129% ‐0.151% ‐0.135% ‐0.129% ‐0.161% ‐0.127% ‐0.136% ‐0.106% ‐0.148% ‐0.112% ‐0.154% EARN AFFL: ‐0.14% ‐19 ‐22 ‐19 ‐19 ‐23 ‐18 ‐19 ‐15 ‐21 ‐16 ‐22 ‐14,304 LESS CURRENT DEBT AND OTHER LONG-TERM LIABILITIES T₀ (Adjusted for Carrying Costs ) 0 LESS PREFERRED AT PAR T₀ 4,476 EXCESS CASH & SHORT-TERM SECURITIES T₀ GROWTH 2.500% DCF analysis will deduct the total value of liabilities from the firm's cash position. PERPETUITY VALUE FCF to Equity 2,721 2,456 3,410 3,664 3,060 3,231 3,526 3,042 3,094 2,993 3,110 73,124 WACC FOR SIMULATION 6.860% 0.137% To assess liquidity at T₀, DCF analysis will deduct Balance Sheet Liabilities from Cash + Short‐term securities. 6.860% DCF to the Investors 46,571 DCF analysis will deduct the total value of liabilities from the firm's cash position. BIIB: Biogen Inc. | FEIN 33-0112644: Monte Carlo: Valuation Per Share | $USD 260.426 PER SHARE Beharry, Lyndon Martin W. 2022‐07‐15_BIIB_MC‐Equity‐Trials|DCF All Variable_MC 07/15/2022 17:25 Page 10A of 17
- 12. Equity Valuation 2022‐07‐15_BIIB_MC‐Equity‐Trials Financial Statement Review Type alternative annual growth rates here: BIIB: Biogen Inc. | FEIN 33‐0112644: Monte Carlo: Valuation Per Share | $USD Mask Monetary Values In 1,000,000 $USD (Except Per Share Values). 1,000,000 $USD Revenue Growth Rate2022 Revenue Growth Rate2023 Revenue Growth Rate2024 Revenue Growth Rate2025 Revenue Growth Rate2026 Revenue Growth Rate2027 Revenue Growth Rate2028 Revenue Growth Rate2029 Revenue Growth Rate2030 Revenue Growth Rate2031 Revenue Growth Rate2032 Projection Base [FY] Year T0 2022 2022 2022 2023 2024 2025 2026 2027 2028 2029 2030 2031 2032 Mean STDEV 0 1 2 3 4 5 6 7 8 9 10 Revenue Growth Rate 2022 00.0% Revenue Growth Rate 2023 00.0% Revenue Growth Rate 2024 00.0% Revenue Growth Rate 2025 00.0% Revenue Growth Rate 2026 00.0% Revenue Growth Rate 2027 00.0% Revenue Growth Rate 2028 00.0% Revenue Growth Rate 2029 00.0% Revenue Growth Rate 2030 00.0% Revenue Growth Rate 2031 00.0% Revenue Growth Rate 2032 00.0% 0.000% 0.000% Random Growth Rate 0.00% 0.00% 0.00% 0.00% 0.00% 0.00% 0.00% 0.00% 0.00% 0.00% 0.00% Sequential Reduction 0.000% Alternate Coefficient of Variability 10.00% 0.00% 0.00% 0.00% 0.00% 0.00% 0.00% 0.00% 0.00% 0.00% 0.00% 0.00% Timet0 Timet+1 Timet+2 Timet+3 Timet+4 Timet+5 Timet+6 Timet+7 Timet+8 Timet+9 Timet+10 Timet+11 Projection TimeT1 14,378 MONTE CARLO REVENUE 14,378 14,378 14,378 14,378 14,378 14,378 14,378 14,378 14,378 14,378 14,378 CoGS : f(Revenue)2022 CoGS : f(Revenue)2023 CoGS : f(Revenue)2024 CoGS : f(Revenue)2025 CoGS : f(Revenue)2026 CoGS : f(Revenue)2027 CoGS : f(Revenue)2028 CoGS : f(Revenue)2029 CoGS : f(Revenue)2030 CoGS : f(Revenue)2031 CoGS : f(Revenue)2032 7.250% 0.725% 6.439% 6.508% 7.060% 6.048% 7.678% 8.192% 7.851% 8.242% 6.146% 7.558% 7.629% CoGS: 7.21% ‐926 ‐936 ‐1,015 ‐870 ‐1,104 ‐1,178 ‐1,129 ‐1,185 ‐884 ‐1,087 ‐1,097 Depreciation/Amortization [COGs] : f(Revenue)2022 Depreciation/Amortization [COGs] : f(Revenue)2023 Depreciation/Amortization [COGs] : f(Revenue)2024 Depreciation/Amortization [COGs] : f(Revenue)2025 Depreciation/Amortization [COGs] : f(Revenue)2026 Depreciation/Amortization [COGs] : f(Revenue)2027 Depreciation/Amortization [COGs] : f(Revenue)2028 Depreciation/Amortization [COGs] : f(Revenue)2029 Depreciation/Amortization [COGs] : f(Revenue)2030 Depreciation/Amortization [COGs] : f(Revenue)2031 Depreciation/Amortization [COGs] : f(Revenue)2032 5.640% 0.564% 5.824% 5.342% 4.736% 5.186% 5.231% 4.773% 4.644% 5.579% 5.390% 5.293% 4.743% D&A (Production): 5.16% ‐837 ‐768 ‐681 ‐746 ‐752 ‐686 ‐668 ‐802 ‐775 ‐761 ‐682 GROSS MARGIN: 87.63% 12,615 12,674 12,682 12,763 12,522 12,514 12,581 12,391 12,719 12,530 12,599 SGA (Only) : f(Revenue)2022 SGA (Only) : f(Revenue)2023 SGA (Only) : f(Revenue)2024 SGA (Only) : f(Revenue)2025 SGA (Only) : f(Revenue)2026 SGA (Only) : f(Revenue)2027 SGA (Only) : f(Revenue)2028 SGA (Only) : f(Revenue)2029 SGA (Only) : f(Revenue)2030 SGA (Only) : f(Revenue)2031 SGA (Only) : f(Revenue)2032 21.935% 2.194% Administrative Costs: 24.714% 18.403% 25.909% 24.031% 20.383% 20.420% 19.031% 20.256% 21.132% 20.870% 23.683% SGA: 24.71% ‐3,553 ‐3,553 ‐3,553 ‐3,553 ‐3,553 ‐3,553 ‐3,553 ‐3,553 ‐3,553 ‐3,553 ‐3,553 R&D : f(Revenue)2022 R&D : f(Revenue)2023 R&D : f(Revenue)2024 R&D : f(Revenue)2025 R&D : f(Revenue)2026 R&D : f(Revenue)2027 R&D : f(Revenue)2028 R&D : f(Revenue)2029 R&D : f(Revenue)2030 R&D : f(Revenue)2031 R&D : f(Revenue)2032 21.159% 2.116% 22.433% 18.564% 22.340% 20.124% 21.392% 20.752% 22.271% 23.592% 19.588% 21.867% 19.946% R & D: 21.17% ‐3,225 ‐2,669 ‐3,212 ‐2,893 ‐3,076 ‐2,984 ‐3,202 ‐3,392 ‐2,816 ‐3,144 ‐2,868 Depreciation/Amortization [SGA] : f(Revenue)2022 Depreciation/Amortization [SGA] : f(Revenue)2023 Depreciation/Amortization [SGA] : f(Revenue)2024 Depreciation/Amortization [SGA] : f(Revenue)2025 Depreciation/Amortization [SGA] : f(Revenue)2026 Depreciation/Amortization [SGA] : f(Revenue)2027 Depreciation/Amortization [SGA] : f(Revenue)2028 Depreciation/Amortization [SGA] : f(Revenue)2029 Depreciation/Amortization [SGA] : f(Revenue)2030 Depreciation/Amortization [SGA] : f(Revenue)2031 Depreciation/Amortization [SGA] : f(Revenue)2032 4.802% 0.480% 5.263% 4.349% 4.880% 4.997% 5.384% 4.670% 4.932% 5.938% 3.731% 4.732% 5.335% D & A [SGA]: 4.93% ‐757 ‐625 ‐702 ‐718 ‐774 ‐671 ‐709 ‐854 ‐536 ‐680 ‐767 Admin Expenses: 50.81% ‐7,535 ‐6,848 ‐7,467 ‐7,165 ‐7,403 ‐7,209 ‐7,464 ‐7,799 ‐6,906 ‐7,378 ‐7,188 Other Expense (Income) : f(Revenue)2022 Other Expense (Income) : f(Revenue)2023 Other Expense (Income) : f(Revenue)2024 Other Expense (Income) : f(Revenue)2025 Other Expense (Income) : f(Revenue)2026 Other Expense (Income) : f(Revenue)2027 Other Expense (Income) : f(Revenue)2028 Other Expense (Income) : f(Revenue)2029 Other Expense (Income) : f(Revenue)2030 Other Expense (Income) : f(Revenue)2031 Other Expense (Income) : f(Revenue)2032 -0.287% 0.029% ‐0.315% ‐0.293% ‐0.262% ‐0.220% ‐0.280% ‐0.206% ‐0.275% ‐0.289% ‐0.325% ‐0.230% ‐0.248% Other: ‐0.27% 45 42 38 32 40 30 39 42 47 33 36 EBIT: 37.08% 5,125 5,869 5,253 5,629 5,159 5,335 5,156 4,633 5,860 5,185 5,447 Interest Expense (Income) : f(Revenue)2022 Interest Expense (Income) : f(Revenue)2023 Interest Expense (Income) : f(Revenue)2024 Interest Expense (Income) : f(Revenue)2025 Interest Expense (Income) : f(Revenue)2026 Interest Expense (Income) : f(Revenue)2027 Interest Expense (Income) : f(Revenue)2028 Interest Expense (Income) : f(Revenue)2029 Interest Expense (Income) : f(Revenue)2030 Interest Expense (Income) : f(Revenue)2031 Interest Expense (Income) : f(Revenue)2032 1.250% 0.125% 1.196% 1.508% 1.276% 1.457% 1.399% 1.341% 1.325% 1.027% 1.367% 1.227% 1.359% Interest Expense: 1.32% ‐172 ‐217 ‐184 ‐209 ‐201 ‐193 ‐190 ‐148 ‐196 ‐176 ‐195 EBT: 35.77% 4,953 5,652 5,069 5,420 4,958 5,142 4,966 4,486 5,664 5,009 5,251 Tax Rate : f(EBT)2022 Tax Rate : f(EBT)2023 Tax Rate : f(EBT)2024 Tax Rate : f(EBT)2025 Tax Rate : f(EBT)2026 Tax Rate : f(EBT)2027 Tax Rate : f(EBT)2028 Tax Rate : f(EBT)2029 Tax Rate : f(EBT)2030 Tax Rate : f(EBT)2031 Tax Rate : f(EBT)2032 21.000% 2.100% 22.568% 19.908% 19.870% 20.728% 22.153% 23.110% 20.514% 19.708% 21.261% 19.059% 20.855% Taxes: 20.89% ‐1,118 ‐1,125 ‐1,007 ‐1,123 ‐1,098 ‐1,188 ‐1,019 ‐884 ‐1,204 ‐955 ‐1,095 Tax Payable Tax Payable Tax Payable Tax Payable Tax Payable Tax Payable Tax Payable Tax Payable Tax Payable Tax Payable Tax Payable NET EARNINGS: 28.30% 3,835 4,527 4,062 4,296 3,859 3,954 3,947 3,602 4,459 4,054 4,156 D&A Add‐Back: 10.09% 1,594 1,393 1,383 1,464 1,526 1,358 1,377 1,656 1,311 1,441 1,449 Capital Expenditures : f(Revenue)2022 Capital Expenditures : f(Revenue)2023 Capital Expenditures : f(Revenue)2024 Capital Expenditures : f(Revenue)2025 Capital Expenditures : f(Revenue)2026 Capital Expenditures : f(Revenue)2027 Capital Expenditures : f(Revenue)2028 Capital Expenditures : f(Revenue)2029 Capital Expenditures : f(Revenue)2030 Capital Expenditures : f(Revenue)2031 Capital Expenditures : f(Revenue)2032 11.602% 1.160% 9.067% 13.234% 12.219% 10.846% 12.904% 13.698% 10.797% 11.633% 11.550% 9.030% 13.550% CAP EX: 11.68% ‐1,304 ‐1,903 ‐1,757 ‐1,559 ‐1,855 ‐1,969 ‐1,552 ‐1,673 ‐1,661 ‐1,298 ‐1,948 Δ Working Capital : f(Revenue)2022 Δ Working Capital : f(Revenue)2023 Δ Working Capital : f(Revenue)2024 Δ Working Capital : f(Revenue)2025 Δ Working Capital : f(Revenue)2026 Δ Working Capital : f(Revenue)2027 Δ Working Capital : f(Revenue)2028 Δ Working Capital : f(Revenue)2029 Δ Working Capital : f(Revenue)2030 Δ Working Capital : f(Revenue)2031 Δ Working Capital : f(Revenue)2032 -5.000% 0.500% ‐4.840% ‐4.880% ‐5.493% ‐5.209% ‐5.048% ‐4.944% ‐4.794% ‐5.279% ‐4.724% ‐4.998% ‐4.311% Δ WRK CAP: ‐4.96% ‐696 ‐702 ‐790 ‐749 ‐726 ‐711 ‐689 ‐759 ‐679 ‐719 ‐620 Equity Minority Interest : f(Revenue)2022 Equity Minority Interest : f(Revenue)2023 Equity Minority Interest : f(Revenue)2024 Equity Minority Interest : f(Revenue)2025 Equity Minority Interest : f(Revenue)2026 Equity Minority Interest : f(Revenue)2027 Equity Minority Interest : f(Revenue)2028 Equity Minority Interest : f(Revenue)2029 Equity Minority Interest : f(Revenue)2030 Equity Minority Interest : f(Revenue)2031 Equity Minority Interest : f(Revenue)2032 -0.135% 0.013% ‐0.117% ‐0.136% ‐0.126% ‐0.145% ‐0.130% ‐0.146% ‐0.148% ‐0.118% ‐0.132% ‐0.137% ‐0.135% EARN AFFL: ‐0.13% ‐17 ‐20 ‐18 ‐21 ‐19 ‐21 ‐21 ‐17 ‐19 ‐20 ‐19 ‐14,304 LESS CURRENT DEBT AND OTHER LONG-TERM LIABILITIES T₀ (Adjusted for Carrying Costs ) 0 LESS PREFERRED AT PAR T₀ 4,476 EXCESS CASH & SHORT-TERM SECURITIES T₀ GROWTH 2.500% DCF analysis will deduct the total value of liabilities from the firm's cash position. PERPETUITY VALUE FCF to Equity 3,413 3,296 2,880 3,431 2,786 2,610 3,061 2,809 3,412 3,459 3,018 70,948 WACC FOR SIMULATION 6.860% 0.137% To assess liquidity at T₀, DCF analysis will deduct Balance Sheet Liabilities from Cash + Short‐term securities. 6.903% DCF to the Investors 45,484 DCF analysis will deduct the total value of liabilities from the firm's cash position. BIIB: Biogen Inc. | FEIN 33-0112644: Monte Carlo: Valuation Per Share | $USD 254.347 PER SHARE Beharry, Lyndon Martin W. 2022‐07‐15_BIIB_MC‐Equity‐Trials|DCF All Variable_MC 07/15/2022 17:25 Page 10B of 17
- 13. Equity Valuation 2022‐07‐15_BIIB_MC‐Equity‐Trials Financial Statement Review Type alternative annual growth rates here: BIIB: Biogen Inc. | FEIN 33‐0112644: Monte Carlo: Valuation Per Share | $USD Mask Monetary Values In 1,000,000 $USD (Except Per Share Values). 1,000,000 $USD Revenue Growth Rate2022 Revenue Growth Rate2023 Revenue Growth Rate2024 Revenue Growth Rate2025 Revenue Growth Rate2026 Revenue Growth Rate2027 Revenue Growth Rate2028 Revenue Growth Rate2029 Revenue Growth Rate2030 Revenue Growth Rate2031 Revenue Growth Rate2032 Projection Base [FY] Year T0 2022 2022 2022 2023 2024 2025 2026 2027 2028 2029 2030 2031 2032 Mean STDEV 0 1 2 3 4 5 6 7 8 9 10 Revenue Growth Rate 2022 00.0% Revenue Growth Rate 2023 00.0% Revenue Growth Rate 2024 00.0% Revenue Growth Rate 2025 00.0% Revenue Growth Rate 2026 00.0% Revenue Growth Rate 2027 00.0% Revenue Growth Rate 2028 00.0% Revenue Growth Rate 2029 00.0% Revenue Growth Rate 2030 00.0% Revenue Growth Rate 2031 00.0% Revenue Growth Rate 2032 00.0% 0.000% 0.000% Random Growth Rate 0.00% 0.00% 0.00% 0.00% 0.00% 0.00% 0.00% 0.00% 0.00% 0.00% 0.00% Sequential Reduction 0.000% Alternate Coefficient of Variability 10.00% 0.00% 0.00% 0.00% 0.00% 0.00% 0.00% 0.00% 0.00% 0.00% 0.00% 0.00% Timet0 Timet+1 Timet+2 Timet+3 Timet+4 Timet+5 Timet+6 Timet+7 Timet+8 Timet+9 Timet+10 Timet+11 Projection TimeT1 14,378 MONTE CARLO REVENUE 14,378 14,378 14,378 14,378 14,378 14,378 14,378 14,378 14,378 14,378 14,378 CoGS : f(Revenue)2022 CoGS : f(Revenue)2023 CoGS : f(Revenue)2024 CoGS : f(Revenue)2025 CoGS : f(Revenue)2026 CoGS : f(Revenue)2027 CoGS : f(Revenue)2028 CoGS : f(Revenue)2029 CoGS : f(Revenue)2030 CoGS : f(Revenue)2031 CoGS : f(Revenue)2032 7.250% 0.725% 7.828% 7.789% 7.346% 6.853% 6.310% 7.552% 6.016% 7.177% 7.710% 7.533% 7.482% CoGS: 7.24% ‐1,126 ‐1,120 ‐1,056 ‐985 ‐907 ‐1,086 ‐865 ‐1,032 ‐1,109 ‐1,083 ‐1,076 Depreciation/Amortization [COGs] : f(Revenue)2022 Depreciation/Amortization [COGs] : f(Revenue)2023 Depreciation/Amortization [COGs] : f(Revenue)2024 Depreciation/Amortization [COGs] : f(Revenue)2025 Depreciation/Amortization [COGs] : f(Revenue)2026 Depreciation/Amortization [COGs] : f(Revenue)2027 Depreciation/Amortization [COGs] : f(Revenue)2028 Depreciation/Amortization [COGs] : f(Revenue)2029 Depreciation/Amortization [COGs] : f(Revenue)2030 Depreciation/Amortization [COGs] : f(Revenue)2031 Depreciation/Amortization [COGs] : f(Revenue)2032 5.640% 0.564% 5.470% 5.422% 4.684% 6.552% 4.992% 5.111% 5.222% 6.087% 5.980% 6.727% 5.100% D&A (Production): 5.58% ‐786 ‐780 ‐673 ‐942 ‐718 ‐735 ‐751 ‐875 ‐860 ‐967 ‐733 GROSS MARGIN: 87.19% 12,466 12,478 12,648 12,451 12,753 12,557 12,762 12,471 12,410 12,328 12,569 SGA (Only) : f(Revenue)2022 SGA (Only) : f(Revenue)2023 SGA (Only) : f(Revenue)2024 SGA (Only) : f(Revenue)2025 SGA (Only) : f(Revenue)2026 SGA (Only) : f(Revenue)2027 SGA (Only) : f(Revenue)2028 SGA (Only) : f(Revenue)2029 SGA (Only) : f(Revenue)2030 SGA (Only) : f(Revenue)2031 SGA (Only) : f(Revenue)2032 21.935% 2.194% Administrative Costs: 20.188% 23.173% 21.782% 19.345% 19.134% 21.339% 24.248% 23.492% 24.430% 22.106% 21.063% SGA: 20.19% ‐2,903 ‐2,903 ‐2,903 ‐2,903 ‐2,903 ‐2,903 ‐2,903 ‐2,903 ‐2,903 ‐2,903 ‐2,903 R&D : f(Revenue)2022 R&D : f(Revenue)2023 R&D : f(Revenue)2024 R&D : f(Revenue)2025 R&D : f(Revenue)2026 R&D : f(Revenue)2027 R&D : f(Revenue)2028 R&D : f(Revenue)2029 R&D : f(Revenue)2030 R&D : f(Revenue)2031 R&D : f(Revenue)2032 21.159% 2.116% 18.391% 17.360% 17.508% 21.257% 25.329% 23.263% 21.998% 24.094% 21.382% 19.955% 19.739% R & D: 20.93% ‐2,644 ‐2,496 ‐2,517 ‐3,056 ‐3,642 ‐3,345 ‐3,163 ‐3,464 ‐3,074 ‐2,869 ‐2,838 Depreciation/Amortization [SGA] : f(Revenue)2022 Depreciation/Amortization [SGA] : f(Revenue)2023 Depreciation/Amortization [SGA] : f(Revenue)2024 Depreciation/Amortization [SGA] : f(Revenue)2025 Depreciation/Amortization [SGA] : f(Revenue)2026 Depreciation/Amortization [SGA] : f(Revenue)2027 Depreciation/Amortization [SGA] : f(Revenue)2028 Depreciation/Amortization [SGA] : f(Revenue)2029 Depreciation/Amortization [SGA] : f(Revenue)2030 Depreciation/Amortization [SGA] : f(Revenue)2031 Depreciation/Amortization [SGA] : f(Revenue)2032 4.802% 0.480% 5.609% 5.757% 5.871% 5.829% 5.329% 4.855% 4.969% 4.081% 5.075% 4.940% 5.569% D & A [SGA]: 5.26% ‐807 ‐828 ‐844 ‐838 ‐766 ‐698 ‐714 ‐587 ‐730 ‐710 ‐801 Admin Expenses: 46.38% ‐6,353 ‐6,226 ‐6,264 ‐6,797 ‐7,311 ‐6,945 ‐6,780 ‐6,954 ‐6,706 ‐6,482 ‐6,541 Other Expense (Income) : f(Revenue)2022 Other Expense (Income) : f(Revenue)2023 Other Expense (Income) : f(Revenue)2024 Other Expense (Income) : f(Revenue)2025 Other Expense (Income) : f(Revenue)2026 Other Expense (Income) : f(Revenue)2027 Other Expense (Income) : f(Revenue)2028 Other Expense (Income) : f(Revenue)2029 Other Expense (Income) : f(Revenue)2030 Other Expense (Income) : f(Revenue)2031 Other Expense (Income) : f(Revenue)2032 -0.287% 0.029% ‐0.273% ‐0.268% ‐0.248% ‐0.296% ‐0.283% ‐0.264% ‐0.294% ‐0.289% ‐0.282% ‐0.317% ‐0.282% Other: ‐0.28% 39 39 36 43 41 38 42 42 41 46 41 EBIT: 41.08% 6,152 6,291 6,420 5,696 5,483 5,650 6,025 5,559 5,744 5,891 6,068 Interest Expense (Income) : f(Revenue)2022 Interest Expense (Income) : f(Revenue)2023 Interest Expense (Income) : f(Revenue)2024 Interest Expense (Income) : f(Revenue)2025 Interest Expense (Income) : f(Revenue)2026 Interest Expense (Income) : f(Revenue)2027 Interest Expense (Income) : f(Revenue)2028 Interest Expense (Income) : f(Revenue)2029 Interest Expense (Income) : f(Revenue)2030 Interest Expense (Income) : f(Revenue)2031 Interest Expense (Income) : f(Revenue)2032 1.250% 0.125% 1.040% 1.284% 1.271% 1.027% 1.187% 1.419% 1.351% 1.224% 1.192% 1.320% 1.226% Interest Expense: 1.23% ‐149 ‐185 ‐183 ‐148 ‐171 ‐204 ‐194 ‐176 ‐171 ‐190 ‐176 EBT: 39.85% 6,002 6,106 6,237 5,549 5,312 5,446 5,830 5,383 5,572 5,701 5,892 Tax Rate : f(EBT)2022 Tax Rate : f(EBT)2023 Tax Rate : f(EBT)2024 Tax Rate : f(EBT)2025 Tax Rate : f(EBT)2026 Tax Rate : f(EBT)2027 Tax Rate : f(EBT)2028 Tax Rate : f(EBT)2029 Tax Rate : f(EBT)2030 Tax Rate : f(EBT)2031 Tax Rate : f(EBT)2032 21.000% 2.100% 23.043% 19.649% 18.219% 20.247% 21.534% 18.021% 24.329% 21.783% 19.194% 21.620% 19.607% Taxes: 20.65% ‐1,383 ‐1,200 ‐1,136 ‐1,123 ‐1,144 ‐981 ‐1,418 ‐1,173 ‐1,070 ‐1,233 ‐1,155 Tax Payable Tax Payable Tax Payable Tax Payable Tax Payable Tax Payable Tax Payable Tax Payable Tax Payable Tax Payable Tax Payable NET EARNINGS: 31.62% 4,619 4,906 5,101 4,425 4,168 4,465 4,412 4,210 4,503 4,469 4,737 D&A Add‐Back: 10.84% 1,593 1,607 1,518 1,780 1,484 1,433 1,465 1,462 1,589 1,677 1,534 Capital Expenditures : f(Revenue)2022 Capital Expenditures : f(Revenue)2023 Capital Expenditures : f(Revenue)2024 Capital Expenditures : f(Revenue)2025 Capital Expenditures : f(Revenue)2026 Capital Expenditures : f(Revenue)2027 Capital Expenditures : f(Revenue)2028 Capital Expenditures : f(Revenue)2029 Capital Expenditures : f(Revenue)2030 Capital Expenditures : f(Revenue)2031 Capital Expenditures : f(Revenue)2032 11.602% 1.160% 11.320% 11.120% 11.166% 10.768% 12.092% 8.617% 12.336% 9.078% 13.044% 11.939% 12.616% CAP EX: 11.28% ‐1,628 ‐1,599 ‐1,605 ‐1,548 ‐1,739 ‐1,239 ‐1,774 ‐1,305 ‐1,875 ‐1,717 ‐1,814 Δ Working Capital : f(Revenue)2022 Δ Working Capital : f(Revenue)2023 Δ Working Capital : f(Revenue)2024 Δ Working Capital : f(Revenue)2025 Δ Working Capital : f(Revenue)2026 Δ Working Capital : f(Revenue)2027 Δ Working Capital : f(Revenue)2028 Δ Working Capital : f(Revenue)2029 Δ Working Capital : f(Revenue)2030 Δ Working Capital : f(Revenue)2031 Δ Working Capital : f(Revenue)2032 -5.000% 0.500% ‐5.215% ‐5.465% ‐5.771% ‐5.945% ‐4.598% ‐5.445% ‐5.895% ‐5.600% ‐5.995% ‐5.136% ‐5.383% Δ WRK CAP: ‐5.50% ‐750 ‐786 ‐830 ‐855 ‐661 ‐783 ‐848 ‐805 ‐862 ‐738 ‐774 Equity Minority Interest : f(Revenue)2022 Equity Minority Interest : f(Revenue)2023 Equity Minority Interest : f(Revenue)2024 Equity Minority Interest : f(Revenue)2025 Equity Minority Interest : f(Revenue)2026 Equity Minority Interest : f(Revenue)2027 Equity Minority Interest : f(Revenue)2028 Equity Minority Interest : f(Revenue)2029 Equity Minority Interest : f(Revenue)2030 Equity Minority Interest : f(Revenue)2031 Equity Minority Interest : f(Revenue)2032 -0.135% 0.013% ‐0.125% ‐0.138% ‐0.147% ‐0.153% ‐0.143% ‐0.158% ‐0.139% ‐0.137% ‐0.150% ‐0.101% ‐0.128% EARN AFFL: ‐0.14% ‐18 ‐20 ‐21 ‐22 ‐21 ‐23 ‐20 ‐20 ‐22 ‐14 ‐18 ‐14,304 LESS CURRENT DEBT AND OTHER LONG-TERM LIABILITIES T₀ (Adjusted for Carrying Costs ) 0 LESS PREFERRED AT PAR T₀ 4,476 EXCESS CASH & SHORT-TERM SECURITIES T₀ GROWTH 2.500% DCF analysis will deduct the total value of liabilities from the firm's cash position. PERPETUITY VALUE FCF to Equity 3,817 4,109 4,162 3,780 3,232 3,853 3,236 3,542 3,333 3,677 3,664 86,154 WACC FOR SIMULATION 6.860% 0.137% To assess liquidity at T₀, DCF analysis will deduct Balance Sheet Liabilities from Cash + Short‐term securities. 6.752% DCF to the Investors 57,654 DCF analysis will deduct the total value of liabilities from the firm's cash position. BIIB: Biogen Inc. | FEIN 33-0112644: Monte Carlo: Valuation Per Share | $USD 322.405 PER SHARE Beharry, Lyndon Martin W. 2022‐07‐15_BIIB_MC‐Equity‐Trials|DCF All Variable_MC 07/15/2022 17:25 Page 10C of 17
- 14. Equity Valuation 2022‐07‐15_BIIB_MC‐Equity‐Trials Financial Statement Review Type alternative annual growth rates here: BIIB: Biogen Inc. | FEIN 33‐0112644: Monte Carlo: Valuation Per Share | $USD Mask Monetary Values In 1,000,000 $USD (Except Per Share Values). 1,000,000 $USD Revenue Growth Rate2022 Revenue Growth Rate2023 Revenue Growth Rate2024 Revenue Growth Rate2025 Revenue Growth Rate2026 Revenue Growth Rate2027 Revenue Growth Rate2028 Revenue Growth Rate2029 Revenue Growth Rate2030 Revenue Growth Rate2031 Revenue Growth Rate2032 Projection Base [FY] Year T0 2022 2022 2022 2023 2024 2025 2026 2027 2028 2029 2030 2031 2032 Mean STDEV 0 1 2 3 4 5 6 7 8 9 10 Revenue Growth Rate 2022 00.0% Revenue Growth Rate 2023 00.0% Revenue Growth Rate 2024 00.0% Revenue Growth Rate 2025 00.0% Revenue Growth Rate 2026 00.0% Revenue Growth Rate 2027 00.0% Revenue Growth Rate 2028 00.0% Revenue Growth Rate 2029 00.0% Revenue Growth Rate 2030 00.0% Revenue Growth Rate 2031 00.0% Revenue Growth Rate 2032 00.0% 0.000% 0.000% Random Growth Rate 0.00% 0.00% 0.00% 0.00% 0.00% 0.00% 0.00% 0.00% 0.00% 0.00% 0.00% Sequential Reduction 0.000% Alternate Coefficient of Variability 10.00% 0.00% 0.00% 0.00% 0.00% 0.00% 0.00% 0.00% 0.00% 0.00% 0.00% 0.00% Timet0 Timet+1 Timet+2 Timet+3 Timet+4 Timet+5 Timet+6 Timet+7 Timet+8 Timet+9 Timet+10 Timet+11 Projection TimeT1 14,378 MONTE CARLO REVENUE 14,378 14,378 14,378 14,378 14,378 14,378 14,378 14,378 14,378 14,378 14,378 CoGS : f(Revenue)2022 CoGS : f(Revenue)2023 CoGS : f(Revenue)2024 CoGS : f(Revenue)2025 CoGS : f(Revenue)2026 CoGS : f(Revenue)2027 CoGS : f(Revenue)2028 CoGS : f(Revenue)2029 CoGS : f(Revenue)2030 CoGS : f(Revenue)2031 CoGS : f(Revenue)2032 7.250% 0.725% 7.741% 6.692% 6.954% 6.621% 7.536% 7.614% 7.388% 7.241% 6.414% 7.910% 7.721% CoGS: 7.26% ‐1,113 ‐962 ‐1,000 ‐952 ‐1,084 ‐1,095 ‐1,062 ‐1,041 ‐922 ‐1,137 ‐1,110 Depreciation/Amortization [COGs] : f(Revenue)2022 Depreciation/Amortization [COGs] : f(Revenue)2023 Depreciation/Amortization [COGs] : f(Revenue)2024 Depreciation/Amortization [COGs] : f(Revenue)2025 Depreciation/Amortization [COGs] : f(Revenue)2026 Depreciation/Amortization [COGs] : f(Revenue)2027 Depreciation/Amortization [COGs] : f(Revenue)2028 Depreciation/Amortization [COGs] : f(Revenue)2029 Depreciation/Amortization [COGs] : f(Revenue)2030 Depreciation/Amortization [COGs] : f(Revenue)2031 Depreciation/Amortization [COGs] : f(Revenue)2032 5.640% 0.564% 6.222% 4.775% 5.156% 5.679% 4.497% 5.592% 5.032% 5.059% 6.832% 5.986% 6.260% D&A (Production): 5.55% ‐895 ‐687 ‐741 ‐817 ‐647 ‐804 ‐723 ‐727 ‐982 ‐861 ‐900 GROSS MARGIN: 87.19% 12,370 12,729 12,637 12,609 12,648 12,479 12,592 12,609 12,473 12,380 12,368 SGA (Only) : f(Revenue)2022 SGA (Only) : f(Revenue)2023 SGA (Only) : f(Revenue)2024 SGA (Only) : f(Revenue)2025 SGA (Only) : f(Revenue)2026 SGA (Only) : f(Revenue)2027 SGA (Only) : f(Revenue)2028 SGA (Only) : f(Revenue)2029 SGA (Only) : f(Revenue)2030 SGA (Only) : f(Revenue)2031 SGA (Only) : f(Revenue)2032 21.935% 2.194% Administrative Costs: 20.224% 22.408% 16.891% 26.578% 26.035% 23.058% 16.763% 21.347% 20.494% 21.703% 21.071% SGA: 20.22% ‐2,908 ‐2,908 ‐2,908 ‐2,908 ‐2,908 ‐2,908 ‐2,908 ‐2,908 ‐2,908 ‐2,908 ‐2,908 R&D : f(Revenue)2022 R&D : f(Revenue)2023 R&D : f(Revenue)2024 R&D : f(Revenue)2025 R&D : f(Revenue)2026 R&D : f(Revenue)2027 R&D : f(Revenue)2028 R&D : f(Revenue)2029 R&D : f(Revenue)2030 R&D : f(Revenue)2031 R&D : f(Revenue)2032 21.159% 2.116% 24.371% 20.972% 20.480% 19.910% 17.530% 21.749% 21.760% 22.255% 18.963% 22.593% 19.492% R & D: 20.92% ‐3,504 ‐3,015 ‐2,945 ‐2,863 ‐2,520 ‐3,127 ‐3,129 ‐3,200 ‐2,726 ‐3,248 ‐2,802 Depreciation/Amortization [SGA] : f(Revenue)2022 Depreciation/Amortization [SGA] : f(Revenue)2023 Depreciation/Amortization [SGA] : f(Revenue)2024 Depreciation/Amortization [SGA] : f(Revenue)2025 Depreciation/Amortization [SGA] : f(Revenue)2026 Depreciation/Amortization [SGA] : f(Revenue)2027 Depreciation/Amortization [SGA] : f(Revenue)2028 Depreciation/Amortization [SGA] : f(Revenue)2029 Depreciation/Amortization [SGA] : f(Revenue)2030 Depreciation/Amortization [SGA] : f(Revenue)2031 Depreciation/Amortization [SGA] : f(Revenue)2032 4.802% 0.480% 5.206% 3.718% 4.462% 5.039% 4.482% 4.375% 4.689% 4.266% 4.596% 5.065% 4.488% D & A [SGA]: 4.58% ‐749 ‐535 ‐642 ‐724 ‐644 ‐629 ‐674 ‐613 ‐661 ‐728 ‐645 Admin Expenses: 45.72% ‐7,160 ‐6,458 ‐6,494 ‐6,495 ‐6,073 ‐6,664 ‐6,711 ‐6,721 ‐6,295 ‐6,885 ‐6,356 Other Expense (Income) : f(Revenue)2022 Other Expense (Income) : f(Revenue)2023 Other Expense (Income) : f(Revenue)2024 Other Expense (Income) : f(Revenue)2025 Other Expense (Income) : f(Revenue)2026 Other Expense (Income) : f(Revenue)2027 Other Expense (Income) : f(Revenue)2028 Other Expense (Income) : f(Revenue)2029 Other Expense (Income) : f(Revenue)2030 Other Expense (Income) : f(Revenue)2031 Other Expense (Income) : f(Revenue)2032 -0.287% 0.029% ‐0.233% ‐0.293% ‐0.320% ‐0.284% ‐0.257% ‐0.257% ‐0.315% ‐0.294% ‐0.261% ‐0.281% ‐0.351% Other: ‐0.29% 33 42 46 41 37 37 45 42 38 40 51 EBIT: 41.75% 5,243 6,314 6,189 6,155 6,612 5,852 5,927 5,931 6,216 5,536 6,063 Interest Expense (Income) : f(Revenue)2022 Interest Expense (Income) : f(Revenue)2023 Interest Expense (Income) : f(Revenue)2024 Interest Expense (Income) : f(Revenue)2025 Interest Expense (Income) : f(Revenue)2026 Interest Expense (Income) : f(Revenue)2027 Interest Expense (Income) : f(Revenue)2028 Interest Expense (Income) : f(Revenue)2029 Interest Expense (Income) : f(Revenue)2030 Interest Expense (Income) : f(Revenue)2031 Interest Expense (Income) : f(Revenue)2032 1.250% 0.125% 1.306% 1.197% 1.324% 1.263% 1.264% 0.970% 1.247% 1.400% 1.291% 1.194% 1.055% Interest Expense: 1.23% ‐188 ‐172 ‐190 ‐182 ‐182 ‐139 ‐179 ‐201 ‐186 ‐172 ‐152 EBT: 40.53% 5,056 6,142 5,999 5,974 6,430 5,713 5,748 5,729 6,030 5,364 5,911 Tax Rate : f(EBT)2022 Tax Rate : f(EBT)2023 Tax Rate : f(EBT)2024 Tax Rate : f(EBT)2025 Tax Rate : f(EBT)2026 Tax Rate : f(EBT)2027 Tax Rate : f(EBT)2028 Tax Rate : f(EBT)2029 Tax Rate : f(EBT)2030 Tax Rate : f(EBT)2031 Tax Rate : f(EBT)2032 21.000% 2.100% 22.127% 23.685% 23.604% 24.053% 18.547% 22.341% 22.363% 21.853% 20.351% 21.445% 20.150% Taxes: 21.84% ‐1,119 ‐1,455 ‐1,416 ‐1,437 ‐1,193 ‐1,276 ‐1,285 ‐1,252 ‐1,227 ‐1,150 ‐1,191 Tax Payable Tax Payable Tax Payable Tax Payable Tax Payable Tax Payable Tax Payable Tax Payable Tax Payable Tax Payable Tax Payable NET EARNINGS: 31.67% 3,937 4,687 4,583 4,537 5,238 4,436 4,462 4,477 4,803 4,214 4,720 D&A Add‐Back: 10.13% 1,643 1,221 1,383 1,541 1,291 1,433 1,398 1,341 1,643 1,589 1,545 Capital Expenditures : f(Revenue)2022 Capital Expenditures : f(Revenue)2023 Capital Expenditures : f(Revenue)2024 Capital Expenditures : f(Revenue)2025 Capital Expenditures : f(Revenue)2026 Capital Expenditures : f(Revenue)2027 Capital Expenditures : f(Revenue)2028 Capital Expenditures : f(Revenue)2029 Capital Expenditures : f(Revenue)2030 Capital Expenditures : f(Revenue)2031 Capital Expenditures : f(Revenue)2032 11.602% 1.160% 12.217% 11.767% 11.179% 12.274% 11.018% 11.890% 12.050% 11.561% 12.381% 11.148% 11.575% CAP EX: 11.73% ‐1,757 ‐1,692 ‐1,607 ‐1,765 ‐1,584 ‐1,710 ‐1,732 ‐1,662 ‐1,780 ‐1,603 ‐1,664 Δ Working Capital : f(Revenue)2022 Δ Working Capital : f(Revenue)2023 Δ Working Capital : f(Revenue)2024 Δ Working Capital : f(Revenue)2025 Δ Working Capital : f(Revenue)2026 Δ Working Capital : f(Revenue)2027 Δ Working Capital : f(Revenue)2028 Δ Working Capital : f(Revenue)2029 Δ Working Capital : f(Revenue)2030 Δ Working Capital : f(Revenue)2031 Δ Working Capital : f(Revenue)2032 -5.000% 0.500% ‐5.298% ‐5.425% ‐6.014% ‐4.792% ‐5.358% ‐6.386% ‐5.099% ‐5.271% ‐5.202% ‐4.831% ‐5.411% Δ WRK CAP: ‐5.37% ‐762 ‐780 ‐865 ‐689 ‐770 ‐918 ‐733 ‐758 ‐748 ‐695 ‐778 Equity Minority Interest : f(Revenue)2022 Equity Minority Interest : f(Revenue)2023 Equity Minority Interest : f(Revenue)2024 Equity Minority Interest : f(Revenue)2025 Equity Minority Interest : f(Revenue)2026 Equity Minority Interest : f(Revenue)2027 Equity Minority Interest : f(Revenue)2028 Equity Minority Interest : f(Revenue)2029 Equity Minority Interest : f(Revenue)2030 Equity Minority Interest : f(Revenue)2031 Equity Minority Interest : f(Revenue)2032 -0.135% 0.013% ‐0.108% ‐0.133% ‐0.123% ‐0.130% ‐0.109% ‐0.118% ‐0.152% ‐0.125% ‐0.140% ‐0.149% ‐0.138% EARN AFFL: ‐0.13% ‐16 ‐19 ‐18 ‐19 ‐16 ‐17 ‐22 ‐18 ‐20 ‐21 ‐20 ‐14,304 LESS CURRENT DEBT AND OTHER LONG-TERM LIABILITIES T₀ (Adjusted for Carrying Costs ) 0 LESS PREFERRED AT PAR T₀ 4,476 EXCESS CASH & SHORT-TERM SECURITIES T₀ GROWTH 2.500% DCF analysis will deduct the total value of liabilities from the firm's cash position. PERPETUITY VALUE FCF to Equity 3,046 3,417 3,476 3,605 4,158 3,225 3,372 3,380 3,898 3,484 3,803 89,421 WACC FOR SIMULATION 6.860% 0.137% To assess liquidity at T₀, DCF analysis will deduct Balance Sheet Liabilities from Cash + Short‐term securities. 6.811% DCF to the Investors 57,280 DCF analysis will deduct the total value of liabilities from the firm's cash position. BIIB: Biogen Inc. | FEIN 33-0112644: Monte Carlo: Valuation Per Share | $USD 320.313 PER SHARE Beharry, Lyndon Martin W. 2022‐07‐15_BIIB_MC‐Equity‐Trials|DCF All Variable_MC 07/15/2022 17:26 Page 10D of 17
- 15. Equity Valuation 2022‐07‐15_BIIB_MC‐Equity‐Trials Financial Statement Review Type alternative annual growth rates here: BIIB: Biogen Inc. | FEIN 33‐0112644: Monte Carlo: Valuation Per Share | $USD Mask Monetary Values In 1,000,000 $USD (Except Per Share Values). 1,000,000 $USD Revenue Growth Rate2022 Revenue Growth Rate2023 Revenue Growth Rate2024 Revenue Growth Rate2025 Revenue Growth Rate2026 Revenue Growth Rate2027 Revenue Growth Rate2028 Revenue Growth Rate2029 Revenue Growth Rate2030 Revenue Growth Rate2031 Revenue Growth Rate2032 Projection Base [FY] Year T0 2022 2022 2022 2023 2024 2025 2026 2027 2028 2029 2030 2031 2032 Mean STDEV 0 1 2 3 4 5 6 7 8 9 10 Revenue Growth Rate 2022 00.0% Revenue Growth Rate 2023 00.0% Revenue Growth Rate 2024 00.0% Revenue Growth Rate 2025 00.0% Revenue Growth Rate 2026 00.0% Revenue Growth Rate 2027 00.0% Revenue Growth Rate 2028 00.0% Revenue Growth Rate 2029 00.0% Revenue Growth Rate 2030 00.0% Revenue Growth Rate 2031 00.0% Revenue Growth Rate 2032 00.0% 0.000% 0.000% Random Growth Rate 0.00% 0.00% 0.00% 0.00% 0.00% 0.00% 0.00% 0.00% 0.00% 0.00% 0.00% Sequential Reduction 0.000% Alternate Coefficient of Variability 10.00% 0.00% 0.00% 0.00% 0.00% 0.00% 0.00% 0.00% 0.00% 0.00% 0.00% 0.00% Timet0 Timet+1 Timet+2 Timet+3 Timet+4 Timet+5 Timet+6 Timet+7 Timet+8 Timet+9 Timet+10 Timet+11 Projection TimeT1 14,378 MONTE CARLO REVENUE 14,378 14,378 14,378 14,378 14,378 14,378 14,378 14,378 14,378 14,378 14,378 CoGS : f(Revenue)2022 CoGS : f(Revenue)2023 CoGS : f(Revenue)2024 CoGS : f(Revenue)2025 CoGS : f(Revenue)2026 CoGS : f(Revenue)2027 CoGS : f(Revenue)2028 CoGS : f(Revenue)2029 CoGS : f(Revenue)2030 CoGS : f(Revenue)2031 CoGS : f(Revenue)2032 7.250% 0.725% 8.035% 8.166% 7.613% 7.152% 8.293% 7.469% 6.128% 7.208% 7.592% 6.543% 7.146% CoGS: 7.40% ‐1,155 ‐1,174 ‐1,095 ‐1,028 ‐1,192 ‐1,074 ‐881 ‐1,036 ‐1,092 ‐941 ‐1,027 Depreciation/Amortization [COGs] : f(Revenue)2022 Depreciation/Amortization [COGs] : f(Revenue)2023 Depreciation/Amortization [COGs] : f(Revenue)2024 Depreciation/Amortization [COGs] : f(Revenue)2025 Depreciation/Amortization [COGs] : f(Revenue)2026 Depreciation/Amortization [COGs] : f(Revenue)2027 Depreciation/Amortization [COGs] : f(Revenue)2028 Depreciation/Amortization [COGs] : f(Revenue)2029 Depreciation/Amortization [COGs] : f(Revenue)2030 Depreciation/Amortization [COGs] : f(Revenue)2031 Depreciation/Amortization [COGs] : f(Revenue)2032 5.640% 0.564% 5.431% 6.002% 5.066% 5.704% 5.365% 5.564% 5.012% 6.063% 6.095% 4.214% 5.306% D&A (Production): 5.44% ‐781 ‐863 ‐728 ‐820 ‐771 ‐800 ‐721 ‐872 ‐876 ‐606 ‐763 GROSS MARGIN: 87.17% 12,442 12,341 12,555 12,530 12,414 12,504 12,776 12,470 12,410 12,831 12,588 SGA (Only) : f(Revenue)2022 SGA (Only) : f(Revenue)2023 SGA (Only) : f(Revenue)2024 SGA (Only) : f(Revenue)2025 SGA (Only) : f(Revenue)2026 SGA (Only) : f(Revenue)2027 SGA (Only) : f(Revenue)2028 SGA (Only) : f(Revenue)2029 SGA (Only) : f(Revenue)2030 SGA (Only) : f(Revenue)2031 SGA (Only) : f(Revenue)2032 21.935% 2.194% Administrative Costs: 23.194% 20.006% 22.675% 23.003% 25.718% 20.965% 24.810% 22.038% 25.030% 20.091% 20.492% SGA: 23.19% ‐3,335 ‐3,335 ‐3,335 ‐3,335 ‐3,335 ‐3,335 ‐3,335 ‐3,335 ‐3,335 ‐3,335 ‐3,335 R&D : f(Revenue)2022 R&D : f(Revenue)2023 R&D : f(Revenue)2024 R&D : f(Revenue)2025 R&D : f(Revenue)2026 R&D : f(Revenue)2027 R&D : f(Revenue)2028 R&D : f(Revenue)2029 R&D : f(Revenue)2030 R&D : f(Revenue)2031 R&D : f(Revenue)2032 21.159% 2.116% 21.815% 20.410% 22.593% 23.575% 21.690% 21.443% 24.184% 16.541% 22.886% 22.346% 25.714% R & D: 22.11% ‐3,137 ‐2,935 ‐3,248 ‐3,390 ‐3,119 ‐3,083 ‐3,477 ‐2,378 ‐3,291 ‐3,213 ‐3,697 Depreciation/Amortization [SGA] : f(Revenue)2022 Depreciation/Amortization [SGA] : f(Revenue)2023 Depreciation/Amortization [SGA] : f(Revenue)2024 Depreciation/Amortization [SGA] : f(Revenue)2025 Depreciation/Amortization [SGA] : f(Revenue)2026 Depreciation/Amortization [SGA] : f(Revenue)2027 Depreciation/Amortization [SGA] : f(Revenue)2028 Depreciation/Amortization [SGA] : f(Revenue)2029 Depreciation/Amortization [SGA] : f(Revenue)2030 Depreciation/Amortization [SGA] : f(Revenue)2031 Depreciation/Amortization [SGA] : f(Revenue)2032 4.802% 0.480% 5.009% 4.287% 4.384% 4.109% 4.974% 4.738% 4.967% 4.407% 4.941% 5.017% 4.349% D & A [SGA]: 4.65% ‐720 ‐616 ‐630 ‐591 ‐715 ‐681 ‐714 ‐634 ‐710 ‐721 ‐625 Admin Expenses: 49.96% ‐7,192 ‐6,886 ‐7,214 ‐7,315 ‐7,169 ‐7,099 ‐7,526 ‐6,347 ‐7,336 ‐7,269 ‐7,657 Other Expense (Income) : f(Revenue)2022 Other Expense (Income) : f(Revenue)2023 Other Expense (Income) : f(Revenue)2024 Other Expense (Income) : f(Revenue)2025 Other Expense (Income) : f(Revenue)2026 Other Expense (Income) : f(Revenue)2027 Other Expense (Income) : f(Revenue)2028 Other Expense (Income) : f(Revenue)2029 Other Expense (Income) : f(Revenue)2030 Other Expense (Income) : f(Revenue)2031 Other Expense (Income) : f(Revenue)2032 -0.287% 0.029% ‐0.258% ‐0.254% ‐0.320% ‐0.290% ‐0.265% ‐0.302% ‐0.299% ‐0.324% ‐0.304% ‐0.232% ‐0.289% Other: ‐0.29% 37 36 46 42 38 43 43 47 44 33 42 EBIT: 37.50% 5,287 5,492 5,387 5,256 5,284 5,448 5,293 6,170 5,118 5,595 4,972 Interest Expense (Income) : f(Revenue)2022 Interest Expense (Income) : f(Revenue)2023 Interest Expense (Income) : f(Revenue)2024 Interest Expense (Income) : f(Revenue)2025 Interest Expense (Income) : f(Revenue)2026 Interest Expense (Income) : f(Revenue)2027 Interest Expense (Income) : f(Revenue)2028 Interest Expense (Income) : f(Revenue)2029 Interest Expense (Income) : f(Revenue)2030 Interest Expense (Income) : f(Revenue)2031 Interest Expense (Income) : f(Revenue)2032 1.250% 0.125% 1.095% 1.108% 1.135% 1.382% 1.105% 1.120% 1.462% 1.215% 1.122% 1.395% 1.147% Interest Expense: 1.21% ‐157 ‐159 ‐163 ‐199 ‐159 ‐161 ‐210 ‐175 ‐161 ‐201 ‐165 EBT: 36.29% 5,130 5,332 5,224 5,057 5,125 5,287 5,083 5,995 4,957 5,395 4,807 Tax Rate : f(EBT)2022 Tax Rate : f(EBT)2023 Tax Rate : f(EBT)2024 Tax Rate : f(EBT)2025 Tax Rate : f(EBT)2026 Tax Rate : f(EBT)2027 Tax Rate : f(EBT)2028 Tax Rate : f(EBT)2029 Tax Rate : f(EBT)2030 Tax Rate : f(EBT)2031 Tax Rate : f(EBT)2032 21.000% 2.100% 16.994% 21.404% 21.157% 24.617% 21.341% 19.318% 22.335% 18.354% 18.123% 20.065% 16.969% Taxes: 20.06% ‐872 ‐1,141 ‐1,105 ‐1,245 ‐1,094 ‐1,021 ‐1,135 ‐1,100 ‐898 ‐1,082 ‐816 Tax Payable Tax Payable Tax Payable Tax Payable Tax Payable Tax Payable Tax Payable Tax Payable Tax Payable Tax Payable Tax Payable NET EARNINGS: 29.01% 4,258 4,191 4,119 3,812 4,031 4,266 3,947 4,895 4,058 4,312 3,991 D&A Add‐Back: 10.09% 1,501 1,479 1,359 1,411 1,486 1,481 1,435 1,505 1,587 1,327 1,388 Capital Expenditures : f(Revenue)2022 Capital Expenditures : f(Revenue)2023 Capital Expenditures : f(Revenue)2024 Capital Expenditures : f(Revenue)2025 Capital Expenditures : f(Revenue)2026 Capital Expenditures : f(Revenue)2027 Capital Expenditures : f(Revenue)2028 Capital Expenditures : f(Revenue)2029 Capital Expenditures : f(Revenue)2030 Capital Expenditures : f(Revenue)2031 Capital Expenditures : f(Revenue)2032 11.602% 1.160% 12.384% 10.192% 11.300% 10.566% 11.022% 11.474% 11.944% 13.104% 12.854% 13.593% 11.851% CAP EX: 11.84% ‐1,781 ‐1,465 ‐1,625 ‐1,519 ‐1,585 ‐1,650 ‐1,717 ‐1,884 ‐1,848 ‐1,954 ‐1,704 Δ Working Capital : f(Revenue)2022 Δ Working Capital : f(Revenue)2023 Δ Working Capital : f(Revenue)2024 Δ Working Capital : f(Revenue)2025 Δ Working Capital : f(Revenue)2026 Δ Working Capital : f(Revenue)2027 Δ Working Capital : f(Revenue)2028 Δ Working Capital : f(Revenue)2029 Δ Working Capital : f(Revenue)2030 Δ Working Capital : f(Revenue)2031 Δ Working Capital : f(Revenue)2032 -5.000% 0.500% ‐5.156% ‐5.605% ‐6.466% ‐5.700% ‐5.285% ‐5.389% ‐4.862% ‐5.491% ‐5.957% ‐4.851% ‐4.731% Δ WRK CAP: ‐5.41% ‐741 ‐806 ‐930 ‐820 ‐760 ‐775 ‐699 ‐790 ‐857 ‐698 ‐680 Equity Minority Interest : f(Revenue)2022 Equity Minority Interest : f(Revenue)2023 Equity Minority Interest : f(Revenue)2024 Equity Minority Interest : f(Revenue)2025 Equity Minority Interest : f(Revenue)2026 Equity Minority Interest : f(Revenue)2027 Equity Minority Interest : f(Revenue)2028 Equity Minority Interest : f(Revenue)2029 Equity Minority Interest : f(Revenue)2030 Equity Minority Interest : f(Revenue)2031 Equity Minority Interest : f(Revenue)2032 -0.135% 0.013% ‐0.159% ‐0.112% ‐0.127% ‐0.149% ‐0.133% ‐0.150% ‐0.108% ‐0.143% ‐0.152% ‐0.140% ‐0.157% EARN AFFL: ‐0.14% ‐23 ‐16 ‐18 ‐21 ‐19 ‐22 ‐16 ‐21 ‐22 ‐20 ‐23 ‐14,304 LESS CURRENT DEBT AND OTHER LONG-TERM LIABILITIES T₀ (Adjusted for Carrying Costs ) 0 LESS PREFERRED AT PAR T₀ 4,476 EXCESS CASH & SHORT-TERM SECURITIES T₀ GROWTH 2.500% DCF analysis will deduct the total value of liabilities from the firm's cash position. PERPETUITY VALUE FCF to Equity 3,214 3,383 2,905 2,863 3,154 3,301 2,950 3,706 2,919 2,968 2,973 69,894 WACC FOR SIMULATION 6.860% 0.137% To assess liquidity at T₀, DCF analysis will deduct Balance Sheet Liabilities from Cash + Short‐term securities. 6.828% DCF to the Investors 45,478 DCF analysis will deduct the total value of liabilities from the firm's cash position. BIIB: Biogen Inc. | FEIN 33-0112644: Monte Carlo: Valuation Per Share | $USD 254.318 PER SHARE Beharry, Lyndon Martin W. 2022‐07‐15_BIIB_MC‐Equity‐Trials|DCF All Variable_MC 07/15/2022 17:26 Page 10E of 17