Download to read offline
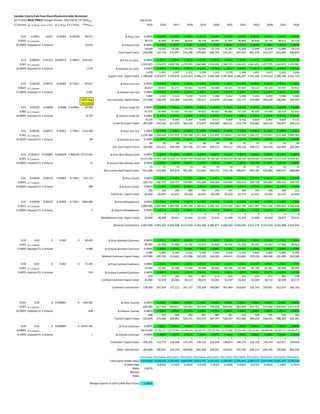


This document provides economic projections for various commodities from 2015 to 2026, including changes in price, volume, export value, and other metrics. It includes projections for coal, copper concentrate, iron ore, crude oil, zinc ore, non-money gold, calcite, molybdenum, washed cashmere, combed cashmere, and total mineral contributions. For each commodity, it shows the projected annual percentage change in price and volume, as well as total export value. The projections contain values for mean price changes, standard deviation of price changes, and other statistical indicators.


