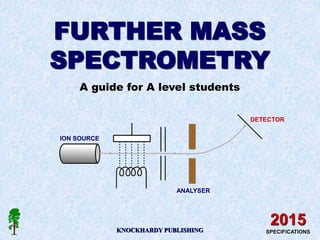
2. INTRODUCTION
This Powerpoint show is one of several produced to help students understand
selected topics at AS and A2 level Chemistry. It is based on the requirements of
the AQA and OCR specifications but is suitable for other examination boards.
Individual students may use the material at home for revision purposes or it may
be used for classroom teaching if an interactive white board is available.
Accompanying notes on this, and the full range of AS and A2 topics, are available
from the KNOCKHARDY SCIENCE WEBSITE at...
www.argonet.co.uk/users/hoptonj/sci.htm
Navigation is achieved by...
either clicking on the grey arrows at the foot of each page
or using the left and right arrow keys on the keyboard
MASS SPECTROMETRY
KNOCKHARDY PUBLISHING
3. CONTENTS
• Fragmentation of molecular ions - theory
• What a mass spectrum tells you
• Molecular ions
• Fragmentation
• Mass spectra of alkanes
• Mass spectra of halogenoalkanes
• Mass spectra of aldehydes and ketones
• Test questions
• Check list
MASS SPECTROMETRY
4. Before you start it would be helpful to…
• recall the basic principles of a mass spectrometer
• know the different types of functional group in organic chemsitry
MASS SPECTROMETRY
5. IONISATION
FRAGMENTION
FRAGMENTION
RE-ARRANGEMENT
MOLECULAR MASS DETERMINATION
USING MASS SPECTROMETRY
Nowadays, mass spectrometry is used
to identify unknown or new compounds.
When a molecule is ionised it forms a
MOLECULAR ION which can also
undergo FRAGMENTATION or RE-
ARRANGEMENT to produce particles of
smaller mass.
Only particles with a positive charge
will be deflected and detected.
The resulting spectrum has many peaks.
The final peak (M+) shows the molecular
ion (highest m/z value) and indicates the
molecular mass. The rest of the
spectrum provides information about
the structure.
MOLECULAR ION
6. Spectra obtained for organic molecules have many peaks. Each peak is due to a
particular fragment with a certain m/z value.
highest m/z value usually corresponds to the molecular ion
its position provides information about the molecular mass of a substance
the tallest peaks come from the most stable species
THE MASS SPECTRUM
7. Spectra obtained for organic molecules have many peaks. Each peak is due to a
particular fragment with a certain m/z value.
highest m/z value usually corresponds to the molecular ion
its position provides information about the molecular mass of a substance
the tallest peaks come from the most stable species
THE MASS SPECTRUM
Interpretation of thousands of spectra has shown that many classes of organic
compound show characteristic fragmentation patterns due to their functional groups.
It is possible to identify the type of compound from its spectrum by looking at the ...
position of peaks
differences between major peaks
8. In the spectrum of octane, a signal occurs at 114 due to the species C8H18
+
THE MASS SPECTRUM - THE MOLECULAR ION
10 20 30 40 50 60 70 80 90 100 110 120 130 140
0 m/z
20
40
60
80
100
Abundance
%
114
.
The species due to the final signal is known as the molecular ion and is usually
corresponds to the molecular mass of the compound.
molecular ion
9. THE MASS SPECTRUM - THE MOLECULAR ION
The small peak (M+1) at 115 due to the natural abundance (about 1%) of carbon-13.
The height of this peak relative to that for the molecular ion depends on the number
of carbon atoms in the molecule. The more carbons present, the larger the M+1 peak.
10 20 30 40 50 60 70 80 90 100 110 120 130 140
0 m/z
20
40
60
80
100
Abundance
%
114
.
10. THE MASS SPECTRUM - FRAGMENTATION
10 20 30 40 50 60 70 80 90 100 110 120 130 140
0 m/z
20
40
60
80
100
Abundance
%
29
71
43
57
114
85
.
The rest of the spectrum provides additional information of the molecule’s structure.
Peaks appear due to characteristic fragments (e.g. 29 due to C2H5
+) and differences
between two peaks also indicates the loss of certain units (18 for H2O, 28 for CO).
11. The mass spectra of simple hydrocarbons have peaks at m/z values corresponding to
the ions produced by breaking C-C bonds. Peaks can occur at ...
m/z 15 29 43 57 71 85 etc.
CH3
+ C2H5
+ C3H7
+ C4H9
+ C5H11
+ C6H13
+
• the stability of the carbocation formed affects its abundance
• the more stable the cation the higher the peak
• the more alkyl groups attached to the carbocation the more stable it is
most stable tertiary 3° > secondary 2° > primary 1° least stable
alkyl groups are electron releasing and stabilise the cation
ALKANES
FRAGMENTATION PATTERNS
12. HALOGENOALKANES
FRAGMENTATION PATTERNS
Multiple peaks occur in the molecular ion region due to different halogen isotopes.
There are two peaks for the molecular ion of C2H5Br, one for the molecule containing
the isotope 79Br and the other for the one with the 81Br isotope. Because the two
isotopes are of similar abundance, the peaks are of similar height.
10 20 30 40 50 60 70 80 90 100 110 120 130 140
0 m/z
20
40
60
80
100
Abundance
%
molecular ion contains...79Br 81Br
13. Cleavage of bonds next to the carbonyl group (C=O) is a characteristic fragmentation
of aldehydes and ketones. A common fragment is carbon monoxide (CO) but as it is
a molecule and thus uncharged it will not produce a peak of its own. However, it will
produce an m/z drop of 28 somewhere in the spectrum.
The position of the carbonyl group influences the fragmentation pattern because the
molecular ion fragments either side of the carbonyl group
the more stable the acylium ion RCO+, the more abundant it will be and
the more abundant the species the taller its peak in the mass spectrum
FRAGMENTATION PATTERNS
ALDEHYDES AND KETONES
14. The position of the carbonyl group influences the fragmentation pattern because the
molecular ion fragments either side of the carbonyl group.
FRAGMENTATION PATTERNS
Aldehydes and ketones
O
CH3 C C4H9
MOLECULAR ION
has m/z = 100
• +
15. The position of the carbonyl group influences the fragmentation pattern because the
molecular ion fragments either side of the carbonyl group.
FRAGMENTATION PATTERNS
Aldehydes and ketones
O
CH3 C C4H9
O
C4H9 C+
CH3•
O
C4H9 C• CH3
+
m/z = 15
m/z = 85
MOLECULAR ION
has m/z = 100
Breaking the bond between the methyl
group and the carbonyl group
produces two possible ions,
depending on how the bond breaks.
Two peaks at m/z values 15 and 85 will
appear in the mass spectrum.
• +
16. The position of the carbonyl group influences the fragmentation pattern because the
molecular ion fragments either side of the carbonyl group.
FRAGMENTATION PATTERNS
Aldehydes and ketones
O
CH3 C C4H9
O
CH3 C+ C4H9•
O
CH3 C• C4H9
+
m/z = 57
m/z = 43
MOLECULAR ION
has m/z = 100
• +
Breaking the bond between the butyl
group and the carbonyl group
produces two further ions, depending
on how the bond breaks.
Two peaks at m/z values 43 and 57 will
appear in the mass spectrum.
17. The position of the carbonyl group influences the fragmentation pattern because the
molecular ion fragments either side of the carbonyl group.
FRAGMENTATION PATTERNS
Aldehydes and ketones
O
CH3 C C4H9
O
CH3 C+ C4H9•
O
CH3 C• C4H9
+
m/z = 57
m/z = 43
O
C4H9 C+
CH3•
O
C4H9 C• CH3
+
m/z = 15
m/z = 85
MOLECULAR ION
has m/z = 100
• +
A further peak occurs at m/z = 72 (100-28) due to loss of CO
Example;
m/z = 28
27. REVISION CHECK
What should you be able to do?
Understand how mass spectrometry can be used to calculate molecular mass
Recall the term molecular ion and understand what information it provides
Interpret simple mass spectra
CAN YOU DO ALL OF THESE? YES NO
28. You need to go over the
relevant topic(s) again
Click on the button to
return to the menu