Dividend Policy and Dividend Decision Theories.pptx
Keynote commodity daily report 070911
1. Daily Commodity Outlook
7th September 2011
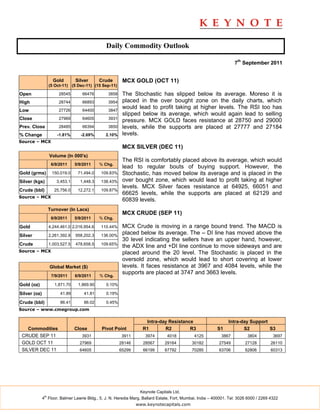
Gold Silver Crude MCX GOLD (OCT 11)
(5 Oct-11) (5 Dec-11) (15 Sep-11)
Open 28545 66476 3858 The Stochastic has slipped below its average. Moreso it is
High 28744 66893 3954 placed in the over bought zone on the daily charts, which
would lead to profit taking at higher levels. The RSI too has
Low 27726 64400 3847
slipped below its average, which would again lead to selling
Close 27969 64605 3931
pressure. MCX GOLD faces resistance at 28750 and 29000
Prev. Close 28485 66394 3850 levels, while the supports are placed at 27777 and 27184
% Change -1.81% -2.69% 2.10% levels.
Source – MCX
MCX SILVER (DEC 11)
Volume (In 000's)
The RSI is comfortably placed above its average, which would
6/9/2011 5/9/2011 % Chg.
lead to regular bouts of buying support. However, the
Gold (grms) 150,019.0 71,494.0 109.83% Stochastic, has moved below its average and is placed in the
Silver (kgs) 3,453.1 1,448.3 138.43% over bought zone, which would lead to profit taking at higher
levels. MCX Silver faces resistance at 64925, 66051 and
Crude (bbl) 25,756.0 12,272.1 109.87%
66625 levels, while the supports are placed at 62129 and
Source – MCX
60839 levels.
Turnover (In Lacs)
MCX CRUDE (SEP 11)
6/9/2011 5/9/2011 % Chg.
Gold 4,244,461.0 2,016,954.6 110.44% MCX Crude is moving in a range bound trend. The MACD is
Silver 2,261,392.8 958,202.3 136.00%
placed below its average. The – DI line has moved above the
30 level indicating the sellers have an upper hand, however,
Crude 1,003,527.5 478,658.5 109.65%
the ADX line and +DI line continue to move sideways and are
Source – MCX placed around the 20 level. The Stochastic is placed in the
oversold zone, which would lead to short covering at lower
Global Market ($) levels. It faces resistance at 3967 and 4084 levels, while the
supports are placed at 3747 and 3663 levels.
7/9/2011 6/9/2011 % Chg.
Gold (oz) 1,871.70 1,869.90 0.10%
Silver (oz) 41.89 41.81 0.19%
Crude (bbl) 86.41 86.02 0.45%
Source – www.cmegroup.com
Intra-day Resistance Intra-day Support
Commodities Close Pivot Point R1 R2 R3 S1 S2 S3
CRUDE SEP 11 3931 3911 3974 4018 4125 3867 3804 3697
GOLD OCT 11 27969 28146 28567 29164 30182 27549 27128 26110
SILVER DEC 11 64605 65299 66199 67792 70285 63706 62806 60313
Keynote Capitals Ltd.
th
4 Floor, Balmer Lawrie Bldg., 5, J. N. Heredia Marg, Ballard Estate, Fort, Mumbai, India – 400001. Tel: 3026 6000 / 2269 4322
www.keynotecapitals.com
2. Disclaimer
This document is not for public distribution and has been furnished to you solely for your information and must not be reproduced or
redistributed to any other person. Persons into whose possession this document may come are required to observe these restrictions.
This material is for the personal information of the authorized recipient, and we are not soliciting any action based upon it. This report
is not to be construed as an offer to sell or the solicitation of an offer to buy any security in any jurisdiction where such an offer or
solicitation would be illegal. It is for the general information of clients of Keynote Capitals Ltd. It does not constitute a personal
recommendation or take into account the particular investment objectives, financial situations, or needs of individual clients.
We have reviewed the report, and in so far as it includes current or historical information, it is believed to be reliable though its
accuracy or completeness cannot be guaranteed. Neither Keynote Capitals Ltd., nor any person connected with it, accepts any liability
arising from the use of this document. The recipients of this material should rely on their own investigations and take their own
professional advice. Price and value of the investments referred to in this material may go up or down. Past performance is not a guide
for future performance. Certain transactions -including those involving futures, options and other derivatives as well as non-investment
grade securities - involve substantial risk and are not suitable for all investors. Reports based on technical analysis centers on studying
charts of a stock’s price movement and trading volume, as opposed to focusing on a company’s fundamentals and as such, may not
match with a report on a company’s fundamentals.
Opinions expressed are our current opinions as of the date appearing on this material only. While we endeavor to update on a
reasonable basis the information discussed in this material, there may be regulatory, compliance, or other reasons that prevent us
from doing so. Prospective investors and others are cautioned that any forward-looking statements are not predictions and may be
subject to change without notice. Our proprietary trading and investment businesses may make investment decisions that are
inconsistent with the recommendations expressed herein.
We and our affiliates, officers, directors, and employees world wide may: (a) from time to time, have long or short positions in, and buy
or sell the securities thereof, of company (ies) mentioned herein or (b) be engaged in any other transaction involving such securities
and earn brokerage or other compensation or act as a market maker in the financial instruments of the company (ies) discussed herein
or act as advisor or lender / borrower to such company (ies) or have other potential conflict of interest with respect to any
recommendation and related information and opinions.
The analyst for this report certifies that all of the views expressed in this report accurately reflect his or her personal views about the
subject company or companies and its or their securities, and no part of his or her compensation was, is or will be, directly or indirectly
related to specific recommendations or views expressed in this report.
No part of this material may be duplicated in any form and/or redistributed without Keynote Capitals Ltd’s., prior written consent.
Keynote Capitals Ltd.
th
4 Floor, Balmer Lawrie Bldg., 5, J. N. Heredia Marg, Ballard Estate, Fort, Mumbai, India – 400001. Tel: 3026 6000 / 2269 4322
www.keynotecapitals.com