Bayesian Model for Multivatiate Functional Principle Components Analysis
•
0 likes•325 views

Kevin Cummins Joint Doctoral Program in Interdisciplinary Research on Substance Use University of California, San Diego JSM Digital Poster Presentation, August 2015

Recommended
Recommended
More Related Content
What's hot
What's hot (19)
Viewers also liked
Viewers also liked (6)
Similar to Bayesian Model for Multivatiate Functional Principle Components Analysis
Similar to Bayesian Model for Multivatiate Functional Principle Components Analysis (20)
More from Kevin Cummins
More from Kevin Cummins (8)
Recently uploaded
Recently uploaded (20)
Bayesian Model for Multivatiate Functional Principle Components Analysis
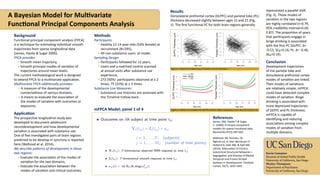
- 1. Background Functional principal component analysis (FPCA) is a technique for estimating individual smooth trajectories from sparse longitudinal data (James, Hastie & Sugar 2000). FPCA provides: • Smooth mean trajectory, • Smooth principal modes of variation of trajectories around mean levels. The current methodological work is designed to extend FPCA to a multivariate application. Multivariate FPCA additionally provides: • A measure of the developmental connectedness of various domains, • A means to evaluate the association of the modes of variation with outcomes or exposures. Application The prospective longitudinal study was developed to document adolescent neurodevelopment and how developmental variation is associated with substance use. One of five investigated pairs of brain regions predicted to be develop in syncrony is reported here (Walhovd et al. 2014). We describe patterns of development in those two regions: • Evaluate the association of the modes of variation for the two domains, • Evaluate the association between the modes of variation and clinical outcomes. Methods Participants: • Healthy 12-14 year-olds (54% female) at recruitment (N=295), • All non-substance users at intake. Sampling Design: • Participants followed for 12 years, • Users and a matched control scanned at annual visits after substance use experience, • 272 (92%) participants observed at ≥ 2 times, 75 (25%) at ≥ 3 times. Substance Use Measures: • Substance use histories are assessed with the Timeline Follow-back. mFPCA Model; panel 1 of 4 A Bayesian Model for Multivariate Functional Principal Components Analysis Outline Functional Principal Components Analysis (FPCA) Multivariate Functional Principal Component Analysis (mFPCA) Multivariate Sparse Longitudinal Data Outcomes on ith subject at time point tij Yi(tij) = fi(tij) + ✏ij i = 1, . . . , N; (subjects) j = 1, . . . , Mi; (number of time points) Yi(tij): P-dimensional observed fMRI response at time tij fi(tij): P-dimensional smooth response at time tij ✏ij(t) ⇠ iid NP (0, diag(σ2 ✏,p)) Kevin Cummins Division of Global Public Health University of California, San Diego Wesley Thompson Department of Psychiatry University of California, San Diego References James, GM, Hastie T & Sugar C. (2000). Principal component models for sparse functional data. Biometrika 87(3) 587-602. Walhovd, KB, Tamnes, CK, Bjørnerud, A, Due-Tønnessen P, Holland D, Dale AM, & Fjell AM (2014). Maturation of Cortico- Subcortical Structural Networks— Segregation and Overlap of Medial Temporal and Fronto-Striatal Systems in Development. Cerebral Cortex, 25(7), 1835-1841. Results Dorsolateral prefrontal cortex (DLPFC) and parietal lobe (PL) thickness decreased slightly between ages 12 and 21 (Fig. 1). The first functional PC for both brain regions generally −2−10123 12 15 18 21 24 27 Age (yrs) DLPFCThickness(µm) Age (yrs) −3−2−10123 ParietalThickness(µm) 12 15 18 21 24 27 −2−10123 12 15 18 21 24 27 Age (yrs) DLPFCThickness(µm) Age (yrs) −3−2−10123 ParietalThickness(µm) 12 15 18 21 24 27 +1 SD -1 SD Mean represented a parallel shift (Fig. 2). These modes of variation in the two regions are highly correlated (r=0.79, 95% credibility interval=0.69, 0.87). The proportion of years that participants engage in binge drinking is associated with the first PC (DLPFC: b= -0.53, SEb=0.16; PL: b= -0.46, SEb=0.14). Conclusion Development trajectories of the parietal lobe and dorsolateral prefrontal cortex modes of variation are linked. Their modes of variations are relatively simple; mFPCA could have detected complex modes of variation. Binge drinking is associated with more depressed trajectories of DLPFC and PL thinkness. mFPCA is capable of identifying and reducing associations among complex modes of variation from multiple domains. Figure 2. Modes of variation for DLPFC and PL. Mean trajectory ±1 st. dev. for the first PC. Figure 1. Observed trajectories of DLPFC and PL thickness.
- 2. Background Functional principal component analysis (FPCA) is a technique for estimating individual smooth trajectories from sparse longitudinal data (James, Hastie & Sugar 2000). FPCA provides: • Smooth mean trajectory, • Smooth principal modes of variation of trajectories around mean levels. The current methodological work is designed to extend FPCA to a multivariate application. Multivariate FPCA additionally provides: • A measure of the developmental connectedness of various domains, • A means to evaluate the association of the modes of variation with outcomes or exposures. Application The prospective longitudinal study was developed to document adolescent neurodevelopment and how developmental variation is associated with substance use. One of five investigated pairs of brain regions predicted to be develop in syncrony is reported here (Walhovd et al. 2014). We describe patterns of development in those two regions: • Evaluate the association of the modes of variation for the two domains, • Evaluate the association between the modes of variation and clinical outcomes. Methods Participants: • Healthy 12-14 year-olds (54% female) at recruitment (N=295), • All non-substance users at intake. Sampling Design: • Participants followed for 12 years, • Users and a matched control scanned at annual visits after substance use experience, • 272 (92%) participants observed at ≥ 2 times, 75 (25%) at ≥ 3 times. Substance Use Measures: • Substance use histories are assessed with the Timeline Follow-back. mFPCA Model; panel 2 of 4 A Bayesian Model for Multivariate Functional Principal Components Analysis Outline Functional Principal Components Analysis (FPCA) Multivariate Functional Principal Component Analysis (mFPCA) mFPCA The smooth responses are modeled as fi(tij) = µ(tij) + hi(tij) = ΦT (tij)✓µ + ΦT (tij)⇥↵i µi(t) = ΦT (t)✓µ: overall mean functions at time t hi(t) = ΦT (t)⇥↵i: the smoothed deviation of the ith subject from the mean curves. FPC functions ΦT (t)⇥ characterize the major modes of variation in all P outcome variables. ↵i ⇠ N(0, ⌃↵). Kevin Cummins Division of Global Public Health University of California, San Diego Wesley Thompson Department of Psychiatry University of California, San Diego References James, GM, Hastie T & Sugar C. (2000). Principal component models for sparse functional data. Biometrika 87(3) 587-602. Walhovd, KB, Tamnes, CK, Bjørnerud, A, Due-Tønnessen P, Holland D, Dale AM, & Fjell AM (2014). Maturation of Cortico- Subcortical Structural Networks— Segregation and Overlap of Medial Temporal and Fronto-Striatal Systems in Development. Cerebral Cortex, 25(7), 1835-1841. Results Dorsolateral prefrontal cortex (DLPFC) and parietal lobe (PL) thickness decreased slightly between ages 12 and 21 (Fig. 1). The first functional PC for both brain regions generally −2−10123 12 15 18 21 24 27 Age (yrs) DLPFCThickness(µm) Age (yrs) −3−2−10123 ParietalThickness(µm) 12 15 18 21 24 27 −2−10123 12 15 18 21 24 27 Age (yrs) DLPFCThickness(µm) Age (yrs) −3−2−10123 ParietalThickness(µm) 12 15 18 21 24 27 +1 SD -1 SD Mean represented a parallel shift (Fig. 2). These modes of variation in the two regions are highly correlated (r=0.79, 95% credibility interval=0.69, 0.87). The proportion of years that participants engage in binge drinking is associated with the first PC (DLPFC: b= -0.53, SEb=0.16; PL: b= -0.46, SEb=0.14). Conclusion Development trajectories of the parietal lobe and dorsolateral prefrontal cortex modes of variation are linked. Their modes of variations are relatively simple; mFPCA could have detected complex modes of variation. Binge drinking is associated with more depressed trajectories of DLPFC and PL thinkness. mFPCA is capable of identifying and reducing associations among complex modes of variation from multiple domains. Figure 2. Modes of variation for DLPFC and PL. Mean trajectory ±1 st. dev. for the first PC. Figure 1. Observed trajectories of DLPFC and PL thickness.
- 3. Background Functional principal component analysis (FPCA) is a technique for estimating individual smooth trajectories from sparse longitudinal data (James, Hastie & Sugar 2000). FPCA provides: • Smooth mean trajectory, • Smooth principal modes of variation of trajectories around mean levels. The current methodological work is designed to extend FPCA to a multivariate application. Multivariate FPCA additionally provides: • A measure of the developmental connectedness of various domains, • A means to evaluate the association of the modes of variation with outcomes or exposures. Application The prospective longitudinal study was developed to document adolescent neurodevelopment and how developmental variation is associated with substance use. One of five investigated pairs of brain regions predicted to be develop in syncrony is reported here (Walhovd et al. 2014). We describe patterns of development in those two regions: • Evaluate the association of the modes of variation for the two domains, • Evaluate the association between the modes of variation and clinical outcomes. Methods Participants: • Healthy 12-14 year-olds (54% female) at recruitment (N=295), • All non-substance users at intake. Sampling Design: • Participants followed for 12 years, • Users and a matched control scanned at annual visits after substance use experience, • 272 (92%) participants observed at ≥ 2 times, 75 (25%) at ≥ 3 times. Substance Use Measures: • Substance use histories are assessed with the Timeline Follow-back. mFPCA Model; panel 3 of 4 A Bayesian Model for Multivariate Functional Principal Components Analysis Outline Functional Principal Components Analysis (FPCA) Multivariate Functional Principal Component Analysis (mFPCA) mFPCA The response of individual i at time t is multivariate and modeled as Yi(t) = ΦT (t)✓µ + ΦT (t)⇥↵i + ✏i(t) Yi(t): P-dimensional observed response at time t φ(t) = (φ1(t), φ2(t), . . . , φK (t))T : K-dimensional vector of orthogonal basis functions evaluated at time tij and ΦT (t) = 2 6 6 4 φT (t) . . . 0T . .. ... . .. 0T . . . φT (t) 3 7 7 5 ⇥p: K by Qp matrix of spline coefficients subject to ⇥T p ⇥p = I and ⇥ = 2 6 4 ⇥1 . . . 0 ... ... ... 0T . . . ⇥P 3 7 5 Kevin Cummins Division of Global Public Health University of California, San Diego Wesley Thompson Department of Psychiatry University of California, San Diego References James, GM, Hastie T & Sugar C. (2000). Principal component models for sparse functional data. Biometrika 87(3) 587-602. Walhovd, KB, Tamnes, CK, Bjørnerud, A, Due-Tønnessen P, Holland D, Dale AM, & Fjell AM (2014). Maturation of Cortico- Subcortical Structural Networks— Segregation and Overlap of Medial Temporal and Fronto-Striatal Systems in Development. Cerebral Cortex, 25(7), 1835-1841. Results Dorsolateral prefrontal cortex (DLPFC) and parietal lobe (PL) thickness decreased slightly between ages 12 and 21 (Fig. 1). The first functional PC for both brain regions generally −2−10123 12 15 18 21 24 27 Age (yrs) DLPFCThickness(µm) Age (yrs) −3−2−10123 ParietalThickness(µm) 12 15 18 21 24 27 −2−10123 12 15 18 21 24 27 Age (yrs) DLPFCThickness(µm) Age (yrs) −3−2−10123 ParietalThickness(µm) 12 15 18 21 24 27 +1 SD -1 SD Mean represented a parallel shift (Fig. 2). These modes of variation in the two regions are highly correlated (r=0.79, 95% credibility interval=0.69, 0.87). The proportion of years that participants engage in binge drinking is associated with the first PC (DLPFC: b= -0.53, SEb=0.16; PL: b= -0.46, SEb=0.14). Conclusion Development trajectories of the parietal lobe and dorsolateral prefrontal cortex modes of variation are linked. Their modes of variations are relatively simple; mFPCA could have detected complex modes of variation. Binge drinking is associated with more depressed trajectories of DLPFC and PL thinkness. mFPCA is capable of identifying and reducing associations among complex modes of variation from multiple domains. Figure 2. Modes of variation for DLPFC and PL. Mean trajectory ±1 st. dev. for the first PC. Figure 1. Observed trajectories of DLPFC and PL thickness.
- 4. Background Functional principal component analysis (FPCA) is a technique for estimating individual smooth trajectories from sparse longitudinal data (James, Hastie & Sugar 2000). FPCA provides: • Smooth mean trajectory, • Smooth principal modes of variation of trajectories around mean levels. The current methodological work is designed to extend FPCA to a multivariate application. Multivariate FPCA additionally provides: • A measure of the developmental connectedness of various domains, • A means to evaluate the association of the modes of variation with outcomes or exposures. Application The prospective longitudinal study was developed to document adolescent neurodevelopment and how developmental variation is associated with substance use. One of five investigated pairs of brain regions predicted to be develop in syncrony is reported here (Walhovd et al. 2014). We describe patterns of development in those two regions: • Evaluate the association of the modes of variation for the two domains, • Evaluate the association between the modes of variation and clinical outcomes. Methods Participants: • Healthy 12-14 year-olds (54% female) at recruitment (N=295), • All non-substance users at intake. Sampling Design: • Participants followed for 12 years, • Users and a matched control scanned at annual visits after substance use experience, • 272 (92%) participants observed at ≥ 2 times, 75 (25%) at ≥ 3 times. Substance Use Measures: • Substance use histories are assessed with the Timeline Follow-back. mFPCA Model; panel 4 of 4 A Bayesian Model for Multivariate Functional Principal Components Analysis Outline Functional Principal Components Analysis (FPCA) Multivariate Functional Principal Component Analysis (mFPCA) mFPCA The strength of association among variables is modeled on the smoothed response level via correlations between PC scores: ↵i ⇠ N(0, ⌃↵) and ⌃↵ is restricted to the form 0 B B B @ ⌃1 C12 · · · C1P CT 12 ⌃2 · · · C2P . .. . .. ... . .. CT 1P CT 2P · · · ⌃P 1 C C C A ⌃1, ⌃2, . . . , ⌃P are diagonal matrices ⌃↵ can also be written as ⌃↵ = D↵R↵D↵ where D↵ is diagonal and R↵ is restricted to the form as 0 B B B @ IQ1 R12 · · · R1P RT 12 IQ2 · · · R2P ... ... ... ... RT 1P RT 2P · · · IQP 1 C C C A Kevin Cummins Division of Global Public Health University of California, San Diego Wesley Thompson Department of Psychiatry University of California, San Diego References James, GM, Hastie T & Sugar C. (2000). Principal component models for sparse functional data. Biometrika 87(3) 587-602. Walhovd, KB, Tamnes, CK, Bjørnerud, A, Due-Tønnessen P, Holland D, Dale AM, & Fjell AM (2014). Maturation of Cortico- Subcortical Structural Networks— Segregation and Overlap of Medial Temporal and Fronto-Striatal Systems in Development. Cerebral Cortex, 25(7), 1835-1841. Results Dorsolateral prefrontal cortex (DLPFC) and parietal lobe (PL) thickness decreased slightly between ages 12 and 21 (Fig. 1). The first functional PC for both brain regions generally −2−10123 12 15 18 21 24 27 Age (yrs) DLPFCThickness(µm) Age (yrs) −3−2−10123 ParietalThickness(µm) 12 15 18 21 24 27 −2−10123 12 15 18 21 24 27 Age (yrs) DLPFCThickness(µm) Age (yrs) −3−2−10123 ParietalThickness(µm) 12 15 18 21 24 27 +1 SD -1 SD Mean represented a parallel shift (Fig. 2). These modes of variation in the two regions are highly correlated (r=0.79, 95% credibility interval=0.69, 0.87). The proportion of years that participants engage in binge drinking is associated with the first PC (DLPFC: b= -0.53, SEb=0.16; PL: b= -0.46, SEb=0.14). Conclusion Development trajectories of the parietal lobe and dorsolateral prefrontal cortex modes of variation are linked. Their modes of variations are relatively simple; mFPCA could have detected complex modes of variation. Binge drinking is associated with more depressed trajectories of DLPFC and PL thinkness. mFPCA is capable of identifying and reducing associations among complex modes of variation from multiple domains. Figure 2. Modes of variation for DLPFC and PL. Mean trajectory ±1 st. dev. for the first PC. Figure 1. Observed trajectories of DLPFC and PL thickness.