Isobaric vapor liquid equilibrium for binary mixtures of 3 methyl 1 butanol 3 methyl 1 bythyl 1 butyl ethanoate 1 pentanol pentyl athanoate
•
1 like•512 views

ELV

Recommended
Recommended
More Related Content
What's hot
What's hot (20)
Similar to Isobaric vapor liquid equilibrium for binary mixtures of 3 methyl 1 butanol 3 methyl 1 bythyl 1 butyl ethanoate 1 pentanol pentyl athanoate
Similar to Isobaric vapor liquid equilibrium for binary mixtures of 3 methyl 1 butanol 3 methyl 1 bythyl 1 butyl ethanoate 1 pentanol pentyl athanoate (20)
More from Josemar Pereira da Silva
More from Josemar Pereira da Silva (20)
Recently uploaded
Recently uploaded (20)
Isobaric vapor liquid equilibrium for binary mixtures of 3 methyl 1 butanol 3 methyl 1 bythyl 1 butyl ethanoate 1 pentanol pentyl athanoate
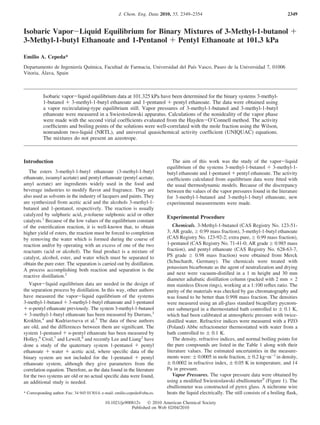
- 1. Isobaric Vapor-Liquid Equilibrium for Binary Mixtures of 3-Methyl-1-butanol + 3-Methyl-1-butyl Ethanoate and 1-Pentanol + Pentyl Ethanoate at 101.3 kPa Emilio A. Cepeda* Departamento de Ingenierı´a Quı´mica, Facultad de Farmacia, Universidad del Paı´s Vasco, Paseo de la Universidad 7, 01006 Vitoria, A´ lava, Spain Isobaric vapor-liquid equilibrium data at 101.325 kPa have been determined for the binary systems 3-methyl- 1-butanol + 3-methyl-1-butyl ethanoate and 1-pentanol + pentyl ethanoate. The data were obtained using a vapor recirculating-type equilibrium still. Vapor pressures of 3-methyl-1-butanol and 3-methyl-1-butyl ethanoate were measured in a Swiestoslawski apparatus. Calculations of the nonideality of the vapor phase were made with the second virial coefficients evaluated from the Hayden-O’Connell method. The activity coefficients and boiling points of the solutions were well-correlated with the mole fraction using the Wilson, nonrandom two-liquid (NRTL), and universal quasichemical activity coefficient (UNIQUAC) equations. The mixtures do not present an azeotrope. Introduction The esters 3-methyl-1-butyl ethanoate (3-methyl-1-butyl ethanoate, isoamyl acetate) and pentyl ethanoate (pentyl acetate, amyl acetate) are ingredients widely used in the food and beverage industries to modify flavor and fragrance. They are also used as solvents in the industry of lacquers and paints. They are synthesized from acetic acid and the alcohols 3-methyl-1- butanol and 1-pentanol, respectively. The reaction is usually catalyzed by sulphuric acid, p-toluene sulphonic acid or other catalysts.1 Because of the low values of the equilibrium constant of the esterification reaction, it is well-known that, to obtain higher yield of esters, the reaction must be forced to completion by removing the water which is formed during the course of reaction and/or by operating with an excess of one of the two reactants (acid or alcohol). The final product is a mixture of catalyst, alcohol, ester, and water which must be separated to obtain the pure ester. The separation is carried out by distillation. A process accomplishing both reaction and separation is the reactive distillation.2 Vapor-liquid equilibrium data are needed in the design of the separation process by distillation. In this way, other authors have measured the vapor-liquid equilibrium of the systems 3-methyl-1-butanol + 3-methyl-1-butyl ethanoate and 1-pentanol + n-pentyl ethanoate previously. The system 3-methyl-1-butanol + 3-methyl-1-butyl ethanoate has been measured by Durrans,3 Krokhin,4 and Kudriavtseva et al.5 The data of these authors are old, and the differences between them are significant. The system 1-pentanol + n-pentyl ethanoate has been measured by Holley,6 Croil,7 and Lewell,8 and recently Lee and Liang2 have done a study of the quaternary system 1-pentanol + pentyl ethanoate + water + acetic acid, where specific data of the binary system are not included for the 1-pentanol + pentyl ethanoate system, although they give parameters from the correlation equation. Therefore, as the data found in the literature for the two systems are old or no actual specific data were found, an additional study is needed. The aim of this work was the study of the vapor-liquid equilibrium of the systems 3-methyl-1-butanol + 3-methyl-1- butyl ethanoate and 1-pentanol + pentyl ethanoate. The activity coefficients calculated from equilibrium data were fitted with the usual thermodynamic models. Because of the discrepancy between the values of the vapor pressures found in the literature for 3-methyl-1-butanol and 3-methyl-1-butyl ethanoate, new experimental measurements were made. Experimental Procedure Chemicals. 3-Methyl-1-butanol (CAS Registry No. 123-51- 3; AR grade, g 0.99 mass fraction), 3-methyl-1-butyl ethanoate (CAS Registry No. 123-92-2; extra pure, g 0.99 mass fraction), 1-pentanol (CAS Registry No. 71-41-0; AR grade g 0.985 mass fraction), and pentyl ethanoate (CAS Registry No. 628-63-7, PS grade g 0.98 mass fraction) were obtained from Merck (Schuchardt, Germany). The chemicals were treated with potassium bicarbonate as the agent of neutralization and drying and next were vacuum-distilled in a 1 m height and 30 mm diameter adiabatic distillation column (packed with 2 mm × 2 mm stainless Dixon rings), working at a 1:100 reflux ratio. The purity of the materials was checked by gas chromatography and was found to be better than 0.998 mass fraction. The densities were measured using an all-glass standard bicapillary pycnom- eter submerged in a thermostatted bath controlled to ( 0.1 K, which had been calibrated at atmospheric pressure with twice- distilled water. Refractive indices were measured with a PZO (Poland) Abbe refractometer thermostatted with water from a bath controlled to ( 0.1 K. The density, refractive indices, and normal boiling points for the pure compounds are listed in the Table 1 along with their literature values. The estimated uncertainties in the measure- ments were: ( 0.0005 in mole fraction, ( 0.2 kg·m-3 in density, ( 0.0002 in refractive index, ( 0.05 K in temperature, and 14 Pa in pressure. Vapor Pressures. The vapor pressure data were obtained by using a modified Swiestoslawski ebulliometer9 (Figure 1). The ebulliometer was constructed of pyrex glass. A nichrome wire heats the liquid electrically. The still consists of a boiling flask,* Corresponding author. Fax: 34 945 013014; e-mail: emilio.cepeda@ehu.es. J. Chem. Eng. Data 2010, 55, 2349–2354 2349 10.1021/je900812v 2010 American Chemical Society Published on Web 02/04/2010
- 2. a Cottrell pump, an equilibrium chamber which was insulated with a vacuum air jacket, and a thermometer well. The vapor-liquid mixture generated in the boiling chamber is forced upward through the Cotrell tube and then flows to equilibrium chamber. The experimental atmospheric pressure was measured with a Fortin barometer with an estimated uncertainty of ( 4 Pa. The pressure inside the measuring still was measured with a mercury manometer with an estimated uncertainty of 14 Pa. The temperatures were measured with a calibrated (ITS 90) mercury thermometer with an uncertainty of 0.1 K. Apparatus and Procedure. The vapor-liquid equilibrium data were obtained by using a modified version of the equilib- rium still.10 The still was entirely constructed from borosilicate glass (Figure 2). The amount of solution required is about 65 cm3 per determination. The ebullition takes place in the lateral pipe heated electrically by means a nichrome resistance. To avoid the backward movement of the vapor, the lateral pipe has a variable narrowing. The bubbles ascend to the equilibrium chamber and are distributed in the liquid by means of a magnetic stirrer. The vapor goes out from the liquid at the equilibrium temperature. In each VLE experiment, the pressure was fixed and held constant by using a vacuum pump, and the heating and stirring systems of the liquid mixture were turned on. Equilibrium conditions were assumed when constant temperature and pressure were obtained for 60 min or longer. Then, samples of liquid and condensate were taken at the system pressure with the dispositive showed in the Figure 2. At least two analyses were made for each sample. The estimated uncertainties in the measurements of temper- ature were ( 0.05 K and in pressure were 14 Pa. Analysis. The compositions of the liquid and condensed-vapor samples from the PTxy experiments were analyzed by gas chromatography on a Perkin-Elmer 8700 with an flame ioniza- tion detector (FID). A stainless steel column of 2 m × 1/8 in. packed with Carbobax 20 M on Cromosorb W was used at 393.15 K with a helium flow rate of 30 cm3 ·min-1 and a sample injection volume of 0.1 µL. Good separation was achieved under these conditions, and calibration analyses were carried out to convert the peak ratio to the mass composition of the sample. The pertinent polynomial fit had a correlation coefficient r2 better than 0.99. At least three analyses were made of each sample. Mole fraction measurements had an estimated uncertainty of ( 0.0005. This estimate was done after to take several samples from the same phase at the same conditions and analyzing standards with the same analytical technique. Table 1. Physical Properties of the Pure Compounds: Densities, G (298.15 K), Refractive Indices, nD (298.15 K), and Normal Boiling Points, Tb (101.3 kPa) F/kg·m-3 nD Tb/K compound expt lit. expt lit. expt lit. 3-methyl-1- butanol 807.6 807.111 1.4051 1.405211 404.55 405.054 403.6511 404.3513 405.1512 3-methyl-1- butyl ethanoate 866.4 866.411 1.39893 1.398111 414.75 415.2511 415.254 415.2713 415.7021 414.9514 414.8520 1-pentanol 811.2 810.811 1.4077 1.408011 410.95 411.1311 410.9513 410.7514 n-pentyl ethanoate 872.3 871.911 1.4005 1.400511 421.55 422.3511 422.1513 421.5522 Figure 1. Swiestoslawski ebulliometer. Figure 2. Equilibrium apparatus. 2350 Journal of Chemical & Engineering Data, Vol. 55, No. 6, 2010
- 3. Results and Discussion Vapor Pressures. The vapor pressures were measured experimentally for pure 3-methyl-1-butanol and 3-methyl-1- butyl ethanoate, because important differences were found among the literature values. The experimental data are shown in Table 2. The literature values for the normal boiling temperature of 3-methyl-1-butanol are between 403.15 K11 and 405.15 K12 (Table 1). The experimental normal boiling temperature is 404.55 K near to value of 404.35 K of Daubert and Danner.13 The discrepancy of the experimental vapor pressures with those of other authors is shown in Figure 3. Several equations and experimental data were found in the literature for the boiling point and vapor pressures of 3-methyl- 1-butyl ethanoate (Table 1). The discrepancy of the experimental vapor pressures with the obtained data in this work is shown in Figure 4. The experimental data are coincident with the data given by Diaz et al.14 The temperature dependence of the pure component vapor pressure P0 was calculated using the Antoine equation (Table 3). The root-mean-square deviation of pressure (σ) between experimental and calculated values was defined by the following equation, σ ) [ ∑ i)1 n (Pi - Pi cal )2 /(n - 1)]1/2 (1) where n is the number of experimental data, Pi is the experimental vapor pressure, and Pi cal is the vapor pressure calculated at Ti temperature. The σ values are reported in Table 3. Table 2. Experimental Temperature-Vapor Pressure Data of 3-Methyl-1-butanol and 3-Methyl-1-butyl Ethanoate 3-methyl-1-butanol 3-methyl-1-butyl ethanoate T/K P/kPa T/K P/kPa T/K P/kPa T/K P/kPa 336.35 5.27 381.65 43.64 368.15 22.4 401.85 70.1 346.9 9.25 389.6 59.58 369.35 23.4 403.35 73.3 354.2 12.96 391.35 64.30 370.65 24.6 407.15 81.9 354.3 13.24 392.65 66.58 371.85 25.7 409.55 87.8 356.85 14.83 395.55 74.19 372.45 26.3 410.95 91.3 359.75 17.09 396.9 77.47 380.65 35.3 412.85 96.3 360.65 17.61 398.25 81.46 381.75 36.7 414.15 99.8 363.55 20.13 403.05 96.21 387 43.9 414.85 101.7 364.05 20.81 403.75 99.99 387.9 45.2 415.35 103.1 365.45 21.98 404.55 101.33 390.95 50.0 416.45 106.2 368.3 25.18 405.15 103.46 392.75 52.9 369.5 26.24 408.05 114.26 394.25 55.5 371.5 28.64 410.95 125.72 395.65 58.0 380.65 41.65 413.05 133.86 398.65 63.7 Figure 3. Discrepancy between experimental (P) and reported data (Pc) for the 3-methyl-1-butanol vapor pressure: O, Antoine correlation; ], Daubert and Danner;13 0, Riddick et al.;11 4, Joo and Arlt.24 Figure 4. Discrepancy between experimental (P) and reported data (Pc) for 3-methyl-1-butyl ethanoate vapor pressure: O, Antoine correlation: ×, Poling et al.;21 0, Riddick et al.;11 *, Chemcad;20 ], Daubert and Danner;13 4, Krokhin;4 +, Diaz et al.14 Table 3. Vapor Pressure Parameters of the Antoine Equation (ln P/kPa) ) A - B/((T/K) + C) compound A B C σ/kPa ref 3-methyl-1-butanol 14.7243 3002.04 -107.436 0.35 this work 3-methyl-1-butyl ethanoate 14.4851 3482.41 -61.6810 0.19 this work 1-pentanol 14.5133 2961.891 -111.843 11 pentyl ethanoate 13.4967 2888.5 -96.249 22 Table 4. Vapor-Liquid Equilibrium Data of the 3-Methyl-1-butanol + 3-Methyl-1-butyl Ethanoate System at 101.3 kPa T/K x1 y1 γ1 γ2 414.05 0.000 0.000 1.0000 413.15 0.025 0.044 1.3028 0.9997 411.95 0.059 0.098 1.2693 1.0007 410.55 0.108 0.169 1.2374 1.0045 410.05 0.185 0.265 1.1817 1.0102 408.85 0.218 0.303 1.1667 1.0117 408.45 0.299 0.388 1.1285 1.0249 407.45 0.330 0.418 1.1162 1.0308 406.75 0.424 0.504 1.0806 1.0512 406.15 0.504 0.574 1.0589 1.0692 405.75 0.578 0.636 1.0431 1.0919 405.15 0.650 0.695 1.0266 1.1162 405.05 0.768 0.794 1.0120 1.1574 404.95 0.794 0.815 1.0083 1.1729 404.85 0.838 0.855 1.0048 1.1759 404.75 0.863 0.876 1.0034 1.1896 404.75 0.891 0.900 1.0020 1.2069 404.65 0.904 0.912 1.0004 1.2093 404.55 0.923 0.929 1.0015 1.2169 404.55 0.959 0.961 1.0006 1.2503 414.05 1.000 1.000 1.000 Table 5. Vapor-Liquid Equilibrium Data of the 1-Pentanol + n-Pentyl Ethanoate System at 101.3 kPa T/K x1 y1 γ1 γ2 421.55 0.000 0.000 1.0000 421.35 0.0089 0.016 1.2950 0.9990 420.85 0.0252 0.043 1.2689 1.0005 420.75 0.0265 0.045 1.2664 1.0024 419.65 0.0752 0.120 1.2284 1.0006 417.35 0.186 0.266 1.1820 1.0063 415.25 0.324 0.414 1.1254 1.0216 414.85 0.356 0.446 1.1188 1.0229 414.65 0.376 0.463 1.1061 1.0287 414.35 0.404 0.490 1.0923 1.0371 413.85 0.446 0.526 1.0885 1.0403 413.35 0.498 0.570 1.0699 1.0573 412.85 0.558 0.623 1.0574 1.0690 412.35 0.624 0.675 1.0444 1.0869 411.75 0.735 0.769 1.0199 1.1359 411.65 0.760 0.789 1.0151 1.1489 411.55 0.777 0.803 1.0178 1.1430 411.45 0.8001 0.824 1.0149 1.1519 411.4 0.809 0.830 1.0132 1.1572 411.3 0.844 0.860 1.0111 1.1709 411.15 0.900 0.908 1.0072 1.1847 410.95 0.9822 0.983 1.0018 1.2200 410.95 1 1 1.0000 Journal of Chemical & Engineering Data, Vol. 55, No. 6, 2010 2351
- 4. Vapor-Liquid Equilibrium. The isobaric vapor-liquid equi- librium data for the two systems have been obtained at 101.3 kPa and are shown in Tables 4 and 5. The liquid-phase activity coefficients of the components in the mixtures were calculated from: φiyiP ) γixiφi S exp[Vi L (P - Pi S )/RT] (2) where φi is the fugacity coefficient of component i in the vapor phase, yi and xi are the molar fractions in the vapor and liquid phases, respectively, γi is the activity coefficient of i with respect to the reference fugacity, φi S is the fugacity coefficient of the pure saturated vapor of component i, Pi S is the vapor pressure of component i at temperature T, and Vi L is the molar volume of pure liquid. In the expression, it is assumed that the molar volume of component i is equal to the partial molar volume of component i at these conditions. The fugacity coefficients were estimated by using the virial equation of state truncated after the second term. The second virial coefficients were obtained by using the method of Hayden and O’Connell.15 The physical properties of the pure compo- nents required in this calculation are presented in Table 6. The Wilson, nonrandom two-liquid (NTRL), and universal qua- sichemical activity coefficient (UNIQUAC) models were used for the correlation of the activity coefficients. The values of Rk and Qk were taken from Hansen et al.16 in the UNIQUAC model. The estimation of the parameters was done with the maximum likelihood technique, where the pressure, temperature, and liquid and vapor concentrations are considered simultaneously. The computer subroutines given by Gess et al.17 were used. The fitted parameters along with the average mean deviations in vapor-phase mole fraction (∆y) are listed in Table 7. The best description of the equilibrium of the system 3-methyl-1-butanol + 3-methyl-1-butyl ethanoate was given by the UNIQUAC equation, with ∆y ) 0.007, with similar values for the other equations. Τhe results of correlations for the system 1-pentanol + pentyl ethanoate by use of the Wilson and NTRL models present better correlations (∆y ) 0.004) that those of the UNIQUAC model (∆y ) 0.006). Considering the large differ- ences in boiling points of the binary systems, the deviations are within an acceptable range. The two systems satisfactorily passed the thermodynamic consistency test by using the Herrington analysis.18 The values of D and J for 3-methyl-1-butanol + 3-methyl-1-butyl ethanoate were found to be 9.93 % and 3.52 % and for the 1-pentanol + pentyl ethanoate 9.19 % and 3.80 %. Also the consistency was checked by means of the modification of the Dechema test proposed by Gess et al.17 for the prediction of the mole fraction in the vapor phase. In the method the activity coefficients were calculated with the four-suffix Margules equation ln γ1 ) x2 2 [A + 2(B - A - D)x1 + 3Dx1 2 ] (3) ln γ2 ) x1 2 [B + 2(A - B - D)x2 + 3Dx2 2 ] (4) The pressure is calculated with the following equation, P* ) x1γ1*f1 0 φ1 + x2γ2*f2 0 φ2 (5) Here the asterisk (*) denoted a calculated value. The parameters of Margules equation were calculated by minimization of (P - P*). The values of y1 were estimated by y1 ) x1γ1 f11 0 P* (6) To pass the consistency test, a system must have an average deviation δ ) Σ|y - y*|/n lower than 0.01. The two systems have passed the test. The values of the constants A, B, D, and δ are shown in Table 8. The system 3-methyl-1-butanol + 3-methyl-1-butyl ethanoate has been measured by several authors. Durrans3 found an azeotrope at 101.3 kPa (393.25 K, x ) 0.98), although its data Table 6. Properties of the Pure Compounds Used in Calculating the Second Virial Coefficients and UNIQUAC Parameters: Critical Temperature Tc, Critical Pressure Pc, Critical Volume Vc, Mean Gyration Radius RD, Dipole Moment µ, Molar Volume MV (298 K), Structure Volume Parameter for the UNIQUAC Equation r, Structure Area Parameter for the UNIQUAC Equation q, Structure Volume Parameter for the Modified UNIQUAC Equation q′, Association or Solvation Parameter η, and Acentric Factor ω 3-methyl-1-butanol (1) 3-methy-1-butyl ethanoate (2) 1-pentanol (3) pentyl ethanoate (4) Tc a /K 579.45 597.05 588.15 597.05 Pc a /kPa 3920 2830 3910 2800 Vc a /m3 ·kmol-1 0.330 0.46 0.326 0.442 RD a ·10-10 /m 3.684 4.656 3.679 4.772 µa ·10-30 /C·m 6.0042 6.0042 5.904 6.6742 MVa /m3 ·kmol-1 0.1092 0.1502 0.1085 0.1495 ra 4.1279 5.5008 4.1287 5.5018 qa 3.588 4.7319 3.592 4.736 q′a 1.15 4.7319 1.15 4.736 ηassociation b 1.55 0.53 2.2 0.53 ηsolvation b (1) - (2), 1.3 (3) - (4), 1.3 ωa 0.5558 0.405 0.5738 0.4896 a Distil.23 b Gess et al.17 Table 7. Correlation Parameters for Activity Coefficients and Average Mean Deviation of the Vapor Molar Fraction (∆y) Wilson NRTL UNIQUAC system A/J·mol-1 B/J·mol-1 ∆y A/J·mol-1 B/J·mol-1 R ∆y A/J·mol-1 B/J·mol-1 ∆y 3-methyl-1-butanol + 3-methyl-1-butyl ethanoate 4518.06 -2897.26 0.008 -6518.62 8965.65 0.1041 0.008 -2656.04 4972.81 0.007 1-pentanol + pentyl ethanoate 3191.12 -1722.42 0.004 -1139.73 2623.61 0.3015 0.004 -2088.52 3818.61 0.006 Table 8. Results of the Thermodynamic Consistency Test Margules constants system average deviation δ A B D 3-methyl-1-butanol + 3-methyl-1-butyl ethanoate 0.0058 0.1304 -0.0684 -0.6472 1-pentanol + pentyl ethanoate 0.0052 0.5386 0.3788 0.5802 2352 Journal of Chemical & Engineering Data, Vol. 55, No. 6, 2010
- 5. are old and obtained with impure products. Kudryavtseva et al.5 found an azeotrope at 101.3 kPa (403.95 K, x ) 0.99). Krokhin4 also found an azeotrope at 101.3 kPa (403.15 K and x ) 0.93). Experiments between 0.959 and 0.99 mole fraction were made, but because of little difference between the values of x and y in the composition range, the obtained data were not taken into account, because very small errors in the composition give high deviations in activity coefficients. When the experi- mental data were correlated with the models used, an azeotrope was not found. The UNIFAC19 method predicted an azeotrope at x ) 0.72 and T ) 403.05 K, but the UNIFAC Dortmund method20 predicted no azeotrope. Our data are coincident with those predicted by the UNIFAC Dortmund method in the x-y diagram and are slightly different in the T-x-y diagram (Figure 5). The system 1-pentanol + n-pentyl ethanoate has been measured by Holley6 using impure products. Croil7 measured the system from x ) 0.4 to x ) 1 and did not find an azeotrope. Lewell8 determined the system but indicates that the data were not precise. More recently, Lee and Liang2 have done a study of the quaternary system pentanol + pentyl ethanoate + water + acetic acid, where specific data are not included for the system, although they give parameters for the correlation equation obtained from the data of the quaternary system (NRTL equation: A12 ) -932.67 ( 698.31/J·mol-1 , A21 ) 1984.44 ( 874.45/J·mol-1 , R ) 0.30). With these parameters, the equi- librium data were calculated with the vapor pressure equations used in this work and are shown in Figure 6. Our data are practically coincident with that calculated from the parameters given by Lee and Liang in the x-y diagram, showing differences in T-x-y diagram (Figure 6). No azeotrope was found. The UNIFAC19 method predicts the vapor-liquid equilibrium poorly. Our data are coincident with those predicted by the UNIFAC Dortmund method in the x-y diagram and are slightly different in the T-x-y diagram (Figure 6). No azeotrope was predicted by the UNIFAC Dortmund method. Conclusions Sets of experimental VLE data were obtained for the binary 3-methyl-1-butanol + 3-methy-1-butyl ethanoate and 1-pentanol + n-pentyl ethanoate systems at 101.3 kPa in an Othmer modified equilibrium still. No azeotropes were observed. The experimental data were correlated satisfactorily with the Wilson, NRTL, and UNIQUAC models. Consistency of experimental data was proved on the basis of the Herrington as well as the point-to-point direct test of thermodynamic consistency. Ac- cording to the later test, while omitting the most deviated points, the quality of measured data was classified to be good to excellent. Literature Cited (1) Liu, X. G.; Yin, Y. B.; Shi, M. C. Esterification of acetic acid with isoamyl alcohol over expandable graphite catalyst. Chem. World 1994, 35, 350–351. (2) Lee, L. S.; Liang, S. J. Phase and reaction equilibria of acetic acid 1-pentanol water n-amyl acetate system at 760 mm Hg. Fluid Phase Equilib. 1998, 149, 57–74. (3) Durrans, T. Treatise on distillation. Perfum. Essent. Oil Rec. 1920, 11, 154–198. (4) Krokhin, N. G. Equiibrium liquid-vapor ratios in the system acetic acid-isoamyl alcohol-isoamyl acetate. II. Binary systems acetic acid- isoamyl acetate and isoamyl alcohol-isoamyl acetate. Zh. Fiz. Khim. 1967, 41, 1509–1511. (5) Kudryavtseva, L. S.; Susarev, M. P.; Eisen, O. Concentration regions and thermal displacement of ternary azeotropes. VI. Repeated study of some azeotropes of ternary three-phase systems of the type water- alcohol-ester. Zh. Fiz. Khim. 1966, 40, 2637–2642. (6) Holley, C. D. Liquid mixtures of minimum boiling-point. J. Am. Chem. Soc. 1902, 24, 448–457. (7) Croil, T. A. B.A.Sc. Thesis, British Columbia University, Vancouver, BC Canada, 1957. (8) Lewell, P. A.; Kristmanson, D. D. Vapor-liquid equilibriums in mixtures of n-alcohols and their esters. AIChE J. 1967, 13, 814–815. (9) Swietoslawski, W.; Anderson, J. R. Determination of boiling and condensation temperatures. Phys. Methods Org. Chem. 1949, 1, 107– 140. (10) Mato, F.; Cepeda, E. Equilibrio lı´quido-vapor de mezclas binrias formadas por alcoholes y sus esteres del acido acetico. An. Quim. 1984, 80, 338–342. (11) Riddick, J. A.; Bunger, W. B.; Sakano, T. K. Organic solVents: physical properties and methods of purification, 4th ed; New York: Wiley, 1986. (12) Reddy, M. S.; Rao, C. V. Isothermal and Isobaric Vapor-Liquid Equilibrium Data System - Toulene-Isoamyl Alcohol. J. Chem. Eng. Data 1965, 10, 309–312. (13) Daubert, T. E.; Danner, R. P. Physical and thermodynamic properties of pure chemicals data compilation; Hemisphere Pub. Corp: New York, 1984. (14) Diaz, M. A. E.; Guetachew, T.; Landy, P.; Jose, J.; Voilley, A. Experimental and estimated saturated vapour pressures of aroma compounds. Fluid Phase Equilib. 1999, 157, 257–270. (15) Hayden, J. G.; O’Connell, J. P. Generalized method for predicting second virial-coefficients. Ind. Eng. Chem. Process Des. DeV. 1975, 14, 209–216. (16) Hansen, H. K.; Rasmussen, P.; Fredenslund, A.; Schiller, M.; Gmehling, J. Vapor-liquid-equilibria by Unifac group contribution. 5. Revision and extension. Ind. Eng. Chem. Res. 1991, 30, 2352– 2355. (17) Gess, M. A.; Danner, R. P.; Nagvekar, M. Thermodynamic analysis of Vapor-liquid equilibria: Recommended models and a standard data base; AIChE: New York, 1991. (18) Herrington, E. F. G. Tests of Consistency of Experimental Isobaric Vapor-Liquid Equilibrium Data. J. Inst. Pet. 1951, 37, 467–470. Figure 5. System of 3-methyl-1-butanol + 3-methyl-1-butyl ethanoate at 101.3 kPa. 0, experimental data; s, smoothed using NRTL; ----, UNIFAC Dortmund prediction.20 Figure 6. System of 1-pentanol + pentyl ethanoate at 101.3 kPa. 0, experimental data; s, smoothed using NRTL model; ----, smoothed with the NRTL constants of Lee and Liang;2 ++, predicted by UNIFAC method. Journal of Chemical & Engineering Data, Vol. 55, No. 6, 2010 2353
- 6. (19) Fredenslund, A.; Gmehling, J. R.; Rasmussen, P. Vapor-liquid equilibria using UNIFAC: a group-contribution method; Elsevier: Amsterdam, 1977. (20) ChemCAD 5.2.0 Professional; Chemstations, Inc.: Houston, TX, 2002. (21) Poling, B. E.; Reid, R. C.; Prausnitz, J. M.; O’Connell, J. P. The properties of gases and liquids, 5th ed.; McGraw-Hill: New York, 2001. (22) Brozena, A. Vapor Pressure of n-Amyl Acetate: Literature ReView and Experimental Determination; Chemical Research Development and Engineering Center, Aberdeen Proving Grounds: Aberdeen, MD, 1992; pp 1-47. (23) Distil 5.0; Hyprotech Ltd.: Calgary, Alberta, Canada, 2001. (24) Joo, H. J.; Arlt, W. Vapor-liquid equilibrium for the binary systems ethylene glycol-n-amyl alcohol and ethylene glycol-isoamyl alcohol. J. Chem. Eng. Data 1981, 26, 138–140. Received for review October 7, 2009. Accepted January 22, 2010. JE900812V 2354 Journal of Chemical & Engineering Data, Vol. 55, No. 6, 2010