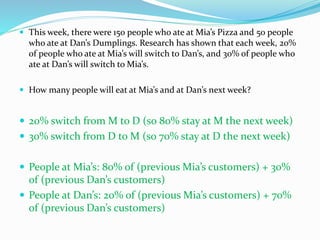
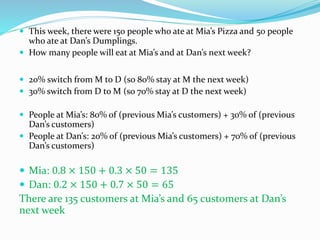
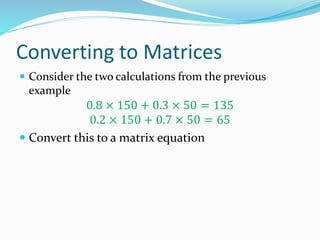
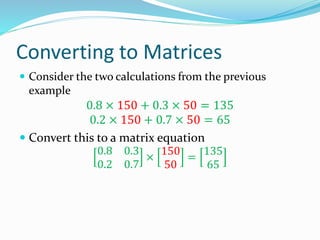
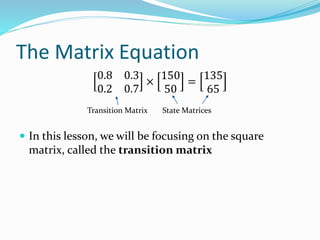
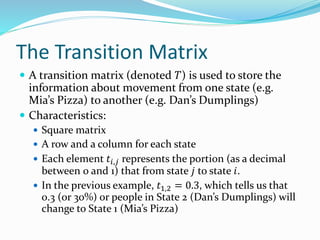
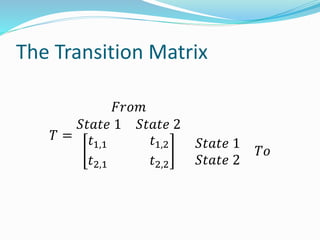
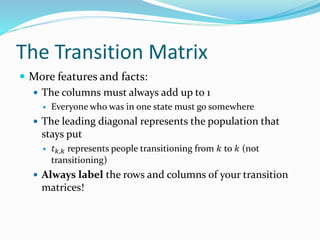
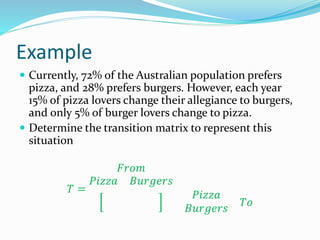
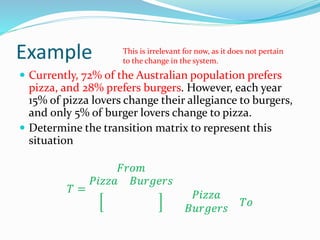
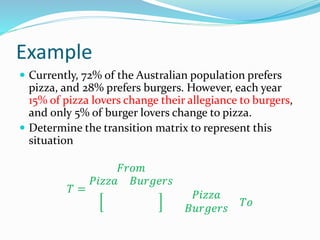
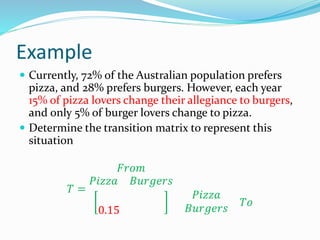
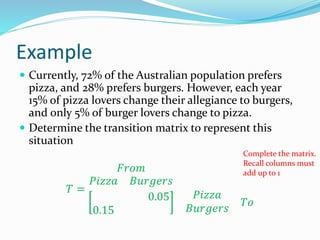
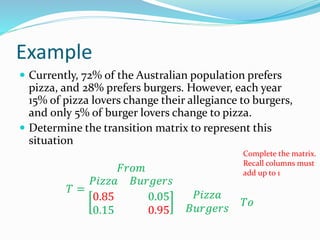
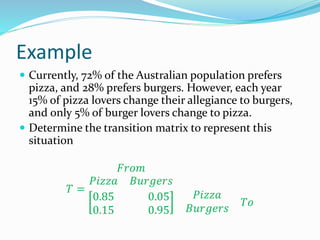
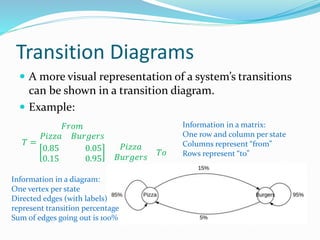
The document provides information about using transition matrices to model changing proportions in a population over time. It gives an example of predicting how many people will eat at two restaurants, Mia's Pizza and Dan's Dumplings, each week based on known switching percentages. Converting this example to a matrix equation, it shows there will be 135 customers at Mia's and 65 at Dan's the following week. It then explains key aspects of transition matrices, such as them being square with rows and columns for each state, and outlines another example involving food preferences in Australia.